UNIVERSITÉ DE MONTRÉAL
ANALYSIS OF THE GEOMECHANICAL BEHAVIOR OF TWO ADJACENT
BACKFILLED STOPES BASED ON TWO AND THREE DIMENSIONAL
NUMERICAL SIMULATIONS
NOOSHIN FALAKNAZ
DÉPARTEMENT DES GÉNIES CIVIL, GÉOLOGIQUE ET DES MINES ÉCOLE POLYTECHNIQUE DE MONTRÉAL
THÈSE PRÉSENTÉE EN VUE DE L’OBTENTION DU DIPLÔME DE PHILOSOPHIAE DOCTOR
(GÉNIE MINÉRAL) DÉCEMBRE 2014
UNIVERSITÉ DE MONTRÉAL
ÉCOLE POLYTECHNIQUE DE MONTRÉAL
Cette thèse intitulée :
ANALYSIS OF THE GEOMECHANICAL BEHAVIOR OF TWO ADJACENT
BACKFILLED STOPES BASED ON TWO AND THREE DIMENSIONAL
NUMERICAL SIMULATIONS
presentée par : FALAKNAZ Nooshin
en vue de l’obtention du diplôme de : Philosophiae Doctor a été dûment acceptée par le jury d’examen constitué de : M. SIMON Richard, Ph. D., président
M. AUBERTIN Michel, Ph. D., membre et directeur de recherche M. LI Li, Doctorat., membre et codirecteur de recherche
M. MBONIMPA Mamert, Ph. D., membre
DEDICATION
I dedicate this work to
my husband ARASH and my son ARYA
my precious and beloved parents &
ACKNOWLEDGEMENTS
I would like to express my deepest gratitude to my research supervisor Prof. Michel Aubertin for his open-ended support, guidance and extremely valuable advices in this project. This thesis have happened because of he inspired me through his devotion to academia. In addition to his help in writing the articles, and my dissertation, he has always given very generously his time to discuss various aspects of this project. Special thanks to my co-director Prof. Li Li who has given very precious advices during this project.
I would like to thank the industrial NSERC polytechnique-UQAT chair on Environment and Mine Wastes Management and from the Research Institute on Mines and the Environment (RIME UQAT-Polytechnique; RIME-IRME.ca) for financial support of this project.
I would also like to thank my friends, my colleagues and other members of RIME-IRME research group who helped me during this study.
I would like to conclude this section by thanking my husband Arash, my son Arya and my parents in Iran for their love, support and inspiration. My husband, Arash Khosravi, has always supported me to start my Ph.D and helped me unconditionally during these years. I owe him a special gratitude.
RÉSUMÉ
L'industrie minière génère de grandes quantités de rejets qui peuvent être utilisés dans des chantiers souterrains pour contrôler les mouvements du massif rocheux et fournir un lieu de travail plus sûr pour les mineurs et les équipements. La compréhension du comportement mécanique de ces matériaux est une question cruciale pour prévenir les instabilités et réduire les risques. Il est important d'évaluer l'état des contraintes dans ces chantiers pour assurer une application sécuritaire du remblai. Au cours des dernières années, beaucoup de travail a été réalisé afin d'évaluer les contraintes dans les chantiers remblayés uniques (isolés). La distribution des contraintes dans les chantiers uniques a notamment été analysée en fonction des paramètres de résistance au cisaillement du remblai, de la géométrie du chantier, des pressions interstitielle de l'eau et des conditions de remplissage. A ce jour, l’analyse du comportement du remblai n’a pas pris en compte l'effet de l'excavation d’ouvertures multiples, qui peuvent influencer l'ampleur et la distribution des contraintes, des déformations et des déplacements de la paroi. La plupart des études ont également considéré la masse rocheuse comme un matériau élastique, ce qui ne reflète pas bien sa réponse réelle.
L'objectif principal de ce projet de doctorat était d'analyser le comportement de deux chantiers remblayés adjacents créés en séquence, en utilisant des simulations numériques. Les simulations ont tenu compte de l'effet des différents paramètres tels que les propriétés du remblai, la géométrie des chantiers, la largeur du pilier, la profondeur des ouvertures, la résistance du massif rocheux, l’état des contraintes naturelles, et le séquence d'excavation et de remplissage. Ces simulations ont montré que la contrainte de cisaillement qui se développe près du massif produit effet d’arche dans les deux chantiers. Ces effet est plus prononcé dans les chantiers remblayés étroits. Les résultats montrent aussi que la répartition finale des contraintes dans la première ouverture remblayée, après la création du chantier voisin, dépend largement des propriétés du remblai. Ces résultats montrent comment divers facteurs peuvent influer sur l'amplitude et la distribution des contraintes dans le premier chantier remblayé, suite à la création d'une seconde ouverture. Les résultats des simulations sont aussi comparés avec des solutions analytiques existantes.
Lorsque le massif rocheux est considéré comme ayant un comportement élasto-plastique, l'ampleur des contraintes, les déplacements des parois et les déformations du remblai sont
différentes des valeurs obtenues pour un comportement élastique. Les résultats révèlent aussi des effets combinés de la réponse du massif et d'autres caractéristiques, y compris la géométrie des chantiers (taille et espacement), leur profondeur, l'état des contraintes naturelles, ainsi que les propriétés du remblai.
La résistance minimale du remblai nécessaire pour maintenir la stabilité d’une face exposée lors du retrait d’un mur de support a également été étudiée en utilisant des solutions analytiques et numériques. Les résultats montrent que certaines ces solutions analytiques t ne semblent pas bien refléter le comportement réel du remblai et les mécanismes menant à la rupture. Les résultats de simulations en 3D indiquent également que la géométrie du chantier peut grandement affecter la résistance requise pour le remblai exposé.
Il est également montré que le comportement mécanique des chantiers remblayés dépend de leur longueur (i.e. troisième dimension), en plus des autres facteurs déjà identifiés. L'ampleur des contraintes et leur distribution, les déplacements des rocheuses, et les déformations sont également affectés par cette troisième dimension. Ces résultats montrent également que la réponse de deux chantiers adjacents de longueur finis est différente de celle des chantiers de longueurs infinis (i.e. analysés en 2D).
ABSTRACT
The mining industry generates large amount of waste materials which can be used in underground stopes to control ground movement and provide a safer work place for workers and equipments. Understanding of the mechanical behavior of these materials is a critical issue to prevent problem risks. It is important to assess the stress state in these stopes to ensure safe application of the backfill. In recent years, much work has been conducted to evaluate the stresses in single backfilled stopes. To date most research has focused on analyzing the behavior of backfill in isolated stopes without taking into account the effect of the excavation of two adjacent openings. However, reaction of neighboring stope, can influence the magnitude and distribution pattern of stresses, wall displacements and strain within an existing backfilled stope.
The main objective of this project was to analyze the behavior of two adjacent backfilled stopes created in sequence using numerical simulations (FLAC and FLAC3D), taking into consideration the effect of different parameters such as backfill properties, stope geometry, pillar width, stope depth, rock mass strength parameters, and excavation and filling sequence. These simulations show that shear stresses develop near the rock mass wall and produce an arching effect in both stopes. Such arching effect is more pronounced in narrow backfilled stopes. The simulation results further indicate that the stress distribution in the first backfilled opening, following the creation of a second one, largely depends on the fill properties and other relevant parameters. These results show how these factors may affect the stress magnitude and distribution during and after the creation of a second opening. The simulations results are also compared with existing analytical solutions developed for isolated stopes.
When the rock mass behaves according to a elasto-plastic, the stress magnitude and pattern, wall displacements and backfill strains are significantly different from those obtained for an elastic rock mass behavior. The results shown here reveal the combined effects of the non-linear rock mass response and other characteristics including stopes geometry (size and spacing) and depth, natural stress state, and backfill properties. It is shown that the yielding of the backfill is affected by the rock mass behavior, and by other parameters such as backfill properties and stope geometry.
The minimum strength of the backfill required to maintain stability of an exposed face during removal of the support wall is also investigated using numerical simulations conducted
with FLAC3D. The results show that existing analytical solutions may not reflect the actual behavior of the backfill and related failure mechanism. The results also show how the stope geometry and backfill properties affect the required strength for the exposed backfill.
Additional simulations conducted with FLAC3D also show that the mechanical behavior of the backfilled stope depends on the stope length (third dimension). The stress magnitude and distribution, rock wall displacements and backfill strain are also affected by the stope third dimension.
TABLE OF CONTENTS
DEDICATION ... III ACKNOWLEDGEMENTS ... IV RÉSUMÉ ... V ABSTRACT ...VII LIST OF TABLES ... XIV LIST OF FIGURES ... XV LIST OF SYMBOLS AND ABBREVIATIONS... XXX LIST OF APPENDICES ... XXXIII
INTRODUCTION ... 1
CHAPTER 1 LITERATURE REVIEW ... 5
1.1 Mining Methods ... 5 1.2 Backfill classification ... 6 1.3 Backfill properties ... 7 1.3.1 Physical properties ... 7 1.3.2 Mechanical properties ... 8 1.3.3 Hydro-mechanical properties ... 11
1.4 Stress distribution and arching effects ... 13
1.4.1 Analytical solutions ... 13
1.4.2 Physical models and in-situ measurements ... 36
1.4.3 Numerical modeling ... 44
1.5 Summary and conclusion ... 59
CHAPTER 2 RESEARCH OBJECTIVE ... 62
2.2 Thesis objectives ... 63
2.3 Relevance of the thesis ... 64
2.4 Contributions ... 65
2.5 Outline of the thesis ... 66
CHAPTER 3 ARTICLE 1: NUMERICAL ANALYSES OF THE STRESS STATE IN TWO NEIGHBORING STOPES EXCAVATED AND BACKFILLED IN SEQUENCE ... 68
3.1 Introduction ... 69
3.2 Simulation with FLAC ... 70
3.2.1 Single stope ... 71
3.2.2 Two adjacent stopes ... 76
3.3 Influence of different parameters ... 84
3.3.1 Stope Width B ... 84
3.3.2 Depth of the openings ... 88
3.3.3 Internal friction angle ϕ' ... 90
3.3.4 Cohesion c' and Dilation Angle ψ' ... 91
3.4 Discussion ... 96
3.4.1 Stress distribution in isolated and adjacent stopes ... 96
3.4.2 Limitations and ongoing work ... 98
3.5 Conclusion ... 98
CHAPTER 4 ARTICLE 2: A NUMERCIAL INVESTIGATION OF THE GEOMECHANICAL RESPONSE OF ADJACENT BACKFILLED STOPES ... 104
4.1 Introduction ... 106
4.2 Modeling approach and simulated cases ... 107
4.3 Assumption for the backfill properties ... 107
4.5 Analyses of two adjacent stopes – Base Case ... 111
4.5.1 Stress State ... 111
4.5.2 Horizontal Displacements and Strains ... 114
4.6 Parametric analysis ... 117
4.6.1 Internal friction angle ϕ' of the backfill ... 118
4.6.2 Stope width B ... 118
4.6.3 Pillar width D ... 120
4.6.4 Natural stresses in the rock mass ... 125
4.6.5 Depth z and Elastic modulus Er of the rock mass ... 127
4.7 Discussion ... 131
4.7.1 Relationship between ϕ' and ν ... 131
4.7.2 Simulation procedure ... 132
4.7.3 Stress path ... 133
4.7.4 Final remarks ... 136
4.8 Conclusion ... 137
CHAPTER 5 ARTICLE 3: EVALUATION OF THE STRESS STATE IN TWO ADJACENT BACKFILLED STOPES WITHIN AN ELASTO-PLASTIC ROCK MASS ... 143
5.1 Introduction ... 144
5.2 Conceptual models and rock mass behavior ... 145
5.3 Stress distribution in an isolated stope ... 146
5.4 Stress distribution in two adjacent stopes ... 148
5.4.1 Stress state ... 150
5.4.2 Displacements and strains ... 157
5.4.3 Stress path ... 160
5.5.1 Width B ... 163
5.5.2 Pillar width D ... 165
5.5.3 Stope depth z ... 168
5.5.4 Natural stress ratio in the rock mass, Kr ... 171
5.5.5 Modulus Erm and strength parameters crm and ϕrm of the rock mass... 173
5.6 Discussion ... 175
5.6.1 EP vs EL model ... 176
5.6.2 Simulation procedure ... 177
5.7 Conclusion ... 178
CHAPTER 6 ARTICLE 4: STABILITY ANALYSES OF BACKFILL IN MINE STOPES WITH AN OPEN FACE ... 183
6.1 Introduction ... 185
6.2 Numerical modeling with FLAC3D ... 186
6.3 Simulation results ... 191
6.3.1 Behavior of stopes with different lengths ... 191
6.3.2 Behavior of stopes with a larger width B ... 201
6.3.3 Behavior of stopes with a smaller height H ... 204
6.3.4 Effect of wall removal sequence ... 208
6.4 Analytical solutions for the required strength of cemented backfill ... 211
6.4.1 Original solution of Mitchell et al. (1982) ... 211
6.4.2 Modified Mitchell (MM) solution ... 213
6.4.3 Solution of Li and Aubertin (2014) ... 213
6.4.4 Comparison with numerical results ... 214
6.5 Discussion ... 217
CHAPTER 7 OTHER THREE DIMENSIONAL ANALYSES AND DISCUSSION ... 223
7.1 Introduction ... 223
7.2 Simulation procedures ... 224
7.3 Behavior of a single stope ... 226
7.4 Two adjacent stopes ... 231
7.4.1 Plane strain ... 231
7.4.2 3D Conditions ... 232
7.4.3 Effect of other parameters ... 240
7.5 Final remark ... 244
CHAPTER 8 SUMMARY AND GENERAL DISCUSSION ... 245
8.1 Main results ... 245
8.2 Discussion ... 251
CONCLUSION AND RECOMMENDATIONS ... 256
REFERENCES ... 262
LIST OF TABLES
Table 1.1: Density index for hydraulic fills (after Potvin et al. 2005) ... 8 Table 1.2: The strength properties of the field CPB and laboratory prepared CPB (after Le Roux
et al. 2005) ... 42 Table 3.1: Parameters used in the numerical simulations, including stope size, backfill properties,
and number of elements in the mesh (with height h = 45 m, pillar width D = 8 m, and backfill modulus E = 300 MPa) ... 73 Table 4.1: Parameters used in the numerical simulations, including stope size and material
properties (with H = 45 m and Eb = 300 MPa) ... 110
Table 5.1 : Rock mass parameters used in the numerical simulations with the elasto-plastic (EP) model (based on Bieniawski’s 1989 RMR characterisation method and on values suggested by Hoek et al. 2002) ... 149 Table 5.2 : Backfill properties and stopes characteristics used in the numerical simulations (with
H = 45. 5 m, with a void space of 0.5 m; h = 45 m; E = 300 MPa, µ = 0.3, c' = 0, ϕ' = 35°)
... 149 Table 6.1: Backfill properties and stope characteristics adopted for the numerical simulations
(stope depth z = 300 m; E = 300 MPa, ν= 0.3 and related ϕ' = 35°, γ = 18 kN/m3) ... 188 Table 7.1: Parameters used in the numerical simulations, including stope size and backfill
properties (with stope height H = 45.5 m, pillar width D = 8 m, and backfill modulus E = 300 MPa) ... 225
LIST OF FIGURES
Figure 1-1: Uniaxial compressive strength of paste fill after 112 days of curing; results for: a)
different proportion of binder; b) different type of binder (after Belem et al. 2000) ... 9
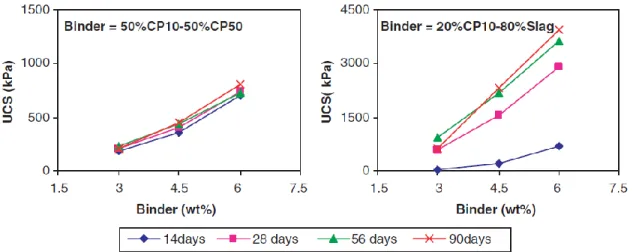
Figure 1-2: Effect of binder proportion on the mechanical strength of paste backfill as a function of curing time (after Benzaazoua et al. 2004) ... 10
Figure 1-3: Variation of shear strength of paste backfill due to: a) binder type; b) binder proportion (after Belem et al. 2000) ... 11
Figure 1-4: Influence of applied load on the UCS of paste backfill (after Belem et al. 2002) ... 12
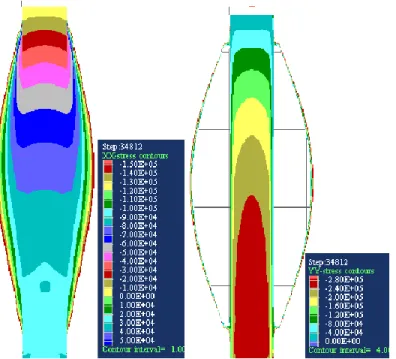
Figure 1-5: A typical arching phenomenon in a backfilled stope: a) vertical stress; b) horizontal stress (Falaknaz et al. 2013, see also Chapter 3) ... 14
Figure 1-6: A vertical backfill stope and acting forces on the layer element (after Aubertin et al. 2003) ... 15
Figure 1-7: A vertical backfill stope under partially submerged condition in 2D (after Li and Aubertin, 2009c) ... 17
Figure 1-8: Characteristics of an inclined backfilled stope (after Ting et al. 2011) ... 20
Figure 1-9: An inclined backfill stope with non-parallel walls (after Ting et al. 2014) ... 21
Figure 1-10: An inclined backfill stope with parallel walls (after Singh et al. 2011) ... 22
Figure 1-11: A trench with inclined walls (after Li et al. 2013) ... 22
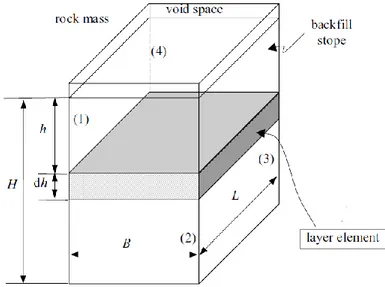
Figure 1-12: A 3D vertical backfill stope with the acting forces on the layer element (after Li et al. 2005) ... 24
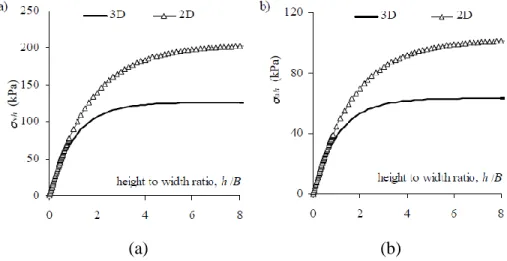
Figure 1-13: Calculated values of the: a) vertical stress; b) horizontal stress (versus ratio h/B). In these cases B = 6 m, L=10 m (in 3D), c =1 kPa, δ = ϕ = 30°, γ =20 kN/m3, K=Ko= 0.5, (after Li et al. 2005) ... 25
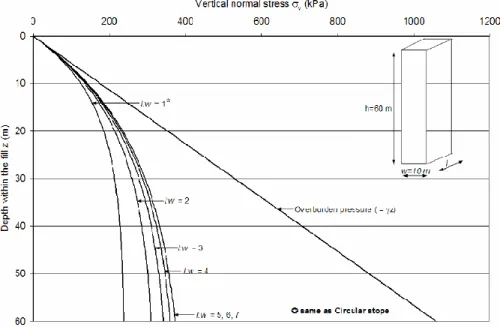
Figure 1-14: Vertical normal stress within the stope for different stope aspect ratios (l/w) using 3D solution (after Pirapakaran, 2008) ... 26
Figure 1-15: A 3D vertical backfilled stope in the presence of water (after Li and Aubertin, 2009b) ... 27
Figure 1-16: (a) Vertical; (b) horizontal stresses (total and effective) versus elevation h; K=Ka,
phreatic surface is at Hm = 5m, B =10 m, L = 20m, ϕ = 30°, γ = 18 kN/m3, saturated fill is ϕm= ϕsat= δm= δsat = 30, γsat = 20 kN/m3, po = 50 kPa (after Li and Aubertin, 2009c) ... 28
Figure 1-17: A confined block with an open face (after Mitchell et al. 1982) ... 29 Figure 1-18: A confined inclined block with an open face (after Dirige et al. 2009) ... 30 Figure 1-19: A vertical backfill stope with an access drift under fully drained (u = 0) condition
(after Li and Aubertin, 2009d) ... 33 Figure 1-20: Horizontal stress distribution with different: a) backfill friction angle; b) drift width;
c) drift height, along the drift, at h =1m (after Li and Aubertin, 2009d) ... 35 Figure 1-21: A 3D view of vertical backfilled stope and access drift with barricade (after Li and
Aubertin, 2009e) ... 35 Figure 1-22: General views of: a) the model frame, b) failure test with a surcharge (Mitchell et al.
1982) ... 37 Figure 1-23: Vertical stress measured along square and circular stopes during experimental tests
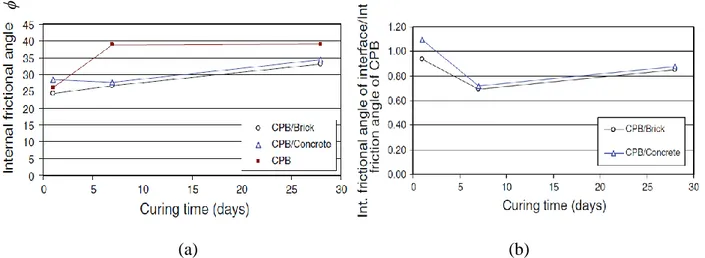
on physical models (after Pirapakaran, 2008) ... 38 Figure 1-24: Time dependent behaviour: a) evaluation of the internal friction angle (ϕ) of the
backfill CPB and at the interfaces CPB-brick and CPB-concrete; b) evaluation of the ratio of interface friction angle (δ) at the interfaces CPB-brick and CPB-concrete to internal friction angle (ϕ) of the CPB (after Fall and Nasir, 2010) ... 39 Figure 1-25: Pressure readings vs time for pressure cells and piezometers: a) total stress; b)
effective vertical stress in the stope and on the barricade (after Ouellet and Servant, 1998b) ... 40 Figure 1-26: General views of : a) the filling of the stope with cement paste in three sequences, b)
variation of the lateral pressure σx-b on the barricade as a function of the filling height (after
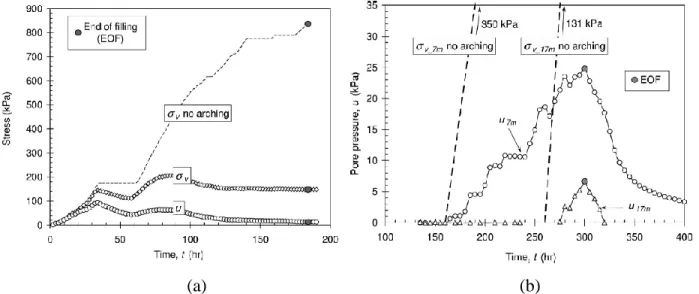
Belem et al. 2004) ... 41 Figure 1-27: In situ measurement of pore water pressure (u) and total vertical stress (σv) at the
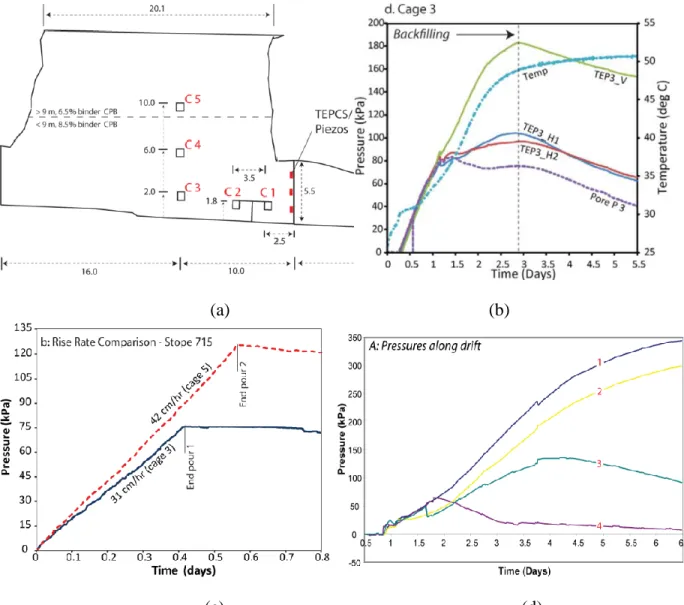
Figure 1-28: In situ measurement in the Cayeli mine (a to c) and the Kidd mine (d): a) cross section of the instruments, b) an example of total earth pressure (TEP), pore water pressure (Pore P) and temperature measured at C3, c) pressures measured for two CPB filling rates in
the 715 stope at C3 and C5, d) total earth pressure along the long axis of the stope for C1-4
and fill barricade (after Thompson et al. 2009, 2011, 2012) ... 44 Figure 1-29: (a) A vertical backfilled stope with the main properties of rock mass and backfill;
Stress distribution in the backfill stope calculated with FLAC ; b) vertical stress; c) horizontal stress (after Li et al. 2003) ... 46 Figure 1-30: The stress distribution along the vertical central line obtained by the numerical and
analytical solutions; a) vertical stresses, b) horizontal stresses (after Li et al. 2003) ... 46 Figure 1-31: Vertical σv and horizontal σh stresses for H = 45m, B = 18m, ϕ =30°; a) σh along the
central line; b) σv along the central line; c) σh along the wall; d) σv along the wall; e) σh at
different depth across the width; f) σvx at different depth across the width (after Li and
Aubertin, 2008) ... 47 Figure 1-32: (a) An inclined backfilled stope simulated with FLAC; stress distribution obtained
using FLAC: a) horizontal stress; b) vertical stress, simulations for stope inclination α = 80°,
γ =18 kN/m3
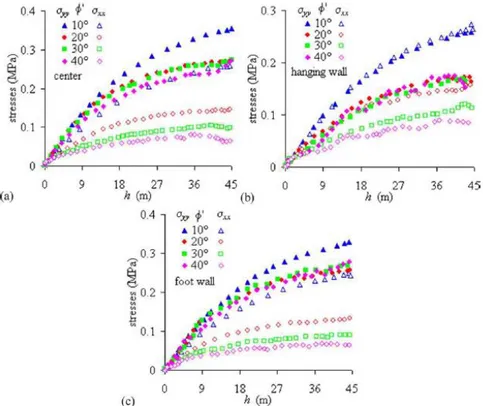
, ν = 0.2, ϕ́ =30°, ψʹ = 0° (after Li and Aubertin, 2009a) ... 47 Figure 1-33: Stress variation for different stope inclination α: a) at mid height of the stope; b)
along central line; c) along hanging wall; d) along the foot wall (after Li et al. 2009a) ... 48 Figure 1-34: Stress variation for two stope widths: a) along the central line; b) along the hanging
wall; c) along the foot wall (α = 75°) (after Li and Aubertin, 2009a) ... 49 Figure 1-35: Stress variation for different backfill friction angle ϕ́: a) along the central line; b)
along the hanging wall; c) along the foot wall (α = 75°) (after Li and Aubertin, 2009a) ... 49 Figure 1-36: Stress variation for different backfill cohesion ć (multi-step filling): a) along the
central line; b) along the hanging wall; c) along the foot wall (α = 75°) (after Li and Aubertin, 2009a) ... 50 Figure 1-37: Stress variation for different backfill dilatancy angle ψ́ (multi-step filling): a) along
the central line; b) along the hanging wall; c) along the foot wall (α = 75°) (after Li and Aubertin, 2009a) ... 51
Figure 1-38: Stress distribution obtained with multistep simulation along the central line (after Li and Aubertin, 2009a) ... 51 Figure 1-39: Vertical and horizontal effective and total stresses: a) along the VCL; b) near the
wall calculated by proposed analytical and numerical solution; partially submerged condition (after Li and Aubertin, 2009c) ... 52 Figure 1-40: Simulations results and in-situ measurements data for stope 715-N22 at Çayeli Bakir
Mine: a) near the drift, b) near the stope center (after Veenstra, 2013) ... 54 Figure 1-41: Barricade and stope geometry: a) instantaneously filled stope; b) a stope with
vertical drainage and sequential filling (after El Mkadmi et al. 2011) ... 56 Figure 1-42: Investigation of the: a) total vertical stress and; b) PWP; c) effective vertical stresses
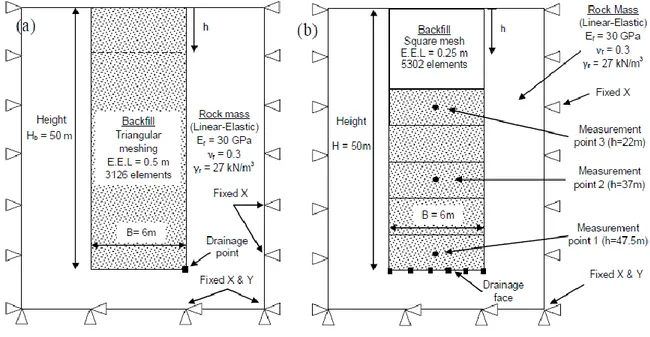
of saturated backfilled stope along the VCL for an instantaneously filled stope (after El Mkadmi et al. 2011, 2014) ... 57 Figure 3-1: Backfilled stope model for the base case (Case 0): (a) schematic view (not to scale),
with properties and boundary conditions used for the simulations with FLAC; numerical simulation results with isocontours of (b) horizontal stresses and (c) vertical stresses distributions at the end of filling (see Table 3.1 for details) ... 72 Figure 3-2: Horizontal and vertical stresses along (a) the VCL and (b) walls of a single stope
(base Case 0) obtained using the analytical (Eqs. 3-1 to 3-2) and numerical (using FLAC) solutions; the overburden pressures (with σv = h and σh = Ko σv; Ko= 1-sinϕ') at different
elevations h are also shown ... 75 Figure 3-3: Schematic view of the boundary conditions, size and properties applied for simulating
the response of two vertical backfilled stopes (not to scale) in plane strain (with an earth pressure coefficient Kr = 2 in the rock mass) ... 76
Figure 3-4: Numerical simulation results showing the non-symmetric stress state in the two adjacent backfilled stopes at the end of filling of the second stope (Case 1b): (a) horizontal stresses σh; (b) vertical stresses σv. These stresses can be compared with those obtained for a
Figure 3-5: Horizontal (left) and vertical (right) stresses along VCL of the first backfilled stope (Case 1b), (a) during the 4 steps for excavating the second stope; (b) during the 4 steps for filling the second stope; the results for the single stope (Case 0) are also shown ... 79 Figure 3-6: Horizontal (left) and vertical (right) stresses along the (a) left wall and (b) right wall
of the first and second stopes, after excavation and filling of the latter (Case 1b); the results for the single stope (Case 0) are also shown ... 81 Figure 3-7: Horizontal displacements δh along the (a) left wall and (b) right wall of the first stope
during the excavation (4 steps) of the second stope (Case 1b) ... 82 Figure 3-8: Horizontal displacements δh along the (a) left wall and (b) right wall of the first stope
during filling (4 steps) of the second stope (Case 1b) ... 83 Figure 3-9: Horizontal strain εh along the VCL of the first backfilled stope during (a) excavation
(4 steps) and (b) filling (4 steps) of the second stope (Case 1b) ... 84 Figure 3-10: Distribution of the (a) horizontal stresses σh and (b) the vertical stresses σv in the two
adjacent backfilled stopes at the end of filling of the second stope, for stopes having a width B = 18 m (Case 2)... 85 Figure 3-11: Effect of stope width B on the vertical and horizontal stresses in the first backfilled
stope along the (a) VCL; (b) left wall; (c) right wall after excavation and filling of the second stope (Case 2) ... 86 Figure 3-12: Horizontal displacements δh in the first stope along the left wall and right wall after
(a) excavation and (b) filling of the second stope (Case 2) ... 87 Figure 3-13: Effect of stope depth z (base of the opening, distance from the surface) on the
vertical and horizontal stresses in the first backfilled stope along the (a) VCL, (b) left wall, and (c) right wall, after excavation and filling of the second stope (Case 5) ... 89 Figure 3-14: Horizontal displacements δh in the first backfill stope along the (a) left wall and (b)
right wall; (c) horizontal strain εh along the VCL; the results are shown after excavation and
Figure 3-15: Effect of backfill internal friction angle ϕ' on the stress distribution along the VCL and the left and right walls in the first backfilled stope, after (a) excavation and (b) filling of the second stope (Cases 1a,b,c) ... 92 Figure 3-16: Vertical σv and horizontal stresses σh along the (a) VCL and (b) walls of the second
backfilled stope (Case 1a,b,c) and a single backfilled stope (Case 0) obtained using the analytical (Eqs. 3-1 to 3-2) and numerical (using FLAC) solutions for different internal friction angles ... 93 Figure 3-17: Effect of backfill cohesion c' on the stress distribution along the VCL of the first
stope after (a) excavation and (b) filling of the second stope (Case 3) ... 94 Figure 3-18: Effect of backfill cohesion c' on the stress distribution along the (a) left wall and (b)
right wall of the first stope, after excavation of the second stope (Case 3) ... 95 Figure 3-19: Effect of backfill cohesion c', internal friction angle ϕ' and dilation angle ψ' on the
stress distribution along the VCL of the first stope after excavation and filling of the second stope (Case 4) ... 96 Figure 3-20: Effect of backfill cohesion c', internal friction angle ϕ' and dilation angle ψ' on the
stress distribution along the (a) left wall and (b) right wall of the first stope after excavation and filling of the second stope (Case 4) ... 97 Figure 4-1: Single backfilled stope (Reference case): (a) a schematic view of the boundary
conditions, size and properties applied for a single stope (not to scale), in plane strain, (b) numerical modeling results showing the horizontal (left) and vertical (right) stress distributions at the end of filling of the second stope (see Table 4.1 for details) ... 109 Figure 4-2: Case 0b: (a) schematic view of the boundary conditions, size and properties applied
for the simulations of the two backfilled stopes (not to scale), (b) modeling results showing the horizontal (left) and vertical (right) stress distributions in the two adjacent backfilled stopes at the end of filling of the second stope ... 112 Figure 4-3: Horizontal (a) and vertical (b) stresses along the VCL of the first backfilled stope; the
resultants are shown for a single stope (reference case) and for the first and second stopes after excavation and filling of the latter (Case 0b) ... 113
Figure 4-4: Horizontal displacements h along the left wall (left side) and right wall (right side)
of: (a) the first stope; (b) second stope, during excavation of the second stope (Case 0b) .. 115 Figure 4-5: Horizontal displacements h along the left wall (left side) and right wall (right side) of
(a) the first stope; (b) second stope, during filling of the second stope (Case 0b) ... 116 Figure 4-6: Horizontal strain εh along the VCL of (a) the first and (b) single stope and second
stope (in the backfill) after filling of the second stope obtained (Case 0b) ... 118 Figure 4-7: Effect of the internal friction angles ϕ' of the backfill on the horizontal (a) and
vertical (b) stresses along VCL of the first backfilled stope (Case 0) ... 119 Figure 4-8: Effect of stope width B on the horizontal σh and vertical σv stresses along VCL of the
first backfilled stope (Case 1) ... 119 Figure 4-9: Effect of pillar width D on the distribution of the vertical and horizontal stresses in
the first stope along the VCL after: (a) excavation; (b) filling of the second stope (Case 2) ... 121 Figure 4-10: Effect of pillar width D on the distribution of the vertical and horizontal stresses in
the first stope along the left wall (left side) and right wall (right side) in the backfill after: (a) excavation; (b) filling of the second stope (Case 2) ... 122 Figure 4-11: Effect of pillar width D on the horizontal displacements h in the first stope along
the: (a) left wall; (b) right wall; (c) horizontal strains εh in the backfill along the VCL after
excavation of the second stope (Case 2) ... 123 Figure 4-12: Effect of pillar width D on the distribution of the vertical and horizontal stresses
along the VCL of first stope after excavation (left side) and filling (right side) of the filled stope for: (a) Case 3a with c' = 20 kPa; (b) Case 3b with c' = 50 kPa ... 124 Figure 4-13: Effect of Kr value on the distribution of the vertical and horizontal stresses in the
first stope along the VCL after excavation of the second stope (Case 4) ... 125 Figure 4-14: Effect of the Kr value on the horizontal displacements h in the first stope along the
(a) left wall and (b) right wall; (c) horizontal strains εh in the backfill after excavation of the
Figure 4-15: Effect of rock modulus Er on the distribution of the vertical and horizontal stresses
in the first stope along the VCL after excavation of the second stope (Case 5) ... 127 Figure 4-16: Effect of rock modulus Er on the horizontal displacements h in the first stope along
the (a) left wall and (b) right wall; (c) horizontal strains εh in the backfill after excavation of
the second stope (Case 5) ... 128 Figure 4-17: Effect of rock modulus Er and depth z on the distribution of the (a) horizontal and
(b) vertical stresses in the first stope along the VCL in the backfill after excavation of the second stope (Case 6). ... 129 Figure 4-18: Effect of rock modulus Er and depth z on the horizontal displacements h in the first
stope along the (a) left wall and (b) right wall; (c) horizontal strains εh along the VCL in the
first backfilled stope after excavation of the second stope (Case 6) ... 130 Figure 4-19: Horizontal (a) and vertical (b) stresses along VCL in the first backfilled stope, using
independent ν and ϕ' values (Case 7, solid lines) and Eq.4-4 (Case 7, dash lines) after filling of the second stope ... 132 Figure 4-20: Effect of the filling sequence (4 to 10 layers) on the distribution of the vertical and
horizontal stresses in the first backfilled stope along the VCL (Case 8) ... 133 Figure 4-21: Stress path obtained in three different locations (z = 9 m, 18 m, 27 m from the top)
along the VCL of the first backfilled stope during excavation and filling of the second stope ... 135 Figure 4-22: Deviatoric stresses and the horizontal strains εh obtained in three different locations
along the VCL of the first backfilled stope during excavation and filling of the second stope ... 136 Figure 5-1 : Model of a single backfilled stope (h = 45m) which serves as the base (reference)
case (Case 0); size (not to scale) and properties (a); simulated isocontours of horizontal (left) and vertical (right) stresses for (b) an elastic rock mass behavior (EL, Case 0a) and an elasto-plastic rock mass behavior (EP, Case 0b); similar stresses are obtained for the EP and EL models in this case ... 150 Figure 5-2: Horizontal and vertical stresses obtained along the (a) VCL and (b) walls of a single
overburden pressures (i.e. σv = h and σh = Ko σv, with Ko= 1-sinϕ') at different depth h are
also shown ... 151 Figure 5-3: Conceptual model of two vertical backfilled stopes, with the boundary conditions,
size and properties used for some of the simulations (not to scale) ... 152 Figure 5-4: Numerical results showing isocontours of the horizontal (left side) and the vertical
(right side) stresses for: (a) an elastic rock mass behavior (EL, Case 1a) and (b) an elasto-plastic rock mass behavior (EP, Case 1b) ... 153 Figure 5-5 : Horizontal (left) and vertical (right) stress distributions along the VCL of the first
backfilled stope for an elastic (EL, Case 1a) and elasto-plastic (EP, Case 1b) rock mass (a) during the 4 steps for excavating the second stope; (b) during the 4 steps for filling the second stope ... 154 Figure 5-6: Horizontal (left) and vertical (right) stress distributions along VCL of the first
backfilled stope, after excavation and filling of the second stope, for (a) an elasto-plastic rock mass behavior (EP, Case 1b) and (b) an elastic rock mass behavior (EL, Case 1a); the results along the VCL of the single and second stope are also shown ... 156 Figure 5-7 : Horizontal displacements h along the: (a) left wall, (b) right wall of the first stope
during excavation (4 steps) of the second stope for the EP model (Case 1b), and for the EL model (Case 1a); the horizontal displacements h of the walls in a single stope with the EP
model are also shown ... 158 Figure 5-8 : Horizontal strain εh along the VCL of the first stope for: (a) an elasto-plastic rock
mass behavior (EP, Case 1b) and (b) an elastic rock mass behavior (EL, Case 1a) after excavation of the second stope ... 159 Figure 5-9 : Stress path at three different locations (h = 9 m, 18 m, 27 m from the top) along the
VCL of the first stope for: (a) an elasto-plastic rock mass behavior (EP, Case 1b) and (b) an elastic rock mass behavior (EL, Case 1a) during the 9 steps (i.e. excavation and filling of the second stope) ... 161 Figure 5-10 : Mean s stresses and horizontal strains εh at three different locations (h = 9 m, 18 m,
mass behavior (EP, Case 1b), (b) an elastic rock mass behavior (EL, Case 1a) during the 9 steps (i.e. excavation and filling of the second stope) ... 162 Figure 5-11: Effect of stope width B on the vertical and horizontal stresses in the first backfilled
stope for an elasto-plastic rock mass behavior (EP) along the (a) VCL; (b) left wall; (c) right wall, after excavation and filling of the second stope (Case 2) ... 164 Figure 5-12: Effect of stope width B on the stress path at three different locations (h = 9 m, 18 m,
27 m from the top) along the VCL of the first backfilled stope during the 9 steps (i.e. excavation and filling of the second stope) (Case 2) ... 165 Figure 5-13 : Effect of pillar width D on the vertical and horizontal stresses in the first backfilled
stope for an elasto-plastic rock mass behavior (EP) along the: (a) VCL; (b) left wall; (c) right wall, after excavation and filling of the second stope (Case 3) ... 166 Figure 5-14 : Effect of pillar width D on the stress path at three different locations (h = 9 m, 27
m, from the top) along the VCL of the first backfilled stope during the 9 steps (i.e. excavation and filling of the second stope) for: (a) D = 24m (Case 3); (b) D = 60m (Case 3) ... 168 Figure 5-15 : Effect of stope depth z on the vertical and horizontal stresses in the first backfilled
stope for an elasto-plastic rock mass behavior (EP) along the: (a) VCL; (b) left wall; (c) right wall, after excavation and filling of the second stope (Case 4) ... 169 Figure 5-16: Effect of stope depth z on the stress path at three different locations (h = 9 m, 27 m,
45 m from the top) along the VCL of the first backfilled stope during the 9 steps (i.e. excavation and filling of the second stope) (Case 4) ... 170 Figure 5-17: Effect of Kr on the vertical and horizontal stresses in the first backfilled stope for an
elasto-plastic rock mass behavior (EP) along the: (a) VCL; (b) left wall; (c) right wall, after excavation and filling of the second stope (Case 5) ... 172 Figure 5-18 : Effect of Kr on the stress path at three different locations (h = 9 m, 27 m, 45 m from
the top) along the VCL of the first backfilled stope during the 9 steps (i.e. excavation and filling of the second stope) for: (a) Kr = 1 (Case 5); (b) Kr = 4 (Case 5) ... 173
Figure 5-19 : Effect of rock modulus Erm (and strength parameters, cr, ϕr) on the vertical and
along the: (a) VCL; (b) left wall; (c) right wall, after excavation and filling of the second stope (Case 6) ... 174 Figure 5-20 : Effect of rock modulus Erm (and strength parameters, cr, ϕr) on the stress path at
three different locations (h = 9 m, 27 m, 45 m from the top) along the VCL of the first backfilled stope during the 9 steps (i.e. excavation and filling of the second stope) (Case 6) ... 175 Figure 6-1: Model of two adjacent stopes with the size and boundary conditions (not to scale) 189 Figure 6-2: Model of a primary backfilled stope with the vertical lines used for presenting the
results (not to scale) ... 190 Figure 6-3: Vertical (szz) and horizontal (sxx) stresses distributions obtained along the vertical
plane CʹAʹDʹ-DAC (Fig. 6-2) in the primary backfilled stope before (BWR) and after (AWR) front wall removal: (a) with c = 30 kPa, (Case 19,30, stable backfill); (b) with c = 10
kPa (Case 19,10, unstable backfill) ... 192
Figure 6-4: Horizontal stresses (a) Sxx and (b) Syy, and (c) vertical Szz stresses along the VCL (line
AAʹ), back wall (line CCʹ), sidewalls (line BBʹ) and open face (line DDʹ) of the primary backfilled stope before (BWR) and after (AWR) front wall removal (Case 19,30, stable
backfill) ... 194 Figure 6-5: Horizontal stresses (a) Sxx and (b) Syy, and (c) vertical Szz stresses along the VCL (line
AAʹ), back wall (lines CCʹ), sidewalls (line BBʹ) and open face (line DDʹ) of the primary backfilled stope before (BWR) and after (AWR) front wall removal; (Case 19,10, unstable
backfill) ... 196 Figure 6-6: Displacement isocontours on plane CʹAʹDʹ-DAC (Fig. 6-2) and displacement vectors
toward the open face in the primary backfilled stope after (AWR) front wall removal (a) Case 19,30, stable backfill (b) Case 19,10 unstable case ... 197
Figure 6-7: Isocontours of strength/stress ratio (FS) in the primary backfilled stope after (AWR) front wall removal: (a) Case 19,30, stable backfill (b) Case 19,10, unstable backfill ... 198
Figure 6-8: Horizontal stresses Sxx in the primary backfilled stope along the VCL (line AAʹ), back
(AWR) front wall removal: (a) Case 130,85, stable backfill (b) Case 130,60, unstable backfill
... 199 Figure 6-9: Horizontal stresses Syy in the primary backfilled stope along the VCL (line AAʹ), back
wall (lines CCʹ), sidewalls (line BBʹ) and open face (line DDʹ) before (BWR) and after (AWR) front wall removal: (a) Case 130,85, stable backfill (b) Case 130,60, unstable backfill
... 200 Figure 6-10: Displacement isocontours along plane CʹAʹDʹ-DAC (Fig. 6-2) in the primary
backfilled stope after (AWR) front wall removal with: (a) Case 130,85, stable backfill (b)
Case 130,60, unstable backfill; the sliding plane angle α can also be seen for Case 130,60 ... 201
Figure 6-11: Isocontours of strength/stress ratio (FS) in the primary backfilled stope after front wall removal with: a) Case 130,85, stable backfill (b) Case 130,60, unstable backfill ... 202
Figure 6-12: Horizontal stresses Sxx in the primary backfilled stope for B = 25m along the VCL
(line AAʹ), back wall (lines CCʹ), sidewalls (line BBʹ) and open face (line DDʹ) before (BWR) and after (AWR) front wall removal: (a) Case 225,30, stable backfill (b) Case 225,20,
unstable backfill ... 203 Figure 6-13: Displacement contours of backfill along plane CʹAʹDʹ-DAC (Fig. 6-2) in the primary
backfilled stope after (AWR) front wall removal: (a) Case 225,30, stable backfill (b) Case
225,20, unstable backfill ... 204
Figure 6-14: Isocontours of strength/stress ratio (FS) in the primary backfilled stope (B = 25 m) after front wall removal: (a) Case 225,30, stable backfill (b) Case 225,20, unstable backfill .... 205
Figure 6-15: Horizontal stresses Sxx in the primary backfilled stope (H = 25 m) along the VCL
(line AAʹ), back wall (lines CCʹ), sidewalls (line BBʹ) and open face (line DDʹ) before (BWR) and after (AWR) front wall removal: (a) Case 325,24, stable backfill (b) Case 325,20,
unstable backfill ... 206 Figure 6-16: Displacement isocontours in the primary backfilled stope (H = 25 m) after (AWR)
front wall removal: (a) Case 325,24, stable backfill (b) Case 325,20, unstable backfill ... 207
Figure 6-17: Isocontours of strength/stress ratio (FS) in the primary backfilled stope (H= 25 m) after front wall removal: (a) Case 325,24, stable backfill (b) Case 325,20, unstable backfill ... 208
Figure 6-18: Effect of the number of excavation steps to create the secondary stope (removal of the front wall) on the displacements of the backfill in the primary stope: (a) one excavation step (Case 41) unstable backfill, (b) four excavation steps (Case 44), stable backfill (c) seven
excavation steps (Case 47) stable backfill with c = 30 kPa ... 209
Figure 6-19: Effect of the number of excavation steps to create the secondary stope (removal of the front wall) on the displacements of the backfill in the primary stope: (a) one excavation step (Case 51), (b) four excavation steps (Case 54), unstable backfill with c = 20 kPa ... 210
Figure 6-20: Effect of the number of excavation steps to create the secondary stope (removal of the front wall) on the displacements of the backfill in the primary stope: (a) one excavation step (Case 61), (b) four excavation steps (Case 64), stable backfill with c = 20 kPa ... 211
Figure 6-21: Wedge block model for the backfilled stope with an open face (after Mitchell et al. 1982) ... 212 Figure 6-22: Required backfill cohesion c (for FS = 1): (a) variation of stope length, L, (H = 45m,
B = 6 m), (b) variation of stope width, B, (L = 9m, H = 45m), (c) variation of stope height, H, (L = 9m, B = 6m); Results obtained from three analytical solutions and numerical
simulations (with a zero tensile strength cut-off) ... 216 Figure 6-23: Variation of the sliding plane angle α with stope sizes (L, B, H) obtained from the
numerical simulations for stope with an open face (base values L=9m, B=6m, H=45m) ... 217 Figure 7-1: Backfilled stope model for the base case: (a) schematic view (not to scale) of the
model, with properties and boundary conditions used for the 2D simulations with FLAC (Case 0a), (b) schematic view (not to scale), with axes and boundary conditions used for the simulations with FLAC3D ... 227 Figure 7-2: Numerical simulation results with isocontours of the vertical stresses σvz (left side)
and horizontal stresses σhx (right side) for : (a) the 2D simulations with FLAC, (b) the
simulations with FLAC 3D; the results are shown along plane BCCʹBʹ at the end of filling (see Table 7.1 for details) ... 228 Figure 7-3: Vertical σvz (z axis) and horizontal stresses σhx (x axis) along the VCL of the first
using the analytical (Eqs. 7-1 to 7-8) and numerical (using FLAC and FLAC 3D) solutions ... 230 Figure 7-4: Horizontal σhx (a) and vertical σvz (b) stresses along VCL (line AAʹ, along the x and z
axes) in the first backfilled stope obtained under 3D conditions with FLAC3D (Case 1) for different stope length L at the end of filling; the results obtained under plane strain condition (2D, Case 0a) are also shown ... 231 Figure 7-5: Modeling results showing the vertical (left) and horizontal (right) stress distributions
obtained using 2D condition in the two adjacent backfilled stopes at the end of filling of the second stope (Case 2a) ... 232 Figure 7-6: (a) schematic view (not to scale) of the model with two stopes with axes and
boundary conditions used for the simulations with FLAC3D; numerical results showing isocontours (Case 2b, L = 60 m) of : (b) the vertical stresses σvz, and (c) horizontal stresses σhx (along plane BCCʹBʹ) for two adjacent stopes at the end of filling ... 233
Figure 7-7: Horizontal σhx (a) and vertical σvz (b) stress distributions along the VCL (Line AAʹ)
of the first backfilled stope for 2D (Case 2a) and 3D conditions with L = 60 m (Case 2b) at the end of filling of the second stope; These stresses can be compared with those obtained for a single stope with L = 60 m (Case 0b, Figure 7-3)... 234 Figure 7-8: Horizontal displacements hx along the: (a) left wall (Line BBʹ), (b) right wall (Line
CCʹ) of the first stope during excavation (4 steps) of the second stope for Case 2a and Case 2b ... 236 Figure 7-9: Horizontal strains εhx along the VCL (line AAʹ) of the first stope during excavation (4
steps) of the second stope: a) Case 2a (2D), and b) Case 2b, 3D with L =60 m ... 236 Figure 7-10: Horizontal σhx (a) and vertical σvz (b) stresses along the VCL (Line AAʹ) of the first
backfilled stope for a stope, with length L = 9m (Case 3) at the end of filling of the second stope; these stresses are compared with those obtained for a single stope of the same size 237 Figure 7-11: Horizontal displacements hx obtained along the: (a) left wall (line BBʹ), and (b)
right wall (line CCʹ); (c) horizontal strains εhx along the VCL (line AAʹ); results shown for
the first backfilled stope with a length L = 9 m (Case 3) after excavation of the second stope ... 239
Figure 7-12: Effect of the internal friction angles ϕ' of the backfill on the horizontal σhx and
vertical σvz stresses along VCL (line AAʹ) of the first backfilled stope with B = 6m for: (a)
Case 4a with 𝐿 = ∞ (2D), (b) Case 4b (3D) with L = 9m ... 241 Figure 7-13: Effect of the cohesion c' of the backfill on the horizontal σhx and vertical σvz stresses
along VCL (line AAʹ) of the first backfilled stope with B = 6m for: (a) Case 5a with 𝐿 = ∞ (2D), (b) Case 5b (3D) with L = 9m ... 241 Figure 7-14: Effect of stope depth z on the horizontal σhx and vertical σvz stresses along VCL (line
AAʹ) of the first backfilled stope with B = 6m for: (a) Case 6a with 𝐿 = ∞ (2D), (b) Case 6b (3D) with L = 9m ... 243 Figure 7-15: Effect of stope width B on horizontal σhx and vertical σvz stresses along VCL (line
AAʹ) of the first backfilled stope with B = 6m for: (a) Case 7a with 𝐿 = ∞ (2D), (b) Case 7b (3D) with L = 9m ... 243
LIST OF SYMBOLS AND ABBREVIATIONS
AWR after front wall removal
B: stope width (m)
BWR before front wall removal
cʹ: backfill cohesion (kPa)
crm: cohesion of rock (kPa) Cu: coefficient of uniformity
D: distance between stopes (pillar width) (m)
D60,D30, D10: particle diameter at which 60%, 30% and 10% pass the mesh size (mm)
E: backfill modulus
Er: rock mass elastic modulus Erm: rock mass deformation modulus
e : void ratio
emax : void ratio of backfill in loosest state emin : void ratio of backfill in densest state
G: shear modulus
h: depth (m) in the backfill
H: stope height (m)
Id : density index
K: earth pressure coefficient for the backfill
Ka: active earth pressure coefficient Ko: earth pressure coefficient at rest
Kr: earth pressure coefficient in the rock mass k : hydraulic conductivity
L: stope length (m)
Ld: drift length (m)
n: porosity (%)
RMR : rock mass rating
s: deviatoric stress, radius of the Mohr-circle of stress (kPa).
t: mean stress, center of the Mohr-circle of stress (kPa)
UCS: uniaxial compressive strength (MPa)
z: stope depth (m)
α: sliding plane angle (°)
β: stope inclination (°)
γ: unit weight of backfill (kN/m3)
γr: unit weight of rock (kN/m3)
γsub: unit weight of submerged backfill (kN/m3)
h: horizontal displacement of rock walls (m)
δm: friction angle of fill/wall interface for wet backfill (°)
max: maximum total displacement of open face (m)
δsat: friction angle of fill/wall interface for saturated backfill (°) εh : horizontal strain of backfill
ν: backfill Poisson’s ratio
νr: rock mass Poisson’s ratio σ1: major principal stress (kPa) σ3: minor principal stress (kPa) σh: horizontal stress (kPa) σv: vertical stress (kPa) ψʹ : backfill dilatancy angle (°)
ϕʹ: internal friction angle of backfill (°)
ϕr: internal friction angle of rock (°) ϕrm: internal friction angle of rock mass (°)
Δδh: maximum difference between the horizontal displacements Δσh: maximum difference between the horizontal stresses Δσv: maximum difference between the vertical stresses
LIST OF APPENDICES
APPENDIX A- MODEL METHODOLOGY AND VALIDATION………..273 APPENDIX B- COMPLEMENTRAY RESULTS RELATED TO CHAPTER 3………..278 APPENDIX C- COMPLEMENTRAY RESULTS RELATED TO CHAPTER 4………..281 APPENDIX D- COMPLEMENTRAY RESULTS RELATED TO CHAPTER 5………..292 APPENDIX E- COMPLEMENTRAY RESULTS RELATED TO CHAPTER 6………...304 APPENDIX F- COMPLEMENTRAY RESULTS RELATED TO CHAPTER 7………...309 APPENDIX G- ROCK MASS AND BACKFILL PROPERTIES………..311
INTRODUCTION
Backfill can play an important role in underground mining operations by improving the wall stability around stopes and by reducing ore waste. The environmental and economic benefits of returning part of the tailings or waste rock underground are also part of the rationale behind backfilling (Hassani and Archibald, 1998).
A good understanding of the complex behavior of backfill and its interaction with the surrounding rock mass is a key step in assessing ground stability issues. Many researchers (e.g. Thomas, 1969; Ouellet et al. 1998b; Belem et al. 2000; Benzaazoua et al. 2004; Potvin et al. 2005; Helinski et al. 2007; Pirapakaran, 2008) carried out comprehensive studies to investigate the effect of various parameters on the mechanical behavior of backfills. There is generally a good agreement on how the binder content and curing time can influence the properties of the backfill materials. The majority of results show that the compressive strength and cohesion of the backfill increase as the curing time progresses and the binder proportion increases. Also, the compressive strength and elastic modulus of backfill tend to increase with the decreasing void ratio (same as other geotechnical materials).
These investigations also confirm that even the strongest backfills are soft (deformable) in comparison with the surrounding rock mass. This difference in stiffness and strength between these two materials generates a load transfer along the interfaces, which may create a significant arching effects in relatively narrow openings (e.g. Li et al. 2003). This phenomenon is well known in geotechnique (Handy and Spangler, 2007). Arching takes place in different types of materials such as soil, backfill and powder. It has also been analyzed for various situations such as the stress distribution around underground excavations (Terzaghi, 1943; Ladanyi and Hoyaux, 1969; Iglesia et al. 1999), earth pressure on retaining walls (Spangler and Handy, 1984; Take and Valsangkar, 2001), and underground conduits in ditches (Marston, 1930; McCarthy, 1988; Spangler, 1962). In mine stopes, the backfill is less rigid than the surrounding rocks, and tends to settle under its own weight after placement. Therefore, a portion of the overburden’s weight is transferred to the rigid abutments due to frictional interaction between the fill and the surrounding walls, following the movement of backfill materials between the unyielding walls. The shear resistance along the interfaces prevents this downward movement and thus, reduces the
stress magnitude imposed within this yielding material at depth. Therefore, the stresses on the surrounding rigid rock mass increase.
Two and three-dimensional analytical solutions, often based on the Marston (1930) approach proposed for backfilled trenches, have been developed for evaluating the stress distribution in vertical single (isolated) backfilled stopes (e.g. Aubertin et al. 2003; Li et al. 2005; Pirapakaran and Sivakugan 2007; Li and Aubertin, 2008) and in inclined backfilled openings (e.g. Winch, 1999; Caceres, 2005; Sing et al. 2011; Ting et al. 2011, 2014; Li et al. 2013). Some of these solutions have been further developed to take into account the effect of pore water pressures PWP (Li and Aubertin 2009b, 2009c; Fahey et al. 2009). Mitchell et al. (1982) have proposed a solution that is commonly used to estimate the required strength of cemented backfill placed in stopes with an open face. This solution was later modified by Zou and Nadarajah (2006), Dirige et al. (2009), and Li and Aubertin (2012, 2014) to consider additional factors.
Physical-experimental models and in-situ measurements have been carried out to investigate the behavior of an isolated backfilled stope. Physical models tested by Mitchel et al. (1982) also showed the influence of arching on stress state within the stope with exposed faces. The measurements carried out by Take and Valsangkar (2001) and Pirapakaran (2008) have shown that the stress transfer in narrow backfilled openings and the effect of different parameters. Knutsson (1981) and Belem et al. (2004) reported in-situ measurements in stopes and on barricades. Thompson et al. (2011, 2012) also carried out in-situ measurements in stopes and on barricades. Furthermore, they investigated the effect of binder content, filling rate, geochemistry of ore body and pore water pressure on the stress state within these stopes.
Numerical modeling is another commonly used approach to analyze the behavior of backfilled stopes and barricades. Many different software codes, such as FLAC and FLAC3D, PHASES2, PLAXIS and SIGMA/W, have been used to evaluate the stress state of the stopes and verify the results of analytical solutions in these structures. For instance, Li et al. (2003, 2005, 2007), Li and Aubertin (2009a, 2009b, 2009c, 2009d, 2009e, 2009f), and Pirapakaran (2008) have carried out a series of numerical simulations using FLAC to assess the stresses distribution in single stopes. The influence of different parameters was investigated, including backfill properties, stope geometry and pore water pressure. They often obtained a good agreement between the numerical and analytical solutions for the stress state in isolated backfilled stopes.
Other numerical analyses have been conducted by Helinski et al. (2007, 2010, 2011), Pirapakaran and Sivakugan (2007), Fahey et al. (2009), and El Mkadmi et al. (2011, 2014) to evaluate the influence of backfill properties, fill-wall interface characteristics, filling rate and pore water pressure. Numerical simulations have also been performed to assess the required strength of cemented paste backfill with an exposed face (Dirige et al. 2009; Karima et al. 2013; Emad and Mitri, 2013, Emad et al. 2014; Li and Aubertin, 2014).
In practice, underground mines generally include several stopes to recover the ore. To date however, little work has been done on the response of multiple stopes excavated in sequence. The influence of creating and filling neighboring stopes on the backfill response has not yet investigated. This is nonetheless an important issue, as the stress state in and around multiple openings may vary with the excavations geometry, position and creation sequence, as will be shown in this thesis.
The main purpose of this thesis is to develop a modeling approach, which would help mining operations predict the stresses, displacements and strain due to the creation of a second opening near an existing backfilled stope. The secondary motivation for this thesis is to investigate the influence of fill properties, stope geometry and rock mass parameters on the stress distribution, displacements and strains within the first backfilled stope when the rock mass behaves as elastic or elasto-plastic materials. Mining engineers can then use these results for selecting the size and location of the two adjacent stopes and to determine if the required backfill properties, considering also the rock mass characteristics. In addition, this approach gives a better evaluation of the minimum required strength of exposed cemented backfill, as a function of stope geometry and excavation sequence.
For this purpose, a comprehensive numerical study was conducted using more than 300 simulations. The backfill was incorporated into the FLAC model components. The first stope was excavated in one step (layer) and filled with four layers (steps). Then, the second stope was excavated in four steps (layers) from bottom to top and filled with four layers (steps). This project also involved numerical simulations under 2D (plane strain) and 3D conditions. The stress distribution within the first and second backfilled stopes was studied and compared with that of a single stope. The rock walls displacements and backfill strain in the first backfilled stope were also obtained. The simulation results specifically show how the excavation and backfilling of the
second stope affects the response of the first backfilled opening. The results are presented in terms of stresses, displacements and strains. The results illustrate how key parameters influence both the stress magnitude and distribution pattern, which can become much more complex in the case of two neighboring stopes. The influence of stope geometry and backfill strength parameters on the behavior and stability of exposed cemented backfill was also simulated. In all these cases, the numerical results were also compared with existing analytical solutions.
This thesis is structured as follows: Chapter 1 reviews the literature related to mine backfilling. Chapter 2 presents the research objectives, hypothesis and the methodology. Chapter 3 and 4 present the main results obtained using numerical simulations conducted with FLAC to determine the stress distribution and wall displacements in adjacent backfilled stopes when the simulating rock mass is elastic; these chapters also address the influence of different parameters on the stresses and displacements, including backfill and rock mass properties and stope geometry. Chapter 5 presents the simulation results for two adjacent backfilled stopes in an elasto-plastic rock mass; the influence of different parameters is also evaluated. Chapter 6 provides the results in terms of the stress state and displacements of the backfill in the primary stope (using FLAC3D) when the secondary stope is mined out. Chapters 3 to 6 are presented in the form of manuscripts that have been submitted to peer-reviewed journals. Chapters 3 to 6 are the accepted or submitted papers; because of this paper format, there will be overlaps and repetitions between the chapters. Chapter 7 also addresses the effect of the third dimension on the stress distribution of two adjacent backfilled stopes using FLAC3D, considering different backfill properties and stope geometry. Stresses are generally shown in kPa, while displacements and strains are shown in cm and %, respectively. The interpretation of the results shown in these chapters are context dependent and, in some cases, may involve engineering judgment from the author. When describing and comparing the results, differences are generally considered “significant” only when they could influence the engineering decision making process. Chapter 8 discusses these findings. The last Chapter includes a conclusion and recommendations for future work.
CHAPTER 1
LITERATURE REVIEW
Mining is a major industry in Canada. Many mines are based on underground operations, which are using mining methods that can be divided into three categories: naturally supported, supported and caving (unsupported) methods (Hartman et al. 1992; Brady and Brown, 1993). Mine backfill provides global support for rock walls and surrounding ground, often using waste rock or tailings (with or without cement).
Even the strongest backfill is soft in comparison with the adjacent rock mass (e.g. Appendix G for typical properties). When the backfill is placed in the stope, the difference between the mechanical properties of these two materials induces stress redistribution in the backfill and adjacent rock. The backfill deformation under its own weight produces a load transfer along the interfaces with the rock, due to the movement of the backfill material along unyielding walls. The shear resistance along the interfaces partly prevents this movement and reduces the stress magnitude within the yielding materials at depth; this phenomenon is known as an arching effect. Accurate evaluation of the stress distribution in rock mass and backfill materials is an essential issue for the design of backfilled stopes and barricades (e.g. Hassani and Archibald 1998; Aubertin et al. 2003; Pirapakaran, 2008).
This chapter presents a summary of some mining methods, backfill properties, as well as a review of arching effects within mining openings (using analytical solutions and numerical models), and a few results from in-situ measurements.
1.1 Mining Methods
Depending on the ore location, mining methods can be divided into two major types: surface mining and underground mining.
Surface Mining
This method is used when the ore deposits are located close to the surface. There are several surface mining methods such as strip mining, open pit mining, placer mining, hydraulic mining and dredging. Among them, open pit and strip mining are most often used (Hartman et al. 1992; Darling, 2011). Open pit mining involves digging a large hole in the ground using four basic operations including drilling, blasting, loading and hauling. Strip mining is used when a
seam of ore is located very close to the surface and covered by thin layers of soil or rock overburden (e.g.Pirapakaran, 2008).
Underground Mining
Underground mining methods are used to extract the minerals from the earth at depth and to reduce the amount of waste materials. It requires equipments and people to work underground. Providing a safe working place is one of the most important issues in underground mining. According to Brady and Brown (1993), underground mining methods can be divided into three major categories: self-supported, supported and caving (unsupported). This classification is based on the type of ground support. In caving methods, the ground is allowed to collapse under its own weight, sometimes up to the ground surface. Room and pillar mining, shrinkage stoping, sublevel stoping, and VCR (vertical crater retreat) are examples of self-supported mining methods, whereas (artificially) supported mining methods usually mean cut-and-fill mining methods. Stope backfilling is the most common methods to provide global ground support in underground mines. This method involves filling the underground stopes and support the excavated spaces using the supporting properties of backfill materials. As the backfill is usually relatively weak, it is often strengthen by adding a binder such as Portland cement. Typical properties of backfills are given in Appendix G.
1.2 Backfill classification
Backfill is often made of waste materials released from ore extraction and processing operation. There are different types of backfill such as hydraulic fill, paste fill and rock fill (Hassani and Archibald, 1998). Some of the major factors influencing the selection of backfill type are the physical and the mechanical properties of the ore and rock mass, fill strength requirements and mining methods. Mine backfills can be cemented or un-cemented.
Hydraulic fill (or slurry fill) includes mill tailings, sand or waste rock materials, water. It can also be made with or without binder. The pulp density of hydraulic fill is between 65-75% by weight. This type of fill must be transported in pipelines at higher velocities than the critical settling velocity to prevent deposition of solids. The hydraulic conductivity of slurry fills varies between 10-5 to 10-6 m/s (Grice, 2001). According to Potvin et al. (2005), the maximum amount