9756
Method development of extraction and identification
of Nitidine, (Benzophenanthridine alkaloid) from the
barks of Fagara chalybea.
Madani MARIKO1,2*, Blaise DACKOUO1, Hamadoun Aba TOURE1, Yérim Mbagnick DIOP2
1Laboratory of Analytical Chemistry, Faculty of Pharmacy, University of technical Sciences and Technology, B.P.
1805, Bamako, Mali
2Laboratory of Analytical Chemistry and Bromatology, University Cheikh Anta DIOP, B.P. 5005, Dakar, Senegal
*Corresponding author email: [email protected] (00223 76 11 05 38)
Other authors:1[email protected] (00223 76 20 55 07); 1[email protected] (00223 65 69 85 87)
Original submitted in on 6th May 2016. Published online at www.m.elewa.org on 30th June 2016
http://dx.doi.org/10.4314/jab.v102i1.10
ABSTRACT
Objective: Fagara chalybea is an important medicinal plant belonging to the family Rutaceae. The plant is well known for its anti-malarial, anti-microbial and anti-cancerous activity, which has been attributed to the presence of benzophenanthridine alkaloid nitidine in the plants. The present work aims to develop a method of Nitidine extraction and Identification from the bark of Fagara chalybea Engl.
Methodology and results: A simple, rapid and sensitive HPLC method has been developed for the qualitative determination of nitidine in the dried bark of Fagara chalybea after extraction. The calculated yield is 2.28%. The retention time of nitidine in the methanol was 27.639 min, and then this time was 27.393 nm in dichloromethane. The limit of detection and limit of quantization were found to be 2.18 and 7.29 µg/mL respectively, the correlation coefficient was 0.998.
Conclusion and application of results: The application of this method to the analyses of nitidine after extraction proved that the method is sensitive enough to detect low levels of analyses. To value traditional medicine, this method can be used as a tool for quality control of botanicals herbal formulations.
Key words: Nitidine, HPLC, Fagara chalybea, Malaria. INTRODUCTION
Malaria is still a major threat to human life and health, especially in sub-Saharan Africa. It is a disease that mainly affects immunologically naive individuals, especially children under 5 years old, and women who are in their first or second pregnancy (Zhang et al., 2014). Although recent estimates suggest that malaria mortality rates decreased by an impressive 47% between 2000 and 2013 globally, and by 54% in the World Health Organization’s (WHO) African Region, malaria
remains a major public health problem in many countries (Djimde et al.,2016).The chemotherapeutic arsenal for malaria treatments is limited to three main families of compounds: the quinolines (quinine, chloroquine, mefloquine), the antifolates (sulfadoxine, pyrimethamine) and the artemisinin derivatives. Widespread drug resistance resulted in the ineffectiveness of many anti-malarials and chemotherapy now requires drug combinations (Grellier et al., 2008). Malaria vaccine development
Journal of Applied Biosciences 102:9756 – 9762
9757 has been hampered by the frequent antigenic variation of the P. falciparum parasites (Zhang et al., 2014; Bouyou-Akotet et al., 2015). Resistance of this parasite to virtually all of the currently available anti-malarial drugs is of great concern; consequently, new inexpensive drugs are urgently needed to address the global burden of malaria (Bouquet et al., 2012). Several natural or synthetic repellents are used against biting insects pests (Curtis et al., 1989). Synthetic products are generally sold in order to protect against mosquito bites. Nevertheless, they are prohibitively expensive for the communities concerned (Hougard et al., 1998) and have to be used carefully (Molmoori et al., 2010, Konan et al., 2003). Natural substances have provided the best malarials that are currently available. These anti-malarials, including artemisinin and quinine, as well as numerous molecules derived from plants, are promising lead compounds that combat malaria
infection (Lu et al., 2012; Lin et al., 2014). Nitidine is a benzophenanthridine alkaloid (Figure 1) found in specie of Zanthoxylum nitidium (knob wood). It was first isolated in 1959 from Zanthoxylum nitidium (Lu et al., 2012; Li et al., 2014). Nitidine was found again approximately 40 years later in a traditional Kenyan anti-malarial remedy and was more recently discovered in Zanthoxylum rhoifolium, a traditional remedy from South America. The widespread use of nitidine stresses the importance of this molecule in the field of malaria control (Bouquet et al., 2012; Lin et al., 2014; Lu et al. 2012). Many biological properties have been ascribed to Nitidine, including its use as microbial, cancerous and anti-malarial properties were also reported (Bouquet et al., 2012; Lin et al., 2014; Lu et al., 2012; Li et al., 2014). The present work aims to develop a method of Nitidine extraction and Identification from the bark of Fagara chalybea Engl. (Knob wood).
MATERIALS AND METHODS
Chemicals reagents: All solvents used for chromatographic analyses were HPLC grade reagent, Methanol (CHROMASOL, for HPLC, ≥99,9%), Dichloromethane (puriss, p.a , ACS reagent, ISO, ≥99.9%), Acetic acid (puriss, 99-100%), standard Nitidine and Amberlite IRA420®, were from Sigma Chemical Co (St. Louis, MO, U.S.A.).
Plant material and extraction procedures: The Barks of plant species (Fagara chalybea) collected from a National Park of Akagera in the East of Rwanda on October 2010, was identified by a resident botanist, University of Liege in botanical department. Powder of the bark (500g) was extracted for 3 days with 6 litre of methanol acidified by acetic acid (1%) at room temperature, followed by rapid paper filtration through Whatman paper. The resulting solutions were evaporated under vacuum at 70 °C by rotavapor to dryness. Twenty (20) g of dry methanolic residues were taken then dissolved in 100 mL of water and added 100 mL of dichloromethane for liquid-liquid extraction. After shake and decantation, the extract solution was concentrated to dryness in a rotary evaporator. The crude extract was conserved at 4°C until use. The required concentrations
(4g) were taken again with each reagent methanol and dichloromethane for HPLC essay. (Li et al., 2014 ; Lu et al., 2012; Nono et al., 2014).
Chromatographic conditions: All analysis was done at ambient temperature (24 °C) under isocratic conditions. The stationary phase consisted of column: diphenyl (SS 250 x 4.6 mm), the mobile phase consisted of a mixture of acetonitrile/trifluoroacétic acid (80:20, v/v) and pH adjusted to 2.21. The flow rate was 1.0 mL/min and volume of injection was 10µL. All solutions, including mobile phase, were sonicated during 20 min before use. The DAD detection was used (Baerheim-Svendsen & Verpoorte1984; Makoto, 2007; Praveena et al., 2014). Standard solutions preparation for calibration curves: Accurately weighed amounts of standards of nitidine equivalent to 5mg were transferred to 5mL volumetric flask. The volumes were completed with methanol. The resulting solutions were sonicated during 20 min and filtered through membrane filter. Final concentrations were 1 mg/mL. Aliquots of solution was accordingly diluted with methanol in order to obtain solutions with final concentration of 50 µg/mL, 100 µg/mL, 150 µg/mL, 200 µg/mL et 250 µg/mL.
RESULTS
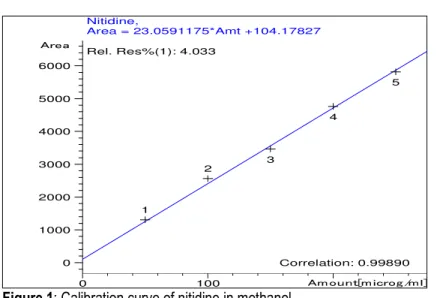
Calibration curves: Five different concentration levels (50, 100, 150, 200 and 250 µg/mL) were obtained of standard solution, conveniently diluted with methanol.
Each solution was injected in the chromatographic system (n=5) and mean values of peak areas were plotted against concentrations. The curve was adjusted
9758 by linear regression with least mean squares method (Santoro et al., 2006). The correlation coefficient is 0.998
(Figure 1 and Table 1).
Amount[microg /ml] 0 100 Area 0 1000 2000 3000 4000 5000 6000 1 2 3 4 5 Nitidine, Correlation: 0.99890 Rel. Res%(1): 4.033 Area = 23.0591175*Amt +104.17827
Figure 1: Calibration curve of nitidine in methanol. Detection limit (DL) and quantification limit (QL): The DL and QL were calculated using Eqs. (1) and (2), respectively. The theoretically determined values of
detection and quantitation limits were crossed checked by actual analysis of these concentrations using proposed methods (Santoro et al., 2006):
(1) (2)
Where S.D is the standard deviation of curve and α is the slope of curve (Table 1).
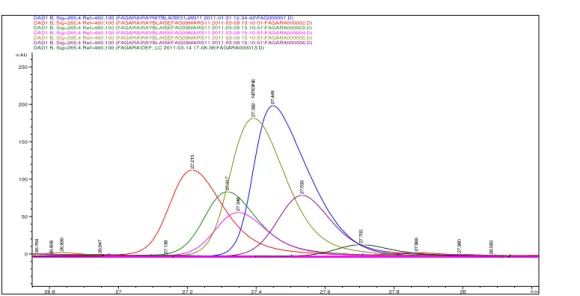
Chromatogram of sample standard of nitidine: Injected at different concentrations, nitidine retention time
was about 27 minutes in methanol and dichloromethane (Figure 2 and 3). min 10 20 30 40 50 mAU 0 50 100 150 200 250 300 350
DAD1 B, Sig=265,4 Ref=460,100 (FAGARA\RAYFAGARA03MARS11 2011-03-03 18-26-16\FAG030311000001.D)
3 .5 8 4 3 .6 7 7 3 .8 8 9 4 .0 4 4 2 5 .5 2 4 2 7 .0 3 5 2 7 .4 0 8 N IT ID IN E 3 6 .8 1 6 4 1 .1 4 9
9759 min 26.8 27 27.2 27.4 27.6 27.8 28 mAU 0 50 100 150 200 250
DAD1 B, Sig=265,4 Ref=460,100 (FAGARA\RAYNITBLAISE31JAN11 2011-01-31 12-34-42\FAG000001.D)
2 6 .9 4 7 2 7 .4 4 9
DAD1 B, Sig=265,4 Ref=460,100 (FAGARA\RAYBLAISEFAG09MARS11 2011-03-09 15-10-51\FAGARA000002.D)
2 7 .2 1 5 2 7 .8 6 6
DAD1 B, Sig=265,4 Ref=460,100 (FAGARA\RAYBLAISEFAG09MARS11 2011-03-09 15-10-51\FAGARA000003.D)
2
7
.3
1
7
DAD1 B, Sig=265,4 Ref=460,100 (FAGARA\RAYBLAISEFAG09MARS11 2011-03-09 15-10-51\FAGARA000004.D)
2 6 .7 6 4 2 7 .3 4 8 2 7 .9 9 0
DAD1 B, Sig=265,4 Ref=460,100 (FAGARA\RAYBLAISEFAG09MARS11 2011-03-09 15-10-51\FAGARA000005.D)
2 6 .8 3 6 2 7 .3 9 2 N IT ID IN E 2 8 .0 8 3
DAD1 B, Sig=265,4 Ref=460,100 (FAGARA\RAYBLAISEFAG09MARS11 2011-03-09 15-10-51\FAGARA000006.D)
2 6 .8 0 6 2 7 .5 3 3
DAD1 B, Sig=265,4 Ref=460,100 (FAGARA\DEF_LC 2011-03-14 17-08-36\FAGARA000013.D)
2 7 .1 3 8 27 .7 0 5
Figure 3: Superimposed spectra of nitidine standard in methanol at different concentrations. Chromatogram of sample crude of the bark of Fagara
chalybeae powder: After injection of crude extract in methanol and dichloromethane, the peaks of nitidine are
distinct with retention time of about 27 min (Figure 4 and 5).
9760
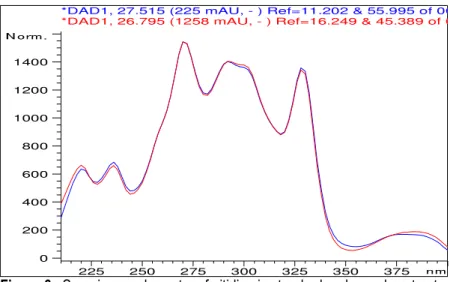
Figure 5: Chromatogram of sample crude (dichloromethane extract) of the root bark of Fagara chalybeae powder. Spectres of nitidine: Spectres (UV-vis) of standard nitidine and extract nitidine are similar (Figure 6).
nm 225 250 275 300 325 350 375 N orm . 0 200 400 600 800 1000 1200 1400
*DAD1, 27.515 (225 mAU, - ) Ref=11.202 & 55.995 of 002-0201.D *DAD1, 26.795 (1258 mAU, - ) Ref=16.249 & 45.389 of 003-0301.D
Figure 6 : Superimposed spectra of nitidine in standard and sample extract. Table 1: Data for HPLC quantification and extraction of nitidine.
Parameter Value
Linearity range (ng/spot) 50 - 250
Correlation coefficient (r) 0.9989 Slope 23.05 Intercept 104.17 LOD [µg/mL] 2.18 LOQ [µg/mL] 7.29 Nitidine yield (500 g) 1.8 ‰ Nitidine yield (0.39342 g) 2.28% DISCUSSION
For preparative HPLC, 393.42mg of dichlorometanolique fraction were deposited on silica gel. This has afforded 9mg nitidine a yield of 2.28% by referring to the deposit.
With 500g powder of the plant, the calculated yield is 1.8 ‰. The retention time of nitidine in the methanol was 27.639 min, and then this time was 27.393 nm in
9761 dichloromethane. The mobile phase acetonitrile/ trifluoroacetic acid (80:20, v/v) gave good resolution for nitidine with a sharp and well defined peak. The bands in sample chromatograms was confirmed by the comparison of chromatogram and UV spectra obtained from the sample with that obtained from the standard solution. The peak corresponding to nitidine from the sample solutions had the same retention factor as that of standard nitidine. Specificity of the method was ascertained by comparing retention time values of samples with that of standard nitidine. No interference with peak of nitidine from other constituents of extracts was also observed indicating the specificity of the method. These results are similar to that obtained in a study on the quantitative determination of nitidine from roots and plant tissue of Toddalia asiatica (Linn.) the specificity of the method was ascertained by comparing Rf values and the UV-Visible spectra of
samples with that of standard nitidine. No interference with peak of nitidine from other constituents of extracts was also observed (Praveena et al., 2014). Linearity data show concentration interval of studied nitidine in which the intensity of the detector response is proportional to
the concentration of the analyzed substance. The correlation coefficient obtained was 0.998. The calibration equation shows an excellent linearity with slop 23.05 and intercepts 104.17. In the study conducted by the team of Praveena in 2014 the author found a correlation coefficient equal to 0.9949. Their results can be superimposed on those obtained in this study (Praveena et al., 2014). Signal to noise ratios 3 and 10 were considered for DL and QL respectively and calculated from the slop of the calibration plot and the standard deviation of the response. DL and QL were found to be 2.18 and 7.29 µg/mL respectively for nitidine, which ascertain the adequate sensitivity of the method. Santoro and collaborator in 2005 had obtained the DL and QL of samples of gatifloxacin; levofloxacin; lomefloxacin and pefloxacin (antibiotics in pharmaceutical preparations by high-performance liquid chromatography) were 0.13, 0.39; 0.15, 0.46; 0.17, 0.52 and 0.08, 0.25µg/mL, respectively (Santoro et al., 2005). Their results are significantly lower than those obtained in the present study. This difference can be explained by the purity of the substance they used and chromatographic conditions. CONCLUSION
This paper reported the development of a rapid, simple and specific analytical HPLC method for the qualitative estimation of nitidine. The application of this method to the analysis of nitidine after extraction in the barks of Fagara chalybea samples proved that the method is
sensitive enough to detect low levels of analyses in complex matrices. To value traditional medicine, this method can be used as a tool for quality control of botanicals herbal formulations.
REFERENCES
Baerheim-Svendsen A. and Verpoorte R, 1984. Chromatography of Alkaloids. Amsterdam: New York, Journal of chromatography library, 23A, p457.
Bouquet J, Rivaud M, Chevalley S, Deharo E, Jullian V, Valentin A. 2012. Biological activities of nitidine, a potential antimalarial lead compound. Malaria Journal, 11:67.
Bouyou-Akotet M, K, M’Bondoukwé N, P, Mawili-Mboumba D, P, 2015. Genetic polymorphism of merozoite surface protein-1 in Plasmodium falciparum isolates from patients with mild to severe malaria in Libreville, Gabon. Parasite, 22: 12.
Djimde A, A., Maiga A, W, Ouologuem D, Fofana B, Sagara I, Dembele D, Toure S, Sanogo K, Dama S, Sidibe B, Doumbo O, K, 2016. Gametocyte clearance dynamics following oral artesunate treatment of uncomplicated
falciparum malaria in Malian children. Parasite, 23: 3.
Gakunju D, M, N, Mberu K, Dossaji S, F, Gray A, I, Waigh R, D, Waterman P, G, Watkins W, M, 1995. Potent Antimalarial Activity of the Alkaloid Nitidine, Isolated from a Kenyan Herbal Remedy. American Society for Microbiology, 39(12): 2606-2609.
Grellier P, Depoix, Schrével J, Florent I. 200.: Discovery of new targets for antimalarial chemotherapy. Parasite,15: 219-225.
Konan Y, L, Sylla M, S, Doannio J, M, Traoré S, 2003. Comparison of the effect of two excipients (karite nut butter and Vaseline) on the efficacy of Cocos nucifera, Elaeis guineensis and Carapa procera oil-based repellents formulations against mosquitoes biting in Ivory Coast. Parasite, 10: 181-184.
Li L, Tu M, Yang X, Sun S, Wu X, Zhou H, Zeng S, Jiang H, 2014. The Contribution of Human OCT1,
9762 OCT3 and CYP3A4 to Nitidine Chloride–Induced Hepatocellular Toxicity. American Society for Pharmacology and Experimental Therapeutics, 42:1227-1234.
Lin J, Shen Aling, Chen H, Liao J, Xu T, Liu L, Peng J, 2014: Nitidine chloride inhibits hepatic cancer growth via modulation of multiple signaling pathways. B.M.C. Cancer, 14:729.
Lu J, J, Bao J, L, Chen X, P, Huang M, Wang Y, T, 2012. Alkaloids Isolated from Natural Herbs as the Anticancer Agents. Evidence-Based Complementary and Alternative Medicine, 12p. Makoto O, 2007. Bioactive Natural Products Detection,
Isolation and Structural Determination, Second Edition Edited by Russell J. C.R.C. Press, 391-405.
Molmoori R, K, Rodda H, C, Veeresham C, 2010. “Production of Nitidine from Callus Cultures of Toddalia asiatica, International Journal of Pharmaceutical Sciences and Nanotechnology, 3(2): 1028-1033.
Nono N, R, Nzowa K, L, Barboni L, Tapondjou A, L, 2014. Drymaria cordata (Linn.) Willd
(Caryophyllaceae): Ethnobotany, Pharmacology and Phytochemistry. Advances in Biological Chemistry, 4: 160-167.
Praveena C. and Veeresham C, 2014. Quantitative Determination of Nitidine from Roots and Plant Tissue Culture Extracts of Toddalia asiatica (Linn.) Using HPTLC. American Journal of Analytical Chemistry, 5(2): 65-69.
Santoro M, I, R, M, Kassab N, M, Singh A, K, Kedor-Hackmam E, R, M, 2006. Quantitative determination of gatifloxacin, levofloxacin, lomefloxacin and pefloxacin fluoroquinolonic antibiotics in pharmaceutical preparations by high-performance liquid chromatography. Journal of Pharmaceutical and Biomedical Analysis, 40: 179-184.
Zhang Y, Jiang N, Chang Z, Wang H, Lu H, Wahlgren M, Chen Q, 2014. The var3 genes of Plasmodium falciparum 3D7 strain are differentially expressed in infected erythrocytes. Parasite, 21: 19.