Any correspondence concerning this service should be sent
to the repository administrator:
[email protected]
This is an author’s version published in:
http://oatao.univ-toulouse.fr/27245
To cite this version: Vernier, Suzanne and Pugliara, Alessandro
and Viguier, Bernard and Andrieu, Eric and Laffont, Lydia Solid-State
Phase Transformations Involving (Nb,Mo)2CrB2 Borides and
(Nb,Ti)2CS Carbosulfides at the Grain Boundaries of Superalloy
Inconel 718. (2020) Metallurgical and Materials Transactions A, 51
(12). 6607-6629. ISSN 1073-5623
Official URL
DOI :
https://doi.org/10.1007/s11661-020-06045-z
Open Archive Toulouse Archive Ouverte
OATAO is an open access repository that collects the work of Toulouse
researchers and makes it freely available over the web where possible
Solid-State Phase Transformations Involving
(Nb,Mo)
2
CrB
2
Borides and (Nb,Ti)
2
CS Carbosulfides
at the Grain Boundaries of Superalloy Inconel 718
S. VERNIER, A. PUGLIARA, B. VIGUIER, E. ANDRIEU, and L. LAFFONTThe present paper studied the solid-state phase transformations occurring at the grain boundaries of a conventional cast-and-wrought alloy within the chemical specifications of superalloy Inconel 718. These phase transformations involved the precipitation of (Nb,Mo)2CrB2 borides and (Nb,Ti)2CS carbosulfides, which are usually phases rather
associated to solidification phenomena than to solid-state phase precipitation in superalloy Inconel 718. The study started from a material solution-treated above the d solvus. When this material was heated subsolvus d from room temperature, (Nb,Mo)2CrB2borides was found to
precipitate at the grain boundaries, in addition to the d phase. Then, when the material was reheated supersolvus d after the subsolvus treatment, the complete dissolution of the d phase and the partial dissolution of the (Nb,Mo)2CrB2phase released niobium and titanium atoms in
the grain boundaries. Both elements have a strong affinity with carbon and sulfur, and this favored the precipitation of secondary (Nb,Ti)C carbides and (Nb,Ti)2CS carbosulfides at grain
boundaries. An analysis of the interactions between the segregating species C, B and S evidenced that the precipitation of (Nb,Mo)2CrB2 borides at grain boundaries was very likely made
possible by a decreased carbon activity during the subsolvus d treatment. https://doi.org/10.1007/s11661-020-06045-z
mainly form at grain boundaries either by a cellular reaction involving c¢¢ precipitates[7,8]or, at temperatures higher than the c¢¢ solvus, directly from the supersatu-ration of the c matrix.[9] Because chromium is barely soluble in the d phase,[3] d precipitation leads to the rejection of chromium in the matrix and so to local chromium enrichments. These local chromium enrich-ments enable the chromium-rich phases a-Cr and r to form: the a-Cr and r phases precipitate in the presence of d phase, and the a-Cr and r precipitates nearly always nucleate on d plates.[4] The C14 Laves phase can precipitate both below and above the d solvus.[3,4] Finally, while the primary MC carbides and primary M(C,N) carbonitrides form during the alloy solidifica-tion,[10,11] the secondary MC carbides nucleate in a solid-state alloy and mainly at grain boundaries.[5,6]In superalloy Inconel 718, the metallic atoms M of the MC carbides and M(C,N) carbonitrides are titanium and niobium atoms, although there is always a predominant metallic element: either niobium[5] or titanium.[3]. The precipitation peak of the secondary MC carbide is in the 700 °C to 800 °C range,[5,6] so that at 800 °C the co-precipitation of MC carbides and d phase was reported at grain boundaries.[5]
The c¢¢, c¢, d, C14 Laves, r, and a-Cr phases are all based on the main alloying elements of superalloy Inconel 718, which are iron, chromium, niobium, molybdenum and aluminum. On the other hand, I. INTRODUCTION
B
ECAUSE of its high strength at temperatures up to 650 °C, superalloy Inconel 718 is widely used in the aerospace[1] and power generation industries. The mechanical strength of superalloy Inconel 718 is mainly provided by intragranular precipitates which are coher-ent with the Face Centered Cubic matrix c.[2] These intragranular and coherent precipitates are either c¢¢ phase (Ni3Nb—D022 structure) or c¢ phase(Ni3(Al,Ti,Nb)—L12 structure). Nevertheless, in
super-alloy Inconel 718 numerous other phases can precipi-tate. In addition to the c¢¢ and c¢ phases, the d phase (Ni3Nb—D0a structure), the C14 Laves phase ((Ni,Fe,
Cr)2(Nb,Mo,Ti)—hexagonal close-packed structure),
the r phase ((Cr-Fe-Mo)—tetragonal structure), the a-Cr phase ((Cr-Mo)—A2 bcc structure) and the MC carbides (FCC structure) are the most common phases reported for alloy Inconel 718.[3–6] The d precipitates
S. VERNIER, A. PUGLIARA, B. VIGUIER, E. ANDRIEU, and L. LAFFONT are with the CIRIMAT, Universite´ de Toulouse, CNRS, INP-ENSIACET, 4 alle´ e Emile Monso, BP 44362, 31030 Toulouse
(Nb,Mo)2CrB2 borides partially dissolved and grain
boundary solid-state phase transformations involving d, (Nb,Mo)2CrB2, (Nb,Ti)C and (Nb,Ti)2CS phases were
evidenced. The last part of the paper discusses about the interactions between the segregating species C, B and S which are the basic components of the secondary (Nb,Ti)C carbides, (Nb,Mo)2CrB2 borides and
(Nb,Ti)2CS carbosulfides evidenced here.
II. MATERIALS AND METHODS
A. Material Composition
The material of the present study is a conventional cast-and-wrought superalloy Inconel 718. TableI pre-sents the chemical composition given in the alloy certificate. The chemical composition of the studied alloy falls within the AMS specifications regarding the chemical composition of alloy Inconel 718.[13,23] In particular, the B, C, P, S and Si contents are well below the maximum tolerances which are 0.006, 0.08, 0.015, 0.015 and 0.35 wt pct respectively. For such a chemical composition, ThermoCalc calculations (TCNI7 data-base) estimated the d solvus to be about 1044 °C.
B. Experimental Procedure
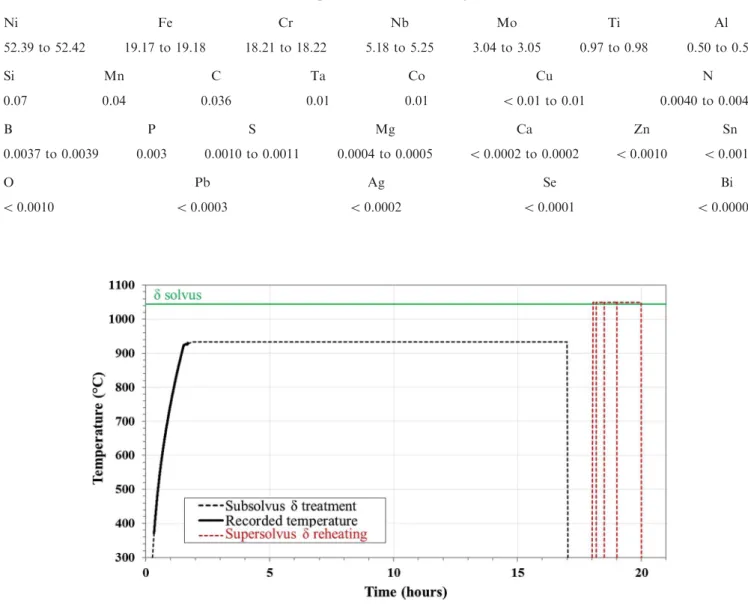
The as-received material had been previously solu-tion-treated at 1065 °C for 1 minute by the alloy supplier. First, the intergranular precipitates of the as-received material were analyzed. Second, some of the as-received material underwent a supersolvus d thermal treatment and some of the as-received material under-went a subsolvus d thermal treatment (Figure1). For the supersolvus d treatment, the as-received material was exposed to 1050 °C for 120 minutes and then air-quenched. For the subsolvus d treatment (black line in Figure1), the as-received material was heated from 25 °C to 933 °C, held 15 hours at 933 °C, and then air-quenched. During the heating-stage, the temperature evolution (thick black line in Figure1) was recorded, and 933 °C was the effective temperature measured in the furnace at the end of the heating stage. The intergranular precipitates obtained after both thermal treatments (subsolvus and supersolvus) were analyzed. Finally, samples of the material treated subsolvus d were reheated above the d solvus (1050 °C) for 10, 30, 60 or 120 minutes and then air-quenched (red dotted lines in Figure1). The evolutions above the d solvus of the intergranular precipitates formed below the d solvus were observed. Furthermore, the comparison of the subsolvus material reheated at 1050 °C with the as-re-ceived material directly heated at 1050 °C highlighted the influence a previous subsolvus treatment on the supersolvus intergranular precipitation.
A classical muffle furnace under ambient air was used for all the thermal treatments. To analyze the different microstructures, the samples were mounted in resin, grinded with silica papers (P600, P1200) and polished with diamond suspensions containing particles down to 1 micron large. Then, in order to perform SEM imaging (Nb,Ti)C carbides and (Nb,Ti)(C,N) carbonitrides are
common phases based on two minor alloying elements: carbon and nitrogen. In addition to carbon and nitro-gen, other minor alloying elements are commonly involved in the chemical composition of alloy Inconel 718.[12,13]All these minor elements must be kept below a maximum tolerance (still under 0.5 wt pct according to the alloy Inconel 718 specifications), either because they are detrimental for the alloy properties or because they are beneficial/neutral for the alloy properties but in very small amounts.[12] For instance, sulfur is a residual impurity commonly found in alloy Inconel 718. This impurity is detrimental for both the mechanical prop-erties and the oxidation resistance of the alloy.[14] Although boron and phosphorus have negative effects on welding,[15] small amounts of boron and phosphorus are known to improve the creep properties.[16] On the contrary, silicon is known to degrade the hot workabil-ity[12] and the mechanical properties of the polycrys-talline nickel-based superalloys by promoting the formation of Laves precipitates at grain boundaries,[17] but small amounts of silicon can improve the oxidation resistance[18] and the welding properties of the alloy.[12]
In alloy Inconel 718, phases containing minor alloying elements such as P, B and S were sometimes reported. These phases usually resulted from solidification phe-nomena,[12,19,20] although some examples were found to arise from solid-state phase precipitation.[13,15,21] For instance, after welding, Vincent[20] evidenced (Nb,Mo,Cr)3B2 borides, Nb(Ni,Fe,Cr)P phosphides
and (Nb,Ti)2CS carbosulfides along liquated grain
boundaries. Similarly, Sun et al.[19] reported needle-like (Nb,Ti)2CS carbosulfides and (Nb,Ni,Ti)-rich globular
sulfides in cast ingots. On the other hand, Chen et al.[21] and Benhadad et al.[15] both evidenced (Nb,Mo,Cr)3B2
borides, similar to those observed by Vincent,[20] but after solution treatments at 1050 °C. Furthermore, after ageing treatments at 704 °C, Miller et al.[13]pointed out M3P phosphides at grain boundaries. Among the studies
just mentioned here, only the alloys of Benhadad et al.[15] and Miller et al.[13] were out of the alloy Inconel 718 chemical specifications. Indeed, the phos-phorus and/or the boron content were increased for the purpose of their studies. Finally, to the best of the authors’ knowledge, no silicide has been yet reported in alloy Inconel 718. However, it is well known that silicon greatly segregates in the Laves precipitates.[3,20,22]
The present paper analyses some phase transforma-tions which have been observed at the grain boundaries of a cast-and-wrought alloy whose chemical composi-tion falls within the specifications of superalloy Inconel 718. The initial microstructure only showed very small secondary (Nb,Ti)C carbides as intergranular precipi-tates because the material had been previously solu-tion-treated at high temperature. Then, if the as-received material was directly brought above the d solvus (1050 °C), the majority of the precipitates found at the grain boundaries were still secondary (Nb,Ti)C carbides. However, if the as-received material was heated below the d solvus (933 °C) from room temperature, d phase but also (Nb,Mo)2CrB2 borides precipitated at grain
FIB-SEM of the UMS Raimond Castaing. TEM imag-ing and Selected Area Electron Diffraction (SAED) patterns were performed at 200 kV in a JEOL JEM 2100F TEM microscope, whereas STEM imaging, STEM-EDX analyses and Electron Energy Loss Spec-trometry (EELS) analyses were performed at 200 kV in a JEOL JEM-ARM200F Cold FEG TEM microscope equipped with a Cs corrector probe (resolution: 0.78 A˚). The two TEM microscopes belong to the UMS Rai-mond Castaing. The STEM-EDX spectra were acquired with a JEOL CENTURIO-X Silicon Drift EDS detector and the EELS spectra were acquired with a GATAN GIF QUANTUM ER spectrometer.
One should note that, after each thermal treatment, the microstructure located at the center of the samples was analyzed (the samples were 6 mm thick), so that the results could not be influenced by some edge effects. Then, for each sample, repeated acquisitions (images, EDS and EBSD analyses) were performed at totally
Table I. Chemical Composition Given in the Alloy Certificate, Wt Pct
Ni Fe Cr Nb Mo Ti Al 52.39 to 52.42 19.17 to 19.18 18.21 to 18.22 5.18 to 5.25 3.04 to 3.05 0.97 to 0.98 0.50 to 0.51 Si Mn C Ta Co Cu N 0.07 0.04 0.036 0.01 0.01 <0.01 to 0.01 0.0040 to 0.0045 B P S Mg Ca Zn Sn 0.0037 to 0.0039 0.003 0.0010 to 0.0011 0.0004 to 0.0005 <0.0002 to 0.0002 <0.0010 <0.0010 O Pb Ag Se Bi <0.0010 <0.0003 <0.0002 <0.0001 <0.00003
Fig. 1—Thermal path applied to the material in case of subsolvus d treatment. The subsolvus d treatment (plateau at 933 °C) is plotted black, the subsequent supersolvus d treatment (1050 °C) is plotted red. Different durations were performed for the supersolvus d treatment: 10, 30, 60 and 120 min (Color figure online).
and EBSD analyses, the sample surfaces were polished for few minutes with a colloidal solution containing 50 nm alumina particles, and finally a vibratory polishing using a 5 pct alumina colloidal solution was performed for 2 hours.
Some images and EDS analyses were performed in a conventional Scanning Electron Microscope (SEM) from the Thermo Fisher Scientific Company (Thermo ScientificTM QuantaTM 450 SEM). This SEM was equipped with a Quantax Silicon Drift EDS detector from the Bruker Company. The EDS-EBSD coupled analyses were done in a JEOL JSM-7100TTLS LV FEG-SEM, at the UMS Raimond Castaing (Toulouse, France). This microscope was equipped with an X-Max Silicon Drift EDS detector and an AZtec HKL Advanced Nordlys Nano EBSD detector, both from the Oxford Instruments Company. In order to perform Transmission Electron Microscopy (TEM), some thin-foil lifts-out were performed in the FEI HELIOS 600i
random locations within the sample’s center, so that all the conclusions of the present study are independent from grain boundary misorientation or other crystallo-graphic parameters.
C. Microstructure of the As-Received Material
The as-received material showed a fully recrystallized microstructure with coarse grains (Figure2(a)): the grain diameters were in the 70 to 350 lm range with a mean grain diameter at about 170 lm. The BSE images showed numerous bright particles measuring several micron large (Figure2). Their bright aspect meant that the average atomic number of their phase was higher than that of the c matrix. These particles were primary (Nb,Ti)C carbides in which niobium was the main metallic element. Large primary (Ti,Nb)(C,N) carboni-trides, which appeared dark on BSE images because their main metallic element was titanium (Figure2(c) and yellow circles in Figure2(a)), could be also observed in the microstructure, although they were much rarer than the primary (Nb,Ti)C carbides. If the primary carbides were found aligned along the former rolling direction (‘‘RD’’ in Figure2(b)), both primary carbides and primary carbonitrides were indifferently located either inside the grains or at the grain boundaries (Figure2). The primary carbides and primary carboni-trides precipitate from a liquid-state alloy during the
solidification process[10,11] and are known to be barely affected by the solutions treatments applied to the alloy. Other precipitates were specifically located at the grain boundaries of the as-received material. These precipitates were much thinner than the primary car-bides and primary carbonitrides (Figure3). On BSE images, they appeared as bright particles usually elon-gated along the grain boundaries and their width was, in average, less than 100 nm. Even if they were very small, these precipitates could be easily found along the grain boundaries because their presence was always linked to a change in the grain boundary curvature (red arrows in Figure3). The changes in the grain boundary curvature were the consequence of the pinning force that the small precipitates applied on the grain boundaries. Indeed, when a grain boundary encounters a small particle, the small particle locally slows down the migration of the grain boundary.[24] In the same way as the primary (Nb,Ti)C carbides, EDS analyses showed that the small precipitates were enriched in niobium, titanium and carbon compared to the c matrix (TableII). Hence, these small precipitates along grain boundaries were secondary (Nb,Ti)C carbides, that is, (Nb,Ti)C carbides which precipitated from a solid-state alloy during the hot forming stages or thermal treatments which were performed after the alloy solidification.[5,10] Compared to the primary carbides, higher amounts of nickel, iron and chromium were measured for the secondary
Fig. 2—Overview of the as-received material. (a), (b) and (c): BSE images. The bright particles visible in (a), (b) and (c) are primary (Nb,Ti)C carbides. The dark particles visible in (b) and in the yellow circles in (a) are primary (Ti,Nb)(C,N) carbonitrides. ‘‘RD’’ stands for rolling direction (Color figure online).
to the secondary carbides, a single specimen of needle-like precipitate was found at the grain boundaries of the as-received material (blue arrow in Figure3(d)). This needle-like precipitate appeared dark on the BSE image, meaning that the average atomic number of the
Fig. 3—Intergranular precipitates found in the as-received material. (a), (b), (c), (d) and (e): BSE images. (f) SE image. The red arrows highlight some intergranular precipitates whose average atomic number is higher than that of the c matrix. The blue arrow highlights a needle-like precipitate whose average atomic number is lower than that of the c matrix. The results of the EDS spectrum localized in (e) are presented in TableII(Color figure online).
Table II. Chemical Composition of the Bright Intergranular Precipitates Found in the As-Received Material (EDS Spectrum
Localized in Fig.3e)
Phase Ni Fe Cr Nb Mo Ti Al C
Precipitate (Fig.3(e)) 6.9 4.8 6.3 25.6 0.8 4.6 0.3 50.7
1st (Nb,Ti)C 1.4 0.6 0.7 38.8 0.3 8.1 0.1 50.0
c(matrix) 48.6 16.8 16.6 2.5 1.6 0.9 0.9 12.1
Comparison with a primary (Nb,Ti)C carbide and with the c matrix. EDS measurements performed at 10 kV, normalized at. pct including carbon in the quantification.
carbides because of the collection of X-rays coming from the surrounding matrix when analyzing such small precipitates (the spatial resolution of the EDS technique is typically a few hundred nanometers at 10 kV for nickel-based superalloys[25]). Furthermore, in addition
much smaller quantities than the secondary (Nb,Ti)C carbides. The first type of intergranular precipitates appeared as a bright particle containing mainly chro-mium, niobium and molybdenum (precipitate B in Figure4and TableIV). A single precipitate of this type was found when scanning the microstructure, meaning that this type of precipitate was very rare after the supersolvus treatment of the as-received material. The chemical composition of this precipitate was very different from that of a secondary (Nb,Ti)C carbide (precipitate A in Figure4 and TableIV). Since no specimen of such a phase had been noticed in the as-received material, perhaps very small amounts of this minor phase formed during the supersolvus d treatment. Then, if it is known that the C14 Laves phase can precipitate above the d solvus,[3]the chemical composi-tion of precipitate B (26.9Cr-31.8Nb-26.0Mo-6.3Ni-7.5-Fe-1.2Ti-0.3Al at. pct) does not fit with that of a C14 Laves precipitate ((Ni,Fe,Cr)2(Nb,Mo,Ti)). However,
the chemical composition of precipitate B is close to that reported by Vincent,[20] Chen et al.[21] and Benhadad et al.[15]for their M3B2borides rich in Cr, Nb and Mo.
Indeed, if boron is omitted, Benhadad et al.[15]reported the following composition: 24Cr-38Nb-30Mo-2Ni-5-Fe-1Ti at. pct. The presence of (Cr,Nb,Mo)3B2borides
in the microstructure will be confirmed by the crystal-lographic elements presented in SectionIII–B. Finally, like for the as-received material, one dark needle-like precipitate was observed after the supersolvus d treat-ment (Figure4(e)). Because the needle-like precipitates were very infrequent precipitates both before (Figure3) and after the supersolvus d treatment (Figure4), it was reasonable to think that the needle-like phase was little affected by the supersolvus exposure.
B. Grain Boundary Phase Evolution During the Subsolvus d Treatment
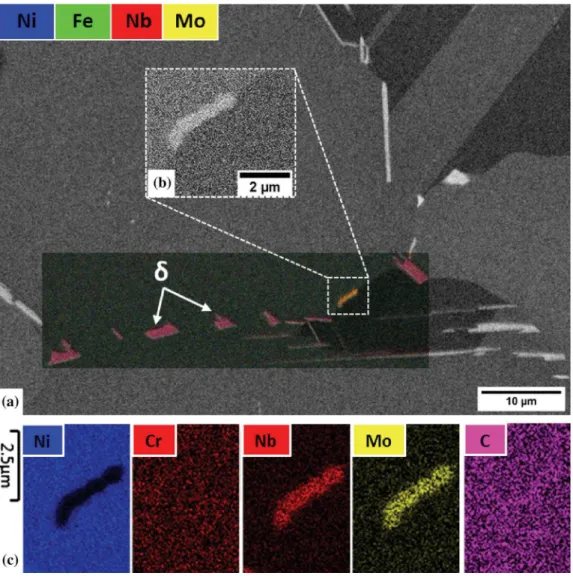
As expected, when the as-received material was treated below the d solvus, d precipitates formed at grain boundaries (Figure6(a)). However, EDS map-pings revealed that other precipitates than d precipitates formed during the subsolvus treatment (Figures6(b) through (c)). Like the d precipitates and the (Nb,Ti)C carbides, the precipitates in question showed high amounts of niobium (Figure6(c)). Furthermore, these particles were very rich in molybdenum and chromium (Figure6and TableV), whereas very little molybdenum and chromium were measured for the d precipitates (TableV) and the (Nb,Ti)C carbides (TableII) in accordance with literature.[3] In fact, these precipitates showed the same chemical composition as the precipi-tate B pointed out in SectionIII–A. However, after the subsolvus d treatment, such type of precipitate was much more frequent than after the supersolvus treat-ment (SectionIII–A).
The greater occurrence of the phase rich in Cr, Nb and Mo enabled the study of its crystallography. SAED patterns were obtained from three precipitates (Figures7andA1in appendix). All the SAED patterns could be properly indexed with the tetragonal structure P4/mbm (space group number: 127) whose lattice phase was lower than that of the c matrix. The nature of
such a precipitate will be analyzed later in the article, at a point where much more needle-like precipitates will be evidenced (Section III–C).
Here, a discussion about the carbon contents mea-sured with the EDS technique is necessary. If it seems logical to measure high carbon contents for the (Nb,Ti)C carbides, one can notice that the carbon content measured for the c matrix (12.1 at. pct in Table II) is clearly an artifact, since the amount of carbon in the matrix should be only a few hundred wt ppm (Table Iand Reference 26). The contamination of the sample surface with carbon could occur as the sample was scanned in the SEM (carbonaceous mole-cules fixed at the sample surface[27]) and/or during polishing since the resin used for the sample mounting contained carbon filler. Yet, the use of a low accelerating voltage (10 kV) improved the spatial resolution of the EDS measurement by reducing the depth of the col-lected X-rays, but also implied an enhanced sensitivity to surface contamination. Thus, because the EDS carbon measurements were often unreliable in the present study, the EDS quantifications of the following paragraphs will omit carbon: the carbon peak has only been used for the deconvolution of the energy peaks (TableIII). Nevertheless, when necessary the EDS carbon content will be commented on a qualitative point of view.
III. RESULTS AND DISCUSSIONS
A. Grain Boundary Phase Evolution During the Supersolvus d Treatment
This part analyzes the intergranular precipitates found in the as-received material treated above the d solvus (1050 °C for 120 minutes—see Part II.B). After the supersolvus d treatment, bright intergranular pre-cipitates were visible in BSE images (Figure 4). Almost all these bright intergranular precipitates were identified as secondary (Nb,Ti)C carbides, because EDS analyses showed that they were enriched in niobium, titanium and carbon compared to the c matrix (see precipitate A in Table IV). On the smallest bright precipitates, that were the precipitates for which the EDS results were the most uncertain, complementary EBSD analyses were performed to confirm an FCC structure as is the case for (Nb,Ti)C carbides (Figure 5). Indeed, the spatial reso-lution of the EBSD technique - typically in between 60 and 100 nm for a FEG-SEM microscope[28]—is much better than that of the EDS technique. The intergranular secondary (Nb,Ti)C carbides observed following the supersolvus d treatment had a mean equivalent diameter of about 440 nm and the maximum equivalent diameter was found to be 710 nm. These intergranular secondary carbides were likely to originate from the coarsening of the tiny intergranular secondary carbides initially observed in the as-received material.
Two other types of intergranular precipitates were observed after the supersolvus treatment of the as-re-ceived material, although they were observed in very
A
A
Here, the TEM-EDX spectrum acquired on the particle 1 of Figure7 gave the chemical composition 1.2Ti-37.5Nb-26.5Mo-26.5Cr-4.6Fe-2.8Ni at. pct, lead-ing to 1.9 for the L/S ratio. Then, the M3B2borides of
the present study were called (Nb,Mo)2CrB2borides.
Finally, one can notice that no boron peak was detected in the EDX spectra when analyzing the (Nb,Mo)2CrB2 borides (Figure7c). Two main reasons
account for this point. First, because the Ka line of
boron is a very low energy line (0.183 keV), a 10 kV accelerating voltage is still much too high to properly activate the Kaelectronic transitions of boron. In fact, to
observe the Ka boron line, the ideal accelerating voltage
is 2 keV.[30]Second, even if the accelerating voltage had been reduced, the Ka line of boron would have
over-lapped with the Mf2 lines of niobium and molybdenum
(0.172 keV and 0.193 keV respectively) also present in the EDX spectrum of the (Nb,Mo)2CrB2 borides
(Figure7(c)). Thus, detecting a boron peak in the EDX spectra of the (Nb,Mo)2CrB2 borides was very
challenging. To confirm the presence of boron in the precipitates, EELS analyses had to be performed (FigureA3in appendix). Indeed, EELS is a character-ization technique which is highly sensitive to light elements.[31]
Grain boundaries are classical nucleation sites for d precipitates.[9] However, it is also known[3,4] that pri-mary (Nb,Ti) carbides can be nucleation sites for d precipitates. This was clearly observed in the present
Table III. Same Results as Those Presented in TableIIExcept that Carbon Is Excluded from the Quantification
Phase Ni Fe Cr Nb Mo Ti Al
Precipitate (Fig.3(e)) 13.7 9.6 12.7 52.5 1.6 9.4 0.5
1st (Nb,Ti)C 2.8 1.3 1.3 77.6 0.7 16.1 0.2
c(matrix) 55.3 19.1 18.9 2.9 1.8 1.0 1.0
Normalized at. pct omitting carbon.
Fig. 4—Intergranular precipitates found in the as-received material treated supersolvus d. (a), (b), (c) and (d): BSE images. (e) SE image. In (a), (b) and (c) the bright intergranular precipitates are all (Nb,Ti)C carbides. In (d) and (e) two other types of intergranular precipitates are displayed. The EDS analyses of the precipitates A and B are presented in TableIV.
Table IV. Chemical Compositions of the Intergranular
Precipitates A and B Presented in Fig.4
Precipitate Ni Fe Cr Nb Mo Ti Al
A 19.3 7.9 9.0 51.5 1.0 10.8 0.5
B 6.3 7.5 26.9 31.8 26.0 1.2 0.3
EDS measurements performed at 10 kV. Normalized at. pct omitting carbon.
parameters were set to a = 5.72 A˚ and c = 3.09 ˚ (FiguresA1 and A2 in appendix). In addition, the EBSD patterns acquired on several precipitates rich in Cr, Nb and Mo were also successfully indexed with the tetragonal structure P4/mbm (Figure 8). Yet, the tetrag-onal structure P4/mbm and a c/a ratio equal to 0.54 are typical of M3B2 borides.[29] The lattice parameters found
in the present study were very close to that found by Vincent[20] for his (Nb,Mo,Cr)3B2 borides (a = 5.78 ˚
and c = 3.16 A˚ [20]). However, if Vincent[20]recognized a lack of stoichiometry for his (Nb,Mo,Cr)3B2 borides,
here the stoichiometry of the M3B2structure was rather
well respected. Indeed, it is known that the M3B2 phase
is actually an arrangement of large metallic atoms (L), smaller metallic atoms (S) and boron atoms (B) so that the exact chemical formula is L2SB2.[20, 29] The large
metallic atoms are typically Ti, Nb and Mo, while the smaller metallic atoms are typically Cr, Fe and Ni.[20]
carbides are neutral regarding d precipitation and so they still exist in their initial shape in the subsolvus material, but their small size makes their distinction difficult among the numerous and larger intergranular precipitates (the d, (Nb,Ti)C and (Nb,Mo)2CrB2phases
appear all bright in BSE images). The second assump-tion is that, in the same way as the primary (Nb,Ti)C carbides, the secondary carbides are nucleation sites for the d precipitates. The second assumption is considered as the most likely one, since many d precipitates were found at a change in grain boundary curvature (Figures9(a) through (b)), in the same way as the tiny secondary (Nb,Ti)C carbides of the as-received material (Part II.C). Then, the nucleation of d phase on such tiny carbides could led to the dissolution of these precipi-tates. Yet, the results of Kirman et al.[8]support the idea that small intergranular NbC carbides can dissolve during subsolvus d treatments. Indeed, when heating in the 650 °C to 750 °C range a Ni-Fe-Cr-Nb alloy which was previously solution treated at 1150 °C, Kirman et al.[8] noticed that the initial intergranular NbC carbides were progressively replaced by M23C6 and d
precipitates. Finally, after the subsolvus d treatment of the as-received material, round-shaped secondary (Nb,Ti)C carbides were noticed within the grains (yellow arrows in Figure10). The diameter of these secondary carbides was in the 300 to 600 nm range. The precip-itation of such intragranular carbides was attributed to a decreased carbon solubility[32] in the matrix when treating the as-received material at a temperature lower than that of the solution treatment performed just before (1065 °C—see Part II.B).
C. Supersolvus d Evolutions of the Intergranular Precipitates Grown During the Subsolvus d Treatment
This part analyzes in detail the supersolvus evolutions of the intergranular phases which precipitated during the subsolvus treatment, namely the d phase and the (Nb,Mo)2CrB2phase (see Section III–B). The objective
was also to state if a previous subsolvus treatment had an impact on the subsequent intergranular supersolvus precipitation. For that, like the as-received material, the material treated subsolvus d was reheated at 1050 °C. Several durations were performed: 10, 30, 60 and 120 minutes.
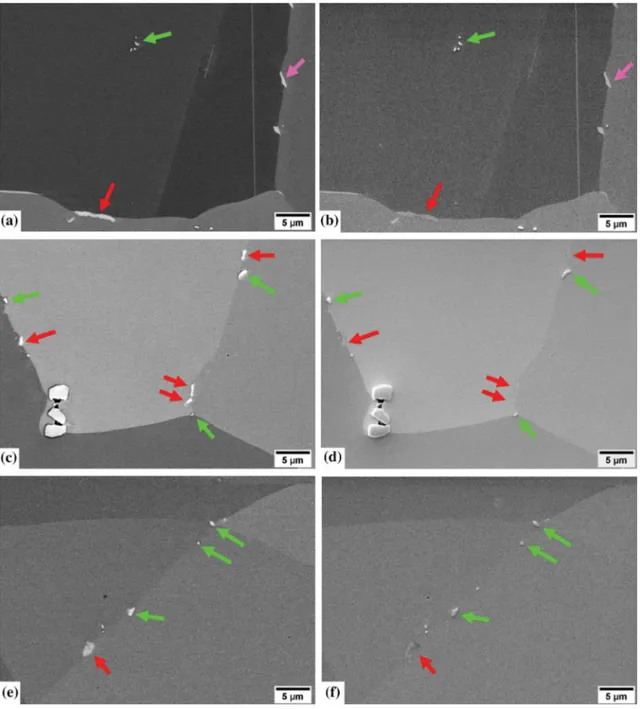
The material reheated for 10 minutes at 1050 °C still exhibited d precipitates (pink arrows in Figures11(a) through (b)) However, after 30 minutes of supersolvus treatment, the d phase was completely dissolved (Figures11(c) through (f)). On the other hand, after 120 minutes of supersolvus treatment, intergranular (Nb,Mo)2CrB2borides were still visible (red arrows in
Figures11and12), and two other types of intergranular precipitates were noticed: intergranular secondary (Nb,Ti)C carbides (green arrows in Figures11 and12) and the dark needle-like precipitates (Figure12) already pointed out in Part II.C and SectionIII–A. Interest-ingly, while the (Nb,Mo)2CrB2borides returned little SE
signal (red arrows in Figures11and12), the secondary (Nb,Ti)C carbides appeared super bright on SE images because they were much more in relief at the sample
Fig. 5—Identification of small secondary (Nb,Ti)C carbides using EDS-EBSD coupled analyses, as-received material treated supersolvus d. (a) and (c): EBSD orientation maps, all the indexed points are indexed with the FCC crystallographic structure. The color code is defined by the projection of the Z axis (axis perpendicular to the sample surface) within the crystal frame (the FCC crystal frame is represented by the standard triangle). (b) and (d): Phase maps. To discriminate the (Nb,Ti)C phase from the c phase on the phase maps, the EBSD and EDS techniques had to be combined. Indeed, the indexing algorithm used here did not allow the distinction of two phases having the same crystal structure but different lattice parameters. Thus, to perform the phase discrimination on the phase maps, a reference EDS spectrum (10 kV) were defined for each FCC phase. The coarser spatial resolution of the EDS technique explains why on the phase maps the (Nb,Ti)C carbides are a bit larger than the real size of the particles (Color figure online).
study when the as-received material was treated sub-solvus d: during the subsolvus d treatment some d needles nucleated on primary (Nb,Ti) carbides which were located either at grain boundaries (Figures 9(a) through (b)) or within the grains (Figure 9(c)). More surprisingly, some (Nb,Mo)2CrB2 borides were also
found to be in contact with d precipitates (Figures 9(a) through (b)). This may suggest that one phase can help the other to precipitate in the same way that the primary (Nb,Ti)C can be nucleation sites for d precipitates or, conversely, that d precipitates can be nucleation sites for r, a-Cr and C14 Laves phases.[4]
Lastly, contrary to what was observed for the as-received material treated supersolvus d (Sec-tionIII–A), after the subsolvus d treatment of the as-received material no secondary carbide development was noticed at the grain boundaries. Yet the analysis of the as-received microstructure highlighted tiny sec-ondary carbides at the grain boundaries (see Part II.C). This raises the question of the evolution of these tiny carbides during the subsolvus treatment. Two assumptions can be made. The first one is that the tiny
on BSE images, this difference in relief, and so in SE signal, was very convenient to distinguish the two types of intergranular precipitates, thus avoiding the use of the EDS technique which had a limited spatial resolution.
The combination of the BSE and SE images was used to quantify the intergranular secondary (Nb,Ti)C car-bides and the (Nb,Mo)2CrB2borides as a function of the
reheating time at 1050 °C (Figure13). However, it should be specified here that the coarse grain size, and both the scattered distribution and the small size of the
Fig. 6—Intergranular precipitates found in the as-received material treated subsolvus d. (a) BSE image and EDS map overlapped. The white square highlights a particle which differs from the surrounding d precipitates. (b) FSE image. (c) EDS elemental maps (10 kV) performed on the particle displayed in (b).
Table V. Chemical Composition of the Intergranular Precipitates Found in the As-Received Material Treated Subsolvus d,
Comparison with the c Matrix
Phase Ni Fe Cr Nb Mo Ti Al
d 70.0 4.1 2.7 18.8 0.8 3.2 0.4
Precipitate in Fig.6(b) 9.6 6.1 28.3 27.2 27.7 0.8 0.3
c 54,1 19,8 19,6 2.4 1.9 0.9 1.3
EDS measurements performed at 10 kV. Normalized at. pct omitting carbon.
surface than the borides. Yet, Takagi et al.[33] showed that at room temperature Mo1.25Ni0.25Cr1.5B2 borides
(tetragonal structure) had similar Vickers hardness than the NbC carbides, that is around 2000 HV[34] (whereas the hardness of the solution-treated matrix is about 230 to 250 HV[35]). Thus, the difference in relief between the two types of precipitates cannot be explained by a significant difference in hardness. Another factor, prob-ably a chemical one, must be responsible for this difference in relief. Since both secondary (Nb,Ti)C carbides and (Nb,Mo)2CrB2 borides appeared bright
intergranular precipitates all together made an accurate quantification complicated. Thus, the figures presented in Figure13 must be considered as general trends and not as absolute phase fraction values. Figure13 shows that the (Nb,Mo)2CrB2borides were affected by the high
temperature exposure since the area fraction of the phase was found to slowly decreases with the reheating time (Figure13). However, it is worth noting here that after reheating the subsolvus material for 120 minutes at 1050 °C much more (Nb,Mo)2CrB2 borides were still
observed than after heating the as-received material for 120 minutes at 1050 °C (see SectionIII–A). Then, the quantification of the intergranular secondary (Nb,Ti)C carbides showed that the (Nb,Ti)C phase fraction gradually increased with the reheating time at 1050 °C (Figure13). After 120 minutes of reheating at 1050 °C, the intergranular carbides exhibited a mean equivalent diameter of 550 nm and a maximum equivalent diameter of 1620 nm, which was higher than what was measured for the intergranular carbides of the as-received material treated supersolvus d (see SectionIII–A). On the other hand, the intragranular secondary carbides pointed out after the subsolvus treatment of the as-received material tended to dissolve (Figure14) when they were exposed to 1050 °C. This way, when the material treated subsolvus d was reheated at 1050 °C, the carbon solubility increased within the grains and intragranular carbides dissolved, releasing carbon atoms in the matrix. Some of the released carbon atoms could have migrated towards the grain boundaries to react with the carbide forming elements (here titanium and niobium) coming from the dissolution of the d and (Nb,Mo)2CrB2phases.
Lastly, it is important to say here that both the partial dissolution of the (Nb,Mo)2CrB2phase and the growth
of the secondary (Nb,Ti)C phase observed when reheat-ing the material at 1050 °C were in line with literature. Indeed, the thermodynamic data presented in the work of Masoumi et al.[36]show that the equilibrium volume fraction of the M3B2phase is slightly smaller at 1050 °C
than at 933 °C. In addition, Collins[6] also reported an increased MC volume fraction following the dissolution of the d phase.
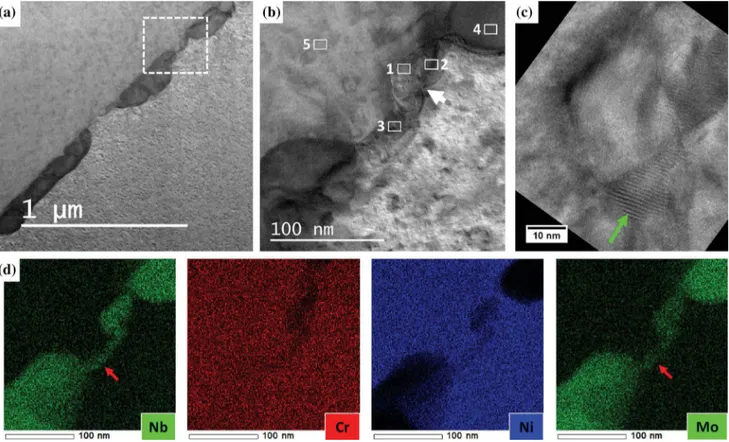
The reaction of carbon with elements coming from the dissolution of the (Nb,Mo)2CrB2 phase was
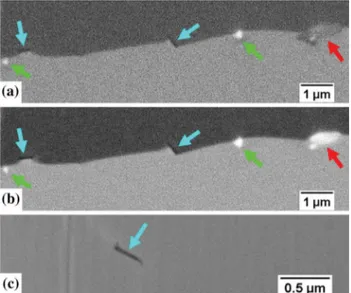
observed in a TEM thin-foil (Figure15). Indeed, STEM-EDX elemental maps (Figure15(d)) revealed an enrichment in niobium and molybdenum in a grain boundary portion in between two (Nb,Mo)2CrB2
bor-ides. The niobium and molybdenum atoms appear to come from the dissolution of the two (Nb,Mo)2CrB2
borides caused by the high temperature exposure. In between the two dissolving (Nb,Mo)2CrB2 borides,
Moire´ fringes with about 1 nm spacing were evidenced (green arrow in Figure15(c)). In TEM, Moire´ fringes result from the overlay of two crystal lattices, not necessarily from the same phase, whose interplanar distances are close to each other. Here, the STEM-EDX analyses confirmed that the chemical composition of the Moire´ area (Areas 1 and 2 in TableVI) was different from that of the c matrix (Area 5 in TableVI). Indeed, the Moire´ area exhibited six times more niobium than the matrix, as well as larger amounts of molybdenum
Fig. 7—Two particles rich in Cr, Nb and Mo analyzed with TEM. (a) Bright-field STEM image. The two particles are lying along a grain boundary. Some of the SAED patterns acquired on the particle 1 are presented in Fig.A1 in appendix. The pink circle displays the area (150 nm wide) analyzed when performing the SAED technique. (b) and (c): TEM-EDX spectrum acquired on the particle 1 (200 kV). While (b) display the whole spectrum (0 to 20 keV), (c) focuses on the low energy peaks. The theoretical Ka
lines of boron and carbon (0.183 keV and 0.277 KeV respectively) are superimposed on the spectrum with purple dashed lines. One can notice that the Ka line of boron falls in between the Mf2lines
of niobium and molybdenum (0.172 keV and 0.193 keV respectively). The presence of copper in the spectrum (Ka and La
lines) is due to the sample-holder made of copper (Color figure online).
of two c grains but from the overlay of a c grain and a secondary (Nb,Ti)C carbide which nucleated in between the dissolving (Nb,Mo)2CrB2 borides. This result is
consistent with literature: Kesternich[37] also evidenced
Fig. 8—Precipitate of Fig.6indexed with the tetragonal structure P4/mbm using the EBSD technique. (a) EBSD phase map and band contrast map overlapped. (b) EBSD orientation map, projection of the X axis (axis parallel to the sample surface) within the proper crystal frame, either FCC or M3B2(the crystal frames are represented by the standard triangles). (c) Raw EBSD pattern acquired on the precipitate. (d) Indexation
of the EBSD pattern with the tetragonal structure P4/mbm (a = 5.72 A˚ and c = 3.09 A˚). The solution found by the EBSD software is depicted in blue on the raw pattern: 12 out of the 12 Kikuchi bands detected in the pattern by the EBSD software are successfully indexed and the mean angular deviation (MAD) value is 0.40 deg (Color figure online).
Fig. 9—Interactions between the d phase and some minor phases, as-received material treated subsolvus d. (a) EBSD band contrast map. (b) EDS map performed at 10 kV. (c) BSE image.
and titanium. In addition, much more EDS signal for carbon was collected in this area (37 to 41 at. pct of carbon quantified in the areas 1 and 2 of Figure 15(b)). Thus, the Moire´ fringes did not result from the overlay
the matrix below superimposed making the final diffrac-tion pattern non-indexable (precipitate 2 in Figures16
and 17). However, the EBSD analyses enabled to analyze the spatial orientation of the needle-like precip-itates with respect to the c lattice. Indeed, when comparing the precipitate spatial orientations to c plane traces drawn from poles figures (Figures16(c) and (f)), some needle-like precipitates were found parallel to
111
f gc plane traces, meaning that they were lying on a 111
f gc plane. Yet, needle-like precipitates lying in 111
f gcplanes suggests a 0001ð Þprecipitatek 111ð Þcepitaxial
growth, with a 111h ic growth direction for the precip-itate. Thus, the EBSD analyses enabled to suspect a hexagonal structure for the needle-like precipitates. Then, the EDS analyses revealed that, compared to the c matrix, the needle-like precipitates were depleted in nickel, iron and chromium but enriched with niobium, titanium and sulfur (Figure17). Sulfur was tricky to evidence since the Ka line of sulfur (2.307 keV) was very
close to the Laline of molybdenum (2.293 keV). Because
the EDS analyses were performed at 10 kV to improve the spatial resolution of the analysis, the Ka line of
molybdenum (17.441 keV) could not be observed. However, a slight better spectrum fit was obtained considering sulfur instead molybdenum, and also a high sulfur content would explain why the needle-like phase has an average atomic number lower than that of the matrix (the precipitates appeared dark in BSE images, see Figure12). Furthermore, an hexagonal phase rich in niobium, titanium and sulfur has already been reported in literature for superalloy Inconel 718[19,20]: the (Nb,Ti)2CS carbosulfide phase. The (Nb,Ti)2CS
carbo-sulfides have a hexagonal structure P63/mmc (space
group number: 194) whose lattice parameters are a= 3.21 A˚ and c = 11.20 A˚[20]. Elongated morpholo-gies were very often pointed out for the (Nb,Ti)2CS
carbosulfides: Vincent[20] talked about ‘‘tabular mor-phologies’’ parallel to the (0001) planes of the precip-itate, Sun et al.[19] reported ‘‘needle-like’’ carbosulfides and Whelan et al.[38]talked about ‘‘lath-like’’ particles. Thus, the needle-like morphology noticed here was in agreement with literature. However, in superalloy Inconel 718 like in the other nickel-based superalloys, the (Nb,Ti)2CS carbosulfides usually appear during a
solidification stage.[12,19,20,38] The (Nb,Ti)2CS
carbosul-fides resulting from solidification are thin but usually measure several microns long: primary (Nb,Ti)2CS
carbosulfides exceeding 25 lm long are visible in the micrographs of Holt et al.[12] On the contrary, the present study evidenced that about 1 lm long secondary carbosulfides formed by solid-state precipitation during thermal treatments. More precisely, here, most of the (Nb,Ti)2CS carbosulfides are thought to form during the
supersolvus treatment applied to the material treated subsolvus. Indeed, no increase in the (Nb,Ti)2CS
fre-quency was noticed after the subsolvus treatment, although one recognizes that rare and small (Nb,Ti)2CS Fig. 10—Intragranular secondary (Nb,Ti)C carbides observed in the
as-received material treated subsolvus d. BSE images. The yellow arrows highlight some examples of intragranular carbides (Color figure online).
that the nucleation of MC carbides in cube-cube orientation relationship with the matrix generated Moire´ fringes with 1 nm spacing due to the 20 to 30 pct lattice mismatch between the two phases. Lastly, the higher molybdenum concentration measured in the Moire´ area was attributed to an increased molybdenum concentration in the matrix located just below the carbide nucleus. Indeed, such an increase in molybde-num concentration was measured all along the grain boundary portion in between the dissolving (Nb,Mo)2CrB2 borides (Areas 1, 2 and 3 in Table VI)
and not only in the Moire´ area.
After the supersolvus treatment of the subsolvus material, the needle-like precipitates represented a small minority of the intergranular precipitates. However, because they were still more numerous than in the as-received material (Part II.C) or in the as-received material treated supersolvus (Section III–A), they were easier to find and this enabled the study of their phase. Some EBSD analyses were performed on the needle-like precipitates (Figure 16). Unfortunately, the needle-like precipitates were too thin to be indexed with their own crystallographic structure: the precipitates were either transparent to the EBSD analysis because only the diffraction pattern of the matrix located below was collected (precipitate 1 in Figure 16) or non-indexed because the diffraction patterns of the precipitate and of
D. Discussion: Interactions Between Segregating Species
Boron, sulfur and phosphorus are known to highly segregate at the grain boundaries of the nickel-based alloys.[39] Carbon also naturally segregates at grain boundaries but to a smaller extent than boron, sulfur and phosphorus,[40] because it is more soluble in the c phase than the latter elements.[32,41] Nevertheless, when several segregating species are present in the microstruc-ture, interactions occur. Especially, interactions between
Fig. 11—Main intergranular precipitates found when the material treated subsolvus d was reheated supersolvus d. Left column: BSE images. Right column: SE images. (a) and (b) Reheated 10 min at 1050 °C. (c) and (d) Reheated 30 min at 1050 °C. (e) and (f) Reheated 120 min at 1050 °C. Pink, green and red arrows highlight d precipitates, secondary (Nb,Ti)C carbides and (Nb,Mo)2CrB2 borides respectively. One can
notice that if the secondary carbides, d precipitates and (Nb,Mo)2CrB2 borides appear all bright on BSE images, on SE images the secondary
carbides return a lot of signal, the (Nb,Mo)2CrB2borides return little signal and the d precipitates return a signal between the two other (Color
figure online).
carbosulfides would have been difficult to identify among numerous and large d precipitates.
Figure18summarizes the characteristic phases found at each thermal step of the present study. Comparing the phases evidenced in the subsolvus d material treated supersolvus d to those of the as-received material treated supersolvus d shows that, in superalloy Inconel 718, a subsolvus d treatment can have an impact on the subsequent supersolvus d precipitation.
et al.,[42] the addition of boron suppressed the precip-itation of M23C6 carbides at grain boundaries because
boron diffuses faster than carbon in the c matrix and thus the boron atoms reached the grain boundary sites before the carbon atoms. In fact, the idea that the segregating species compete for the grain boundary sites is very widespread in literature.[15,44] Li et al.[43] also noticed that increasing boron from 0 to 100 wt ppm while keeping the carbon concentration constant at 400 to 600 wt ppm in their nickel alloy strongly reduced the amounts of NbC and M23C6 carbides at grain
bound-aries and led to the precipitation of intergranular M4B3
borides. But, when increasing carbon from 70 to 960 wt ppm while keeping the boron concentration constant at 30 to 50 wt ppm in the same nickel alloy, Li et al.[43] observed that the intergranular M4B3 borides became
much rarer and that the amounts of NbC and M23C6
carbides at grain boundaries markedly increased. Thus, Li et al.[43]concluded that, if in nickel the driving force for grain boundary boron segregation is much higher than that for carbon, the segregation of boron at grain boundary can be hindered by high concentrations of solute carbon atoms: the carbon atoms continuously fill the interstices of the grain boundaries and so slow down the diffusion of the boron atoms at the grain boundaries. Benhadad et al.[15] and Alam et al.[40] obtained similar results to those of Li et al.[43] when increasing carbon
Fig. 12—Dark needle-like precipitates found at the grain boundaries of the material treated subsolvus d and reheated supersolvus d. (a) Reheated 30 min at 1050 °C, SE image. (b) Reheated 30 min at 1050 °C, BSE image. (c) Reheated 60 min at 1050 °C, SE image. The green and red arrows highlight the secondary (Nb,Ti)C carbides and the (Nb,Mo)2CrB2 borides respectively. The blue arrows highlight
the needle-like precipitates in question, they appear dark both on SE
and BSE images (Color figure online). Fig. 14—Intragranular secondary (Nb,Ti)C carbides observed in thematerial treated subsolvus d and reheated supersolvus d. BSE images. The yellow arrows highlight examples of intragranular carbides. From the comparison with Fig.10(both figures are at the same scale), one can notice that the intragranular secondary carbides significantly dissolved during the exposure at 1050 °C (Color figure online).
Fig. 13—Quantity of intergranular precipitates as a function of the reheating time at 1050 °C. Quantification of the precipitates made from the combined analysis of the BSE and SE images. Total area of the respective phases reported to the length of analyzed grain boundaries. ‘‘GB carbides’’ stands for intergranular secondary (Nb,Ti)C carbides. After reheating 30 min at 1050 °C, the dissolution of the d phase was complete. Because the microstructural parameters made an accurate phase quantification complicated, the data presented here must be interpreted qualitatively and not quantitatively.
C and B have been reported several times in nickel alloys.[15,40,42,43] For instance, when increasing boron from <50 at. ppm to 300 at. ppm and keeping carbon constant (4400-4700 at. ppm) in the nickel-based super-alloy STAL15-CC, Kontis et al.[42] replaced the inter-granular and Cr-rich M23C6 carbides precipitated at 845
In the present study, the as-received material had been solution-treated at high temperature (1065 °C) before its reception. During this exposure at high temperature, the solubility of carbon and boron in the matrix increased and the equilibrium grain boundary segregation of carbon and boron decreased,[21] so that some of the carbon and boron atoms initially segregated at grain boundaries left the grain boundaries for the matrix. Then, the material was cooled at the end of the solution treatment. Yet, it is known that significant non-equilib-rium grain boundary boron segregation occurs when cooling a boron-containing alloy,[21,40] and that, what-ever the cooling technique (from water quenching to air
Fig. 15—Dissolving (Nb,Mo)2CrB2borides along a grain boundary. TEM thin-foil lifted-out from the sample reheated 10 min at 1050 °C after
the subsolvus d treatment. (a) Bright-field STEM image. (b) Bright-field STEM image, the focus is made on the white square area defined in (a). The STEM-EDX analyses of the areas labelled from 1 to 5 are presented in TableVI. (c) TEM imaging, the focus is made on the area pointed out by the white arrow in (b). The green arrow highlights parallel lines: these parallel lines are Moire´ fringes, they evidence the overlay of two crystal lattices. (d) STEM-EDX elemental maps (200 kV). The red arrows highlight the diffusion of niobium and molybdenum atoms from the (Nb,Mo)2CrB2borides to the grain boundary (Color figure online).
Table VI. Chemical Compositions of the Five Areas Labelled in Fig.15(b)
Zone Area Ni Fe Cr Nb Mo Ti Al GB # 1 36.2 13.7 13.6 28.5 4.1 2.7 1.2 GB # 2 38.9 12.8 13.4 25.8 5.9 2.4 0.8 GB # 3 52.4 18.4 18.4 4.3 4.6 1.0 0.9 (Nb,Mo)2CrB2 # 4 2.0 4.0 21.7 35.6 35.6 0.7 0.4 c # 5 52.4 19.5 19.4 3.8 2.6 1.0 1.3
STEM-EDX measurements performed at 200 kV. Normalized at. pct omitting carbon and boron (boron could not be evidenced using the EDX technique, see SectionIII–B).
while keeping boron constant in superalloy Inconel 718: (i) Benhadad et al.[15]no longer observed M3B2borides
at grain boundaries, (ii) Alam et al.[40] measured a decrease in boron concentration at grain boundaries, this decrease being much more significant than the resulting increase in carbon concentration at grain boundaries. Because grain boundary site competition was not sufficient to explain their observations, Alam et al.[40] proposed that the solute carbon atoms affects the diffusion behavior of boron in the bulk solid solution, by preventing the formation of clusters of segregating species (B, P and C) in the matrix.
cooling[21,40]). Non-equilibrium grain boundary boron segregation means that high boron concentrations are obtained in the vicinity of the grain boundaries through the diffusion of B-vacancy complexes towards the grain boundaries during cooling. Indeed, the cooling process generates a vacancy gradient from the grain interior to the grain boundaries which leads to a driving force for the migration of B-vacancy complexes. For a given cooling technique, the higher is the solution treatment temperature, the higher is the boron concentration in the vicinity of the grain boundaries after cooling.[21]When reheating the material after cooling, the B-vacancy complexes keep diffusing towards the grains boundaries to allow the vacancies to annihilate at grain bound-aries[21,45]: this generates a peak in the non-equilibrium grain boundary boron segregation. Then, once the vacancies annihilated, the back-diffusion of boron atoms occurs, the non-equilibrium segregation gradually disappears, and the equilibrium boron segregation inside the grain boundaries is reached. But the non-equi-librium grain boundary segregation and especially the
Fig. 16—Spatial orientation of the needle-like precipitates with respect to the matrix crystallography. Sample reheated 30 min at 1050 °C after the subsolvus d treatment. EBSD analyses performed at 10 kV. (a) and (d): Band contrast maps. When analyzing the needle-like precipitates, the EBSD signal is mainly composed of the EBSD signal coming from the matrix located below because the spatial resolution of the EBSD technique is too large for such thin precipitates. This explains why, on the band contrast maps (a) and (d), the 2 needle-like precipitates appear darker than the matrix: the presence of the precipitates at the sample surface degrades the quality of the EBSD patterns coming from the matrix below. (b) and (e): EBSD orientation maps, projection of the Y axis (axis parallel to the sample surface) within the crystal frame (the FCC crystal frame is represented by the standard triangle). The precipitate 2 is non-indexed whereas the precipitate 1 is totally transparent to the EBSD analysis. (c) and (f): {111} pole figures on a spherical grid (graduation: 10°). {111} normals are plotted in the sample frame using a stereographic projection. The {111} normals of a given crystal are displayed with the color of the crystal on the orientation map (b and e). Bold dotted lines display the {111} plane traces parallel to the needle-like precipitates.
Fig. 17—EDS analysis of a needle-like precipitate. Sample reheated 30 min at 1050 °C after the subsolvus d treatment. (a): EBSD orientation maps, projection of the Y axis (axis parallel to the sample surface) within the crystal frame (the FCC crystal frame is represented by the standard triangle). The needle-like precipitate appear black because it is non-indexed. From (b) to (d): EDS elemental maps performed at 10 kV. The S elemental map was obtained by centering the energy window on the more intense line that S exhibits in the 0 to 10 keV energy range (as it was done for the other elements analyzed at 10 keV). Thus, the S elemental map is based on the Kaline of S (2.307 keV).
were trapped within the intragranular carbides, they did not hindered the diffusion of boron atoms towards the grain boundaries. This conclusion is in line with the results of Erhart et al.[46] who studied the grain boundary phosphorous segregation in a-iron. Indeed, Erhart et al.[46]showed that the addition of Cr in Fe-C-P alloys strongly reduced the activity of carbon in the matrix because of the precipitation of Cr-rich carbides. Then, this reduced carbon activity allowed increased phosphorous concentrations at grain boundaries.[46]
When the material was reheated at 1050 °C after the subsolvus treatment at 933 °C, the solubility of boron increased both in the grain boundaries and in the bulk. Thus, the alloy became undersaturated in boron and consequently the intergranular (Nb,Mo)2CrB2 borides
started dissolving. Nevertheless, after 120 minutes at 1050 °C the residual (Nb,Mo)2CrB2 borides appear
stable and this evidences that the grain boundaries get once again supersaturated with boron after some dissolution of the phase. In the same time, due to the increased temperature, the solubility of carbon increased within the grains, leading to the dissolution of the intragranular carbides. Some of the released carbon atoms could migrate towards the grain boundaries. Yet, the dissolution of the d and (Nb,Mo)2CrB2 phases
significantly increased the amounts of carbide former elements at grain boundaries, reducing carbon solubility
Fig. 18—Summary of the characteristic phases found at each thermal step of the present study. The phases in blue (primary (Nb,Ti)C carbides and primary (Ti,Nb)(C,N) carbonitrides) are indifferently located either inside the grains or at the grain boundaries. The phases in green are intragranular phases (intragranular carbides found in the subsolvus d material) and the phases in red are intergranular phases.
non-equilibrium grain boundary segregation peak occurring at the beginning of the reheating stage can trigger the precipitation of borides at grain bound-aries.[21,45] After some holding time, these intergranular borides eventually dissolve[21]as the boron sursaturation decreases due to boron back-diffusion.
The intergranular (Nb,Mo)2CrB2 borides observed in
the present study originates from the diffusion of boron atoms to the grain boundaries, presumably through the mechanism of non-equilibrium boron segregation which occurred during the cooling from 1065 °C and the subsequent reheating from 25 °C to 933 °C. Here, the diffusion of the boron atoms towards the grain bound-aries was probably favored by a decreased carbon activity in the matrix. Indeed, the carbon atoms which left the grain boundaries for the bulk during the solution treatment at 1065 °C get involved within intragranular carbide precipitates when the material was reheated at 933 °C, thus decreasing the amounts of solute carbon atoms in the matrix. Intragranular carbides formed when reheating the material at 933 °C because large amounts of carbide former elements (here niobium and titanium) had been released in the matrix during the previous solution treatment at 1065 °C (the decrease in treatment temperature combined with the presence of carbide former elements strongly decreased the solubil-ity of carbon in the matrix). Thus, as the carbon atoms
superalloys were not homogeneously spread in the grain boundary network but rather located along specific grain boundary portions.[21,49]Indeed, since the equilib-rium grain boundary boron segregation is driven by a decrease in the free energy of the grain boundary,[40] boron atoms segregate more in the high-energy grain boundary portions.[50] Here, the spatial distribution of the (Nb,Mo)2CrB2borides was not investigated but this
could be a subject for future research.
Lastly, the dissolution of the d phase at 1050 °C certainly led to the precipitation of the (Nb,Ti)2CS
carbosulfides. Here, high sulfur concentrations at the grain boundaries could not come from an external pollution which occurred during the thermal treatment since the carbosulfides were observed at the center of bulk samples (6 mm thick). However, high sulfur concentrations at grain boundaries are likely to come from the grain coarsening process which occurred during the solution treatment at 1065 °C (before the material’s reception). Indeed, sulfur is known to have a very low solubility in the c matrix[19]and so to largely segregate at grain boundaries. Thus, by decreasing the grain boundary surface in the microstructure, grain coarsening led to increased sulfur concentrations at grain boundaries. Several results in literature evidenced that high boron concentrations reduce the sulfur con-centrations at grain boundaries, even if the driving force for grain boundary sulfur segregation is higher than the driving force for grain boundary boron segregation.[43] Here, it is difficult to say if in the studied alloy the boron concentrations were high enough to decrease the sulfur segregation at grain boundary. However, one may assume that the decrease in carbon activity which occurred during the thermal treatment at 933 °C could have benefited the grain boundary sulfur segregation too.[43] Niobium has a good affinity with sulfur and titanium has an even stronger affinity with sulfur.[38] Then, since the d precipitates contain appreciable amounts of niobium and titanium (TableV), the disso-lution of the d phase at 1050 °C released sulfide former elements in the grain boundaries, which decreased the solubility of sulfur at grain boundaries and led to the precipitation of intergranular (Nb,Ti)2CS carbosulfides.
Due to their very small size and sparse distribution, the (Nb,Ti)2CS carbosulfides evidenced in the present work
are unlikely to be detrimental for the mechanical properties of the alloy. In fact, they could be even beneficial for the alloy properties because their precip-itation reduces the amounts of sulfur segregated at grain boundaries and thus prevents from grain boundary embrittlement.[12]
at grain boundaries. Thus, secondary (Nb,Ti)C carbides grew at grain boundaries during the reheating treatment at 1050 °C.
When the as-received material was directly treated at 1050 °C after the solution treatment at 1065 °C, carbon and boron diffused back to the grain boundaries since both were in solution in the matrix (this time the carbon atoms were not trapped in intragranular secondary carbides). But, unlike for the subsolvus material reheated supersolvus, almost no (Nb,Mo)2CrB2 boride
was observed at the grain boundaries after of the supersolvus treatment of the as-received material. This evidenced that the grain boundary boron segregation was much smaller in the case of the as-received material directly treated at 1050 °C than in the case of the material treated subsolvus and reheated at 1050 °C. Hence, in the former case, carbon is highly suspected to have hindered the diffusion of boron to the grain boundaries.
Intergranular borides could be beneficial for both the alloy processing and the alloy mechanical properties. Indeed, like the MC phase, the M3B2 phase has a solvus
temperature well above the d solvus (above 1200 °C according to Reference 36). Thus, like the MC carbides, the M3B2 precipitates could help control the alloy grain
size through grain boundary pinning in case high temperature forging operations or high temperature thermal treatments are required in the alloy processing. Regarding the mechanical properties, Xiao et al.[47] suggested that the intergranular borides could act as obstacles to the dislocation movement by empeding the dislocation slip, thus enhancing the fatigue crack growth resistance. On the other hand, Kontis et al.[42,48] con-cluded that it exists an optimal fraction of intergranular borides for the alloy properties. In fact, Kontis et al.[42] noticed that beyond a critical volume fraction of M3B5
borides at grain boundaries the creep properties start decreasing. Second, M5B3 borides seemed to have a
positive effect on the alloy oxidation properties because, unlike the M23C6 carbides, their presence at grain
boundaries does not lead to the formation of c¢ denuded zones during oxidation (the c¢ denuded zones are soft zones prone to early fracture).[48]But, at the same time, voids were also observed to initiate near intergranular M5B3borides during tensile tests.[48] Nevertheless, one
should keep in mind when thinking about the impact of intergranular borides on either the alloy process or the alloy mechanical properties that the distribution of the intergranular borides in the microstructure may be heterogeneous. In literature, several authors reported that the intergranular borides they found in nickel-based
IV. CONCLUSIONS
The present paper analyses some solid-state phase transformations occurring at the grain boundaries of a conventional cast-and-wrought superalloy Inconel 718. These phase transformations involved the precipitation of (Nb,Mo)2CrB2borides and (Nb,Ti)2CS carbosulfides,
which are usually phases rather associated to solidifica-tion phenomena than to solid-state phase precipitasolidifica-tion in superalloy Inconel 718. The main conclusions are the following:
– Intergranular (Nb,Mo)2CrB2borides were found to
precipitate in addition to the d phase when the as-received material was heated below the d solvus from room temperature. During the same subsolvus d treatment, intragranular secondary (Nb,Ti)C car-bides were also found to precipitate due to the amounts of carbon atoms and carbide former elements (here Nb and Ti) released in the matrix during the solution treatment performed before the material’s reception.
– The (Nb,Ti)2CS carbosulfides were observed at grain
boundaries when the material treated subsolvus d was reheated supersolvus d. The grain coarsening process which occurred during the solution treat-ment performed before the material’s reception was likely to be responsible for increased sulfur concen-trations at grain boundaries. Then, by releasing strong sulfide former elements (here Ti and Nb) in the grain boundaries, the dissolution of the d phase favored the precipitation of these needle-like (Nb,Ti)2CS carbosulfides.
– Reheating supersolvus d the material treated sub-solvus d also benefited the precipitation of inter-granular secondary (Nb,Ti)C carbides because the dissolution of the d and (Nb,Mo)2CrB2 phases
(partial dissolution in the case of (Nb,Mo)2CrB2)
led to high concentrations in carbide former ele-ments at grain boundaries. The migration to the grain boundaries of carbon atoms released in the matrix by the dissolution of the intragranular carbides was also suspected to benefit the intergran-ular carbide and carbosulfide precipitation.
– The precipitation of the (Nb,Mo)2CrB2 borides at
grain boundaries was very likely made possible by a decreased carbon activity induced by the precipita-tion of intragranular carbides during the subsolvus d treatment. Indeed, in case of high concentrations of solute carbon atoms, as was the case for the as-received material treated supersolvus d, almost no intergranular (Nb,Mo)2CrB2 boride was found,
and so carbon was highly suspected to have hindered boron diffusion.
ACKNOWLEDGMENTS
The authors thank the STAE foundation for the funding of the present study. They are also grateful to the staff of the UMS Raimond Castaing (Toulouse, France) who provided a precious support for the char-acterization of the microstructures. Finally, the authors are grateful to Pr. J. Lacaze who performed ThermoCalc calculations and recommended interesting papers from literature.
APPENDIX See Figures A1,A2andA3.
bFig. A1—SAED patterns acquired on the particle 1 of Fig.7. From (a) to (d): experimental diffraction pattern (left) and the corresponding diffraction pattern from the simulation (right). Simulated diffraction patterns were obtained using the CaRine software.[51] The simulation is based on the tetragonal structure P4/
mbm (space group number: 127) whose lattice parameters were set to a = 5.72 A˚ and c = 3.09 A˚.
Fig. A2—Stereographic projection of the tetragonal structure P4/mbm overlaid with the beam directions used for the SAED acquisitions. The SAED analyses were all performed on the particle 1 of Fig.7. The stereographic projection was drawn using the CaRine software[51](a = 5.72
A˚ and c = 3.09 A˚). It was approximately oriented so as to best fit with the acquisition frame. For each SAED acquisition, the electron beam direction is defined by the two tilt angles h1 and h2. The beam directions used for the four SAED patterns shown in Fig.A1are displayed in
red. The fifth direction displayed in blue correspond to another SAED pattern which was also consistently indexed with the tetragonal structure P4/mbm but which is not shown here for the sake of brevity (Color figure online).