UNIVERSITÉ DU QUÉBEC À MONTRÉAL
BIOINFORMATICS APPROACH FOR THE IDENTIFICATION OF FRAGILE REGIONS ON THE HUMAN GENOME
THESIS PRESENTED
AS PARTIAL REQUIREMENT OF THE MASTERS OF BIOLOGY
BY
GOLROKH KIANI
UNIVERSITÉ DU QUÉBEC À MONTRÉAL Service des bibliothèques
Avertissement
La diffusion de ce mémoire se fait dans le respect des droits de son auteur, qui a signé le formulaire Autorisation de reproduire et de diffuser un travail de recherche de cycles supérieurs (SDU-522 - Rév.01-2006). Cette autorisation stipule que «conformément à l'article 11 du Règlement no 8 des études de cycles supérieurs, [l'auteur] concède à l'Université du Québec à Montréal une licence non exclusive d'utilisation et de publication de la totalité ou d'une partie importante de [son] travail de recherche pour des fins pédagogiques et non commerciales. Plus précisément, [l'auteur] autorise l'Université du Québec à Montréal à reproduire, diffuser, prêter, distribuer ou vendre des copies de [son] travail de recherche à des fins non commerciales sur quelque support que ce soit, y compris l'Internet. Cette licence et cette autorisation n'entraînent pas une renonciation de [la] part [de l'auteur] à [ses] droits moraux ni à [ses] droits de propriété intellectuelle. Sauf entente contraire, [l'auteur] conserve la liberté de diffuser et de commercialiser ou non ce travail dont [il] possède un exemplaire.»
UNIVERSITÉ DU QUÉBEC À MONTRÉAL
APPROCHE BIOINFORMATIQUE POUR L'IDENTIFICATION DES RÉGIONS FRAGILES SUR LE GÉNOME HUMAIN
MÉMOIRE PRÉSENTÉ
COMME EXIGENCE PARTIELLE DE LA MAÎTRISE EN BIOLOGIE
PAR GOLROKH KIANI
DEDICATION AND ACK OWLEDGEMENTS
No research could be performed without the assistance and intellectual comrade-ship of many individuals. At the outset my appreciation goes to my supervisor, Dr. Abdoulaye Baniré Diallo. I admire him the most as my mentor, friend and a very respectful member of the society. I am honored to work under his supervision. His confidence in me pushed me the most through my years of working with him. He helped me to grow and to challenge myself in ways I never thought I could in my field of study. By his constant availability and day-to-day support he taught me how to figure out my problems and solve them.
I would like also to express my gratefulness to my co-adviser, Dr. Emmanuel Mongin, by whom this project has been initially inspired and he continued to guide and encourage me to the end and hopefully in future. He helped me through the study design, read and corrected my scripts.
I would like to express my warmest gratitude to Bruno Daiglc, as a good friend who I love and admire greatly. His patience and full-time technical assistance eased my way during this thesis.
I am profusely thankful to my good friend and colleague, Mohammed Amine Remita with whom I started this project in the first place. His love and support accompanied me all along to the end of this road.
I also take this opportunity to acknowledge Dr. Alix Boe as my helpful and patient teacher who also provided me with one of his programming script. So as Etienne Lord and Mickael Leclercq for their support and guidance since my first days at
lV
UQAM.
1 should as well mention all my classmates during my first year at UQAM and members of our laboratory who assisted me patiently with my French language problems, which accelerated my integration process in Canada. And of-course the friendly and hospitable environment of UQAM left me nothing but joyful memories from these years.
To my grandparents for their years of guidance and efForts during my whole life to whom I am greatly indebted for my personality and open-mindedness.
Finally, I would like to acknowledge my best friend in life, Rastin Azizbigloo, whose encouragements let me recognize and appreciate myself and my potentials like no one has ever done for me.
I dedicate this study to Mehrdad Aavani, Helen Lachini and Rastin Azizbigloo to whom I owe my life and my happiness. Without their presence the imagination of such achievement even seems to be impossible.
LIST OF FIGURES LIST OF TABLES . LIST OF ALGORITHMS ABSTRACT RÉSUMÉ .. CHAPTER I INTRODUCTION 1.1 INTRODUCTION TABLE OF CONTENTS lX Xlll xv XVll X lX 1 1
1.1.1 Genome organization in vertebrates . 2
1.1.2 Regions of vertebrate genome . . . . 5
1.1.3 Human genome organization . . . . . . . . . . . . . . . 6
1.1.4 Genome variation in human body 8
1.1.5 The Human Genome Project 9
1.1.6 Representation and storage of genomic data 9 1.2 Evolution . . . .. . . .
1.2.1 Mechanisms that drive evolution 1.2.2 Example of evolutionary scenarios . 1.2.3 Prediction of evolutionary scenarios . 1.2.4 Species tree vs. gene tree .
1.3 Genome Rearrangements . . .
1.3.1 Mechanisms of genomic rearrangements . 1.3.2 Characteristic of genomic rearrangements 1.3.3 Genome rearrangements and evolution ..
11 11 13 13 20 22 23 25 25
Vl
1.3.4 Association of evolutionary rearrangements with genome func-tions . . . .. .
1.3.5 Genome rearrangement and human diseases
1.3.6 Previously identified chromosomal fragility in human CHAPTER II
HYPOTHESIS AND OBJECTIVES 2.1 Hypothesis
2.2 Goal . . . 2.3 Objective
. . . . .
2.3.1 Identification of evolutionary synteny breaks on the human ge -27 28 31 33 33 34 34 nome. . . . . . . . . . . . . . . . . . . . . . . . . . . . . . . . 35 2.3.2 Identification of evolutionary fragile regions specifie to the
hu-man lineage . . . . . . . . . . . . . . . . . . . . . . . . 35 CHAPTER III
METHODOLOGY 37
3.1 Identification of evolutionary synteny breaks on human genome 39 3.1.1 Species sampling . . . .
3.1.2 Genome sequences information
3.1.3 Extraction of Multiple Sequence Alignment 3.1.4 Identification of synteny blocks
3 .1. 5 Phylogenetic analysis . . . . . .
3.1.6 Identification of synteny breaks (breakpoints)
3 .1. 7 Identification of breakpoints specifie to human lineage 3.2 Identification of fragile regions .. . ..
3.2.1 Association of genomic markers CHAPTER IV
RESULTS AND DISCUSSION
4.1 Extraction of synteny region on human chromosome 1 .
39 39 42 42 45 47 49 50 51 53 53
Vll
4.1.1 Association of genomic markers with synteny blocks . . . . . . 55 4.1.2 Inference of the evolutionary history of extracted synteny blocks 56 4.2 Extraction of synteny breaks . . . . . . . . . . . . . . . 60 4.2.1 Identification of breakpoints specifie to the human lineage 62 4.2.2 Association of genomic markers with breakpoints 63 4.3 Identification of fragile region on human chromosome 1 . 64 4.3.1 Association of genomic markers with each window frame 67 4.3.2 Robustness of the identified fragile regions . . . , . . 68
CONCLUSION ACRONYMS GLOSSARY. REFERENCES 77 80 82 85
LIST OF FIGURES
Figure Page
1.1 The structure of a nucleotide . . . . 2
1.2 The double helix structure of DNA 3
1.3 The solenoid model for the 30 nm chromatin fiber 3 1.4 DNA packaging in the nucleus . . . 4
1.5 Chromosome 1 stained by Giemsa stain . 5
1.6 Human karyotype 7
1.7 Mutation types 12
1.8 Example of an evolutionary scenario 14
1.9 Multiple Sequence Alignment . . . . 15
1.10 Prediction of an evolutionary scenario . 18
1.11 Comparative analysis . . . 19
1.12 Lowest Common Ancestor 20
1.13 Example of an evolutionary scenario of a gene during the speciation
of species carrying that gene 21
1.14 Species tree vs. gene tree . . 21
1.15 Common genome rearrangements 22
1.16 Genome rearrangement mechanisms . 24
1.17 Genome rearrangements in the course of evolution. 27 1.18 Genome fragile region vs synteny region 28 1.19 G-quadruplex structure on dsDNA . . 29
x
3.1 Complete pipeline . . . . . . . . . . . . . 38 3.2 Extracted species tree for the 12 selected species . 40 3.3 MAF file format . . . . . . . . . . .. 40 3.4 Extraction of alignment blocks for selected species 43
3.5 Synteny block extraction 45
3.6 Species phylogenetic tree 47
3. 7 RF topological distance . 48
3.8 Synteny and breakpoint extraction 49
3.9 Using Lowest Common Ancestor (LCA) algorithm to extract human-specific synteny breaks . . . . . . . . 50 3.10 Count of breakpoints in each sliding window 51
3.11 Marker association .. . . 52
4.1 Distribution of size of conserved blocks 54 4.2 Distribution of size of synteny blocks 54 4.3 Percentage contribution of each genome in extracted blocks . 56 4.4 Association of synteny blocks with the four selected genomic markers 58 4.5 Distribution of RF distances between species tree and inferred tree 59 4.6 Distribution of RF distance between corrected inferred trees and
species tree . . . . . . . . . 59
4.7 Micro-rearrangements phenomenons . 61
4.8 Distribution of size of synteny breaks 62 4.9 Distribution of breaks on the reference tree of species 63 4.10 Association of synteny breaks with the four selected genomic markers 64 4.11 Distribution of synteny breaks in sliding window of size 70 Kbp on
chromosome 1. . . . . . . . . . . . 65
4.13 Association of fragile regions with selected markers . 4.14 Visualization of the rare fragile site of chromosome 1
4.15 Visualization of overlaps of the most fragile regions with PAPPA2 gene . . . .
4.16 Comparison of identified conserved region
4.17 Gene On tolo gy (GO) based on biological pro cess . 4.18 Gene Ontology (GO) based on cellular coinponent 4.19 Gene Ontology (GO) based on molecular function
Xl 67 70 71 72 73 74 75
Table 1.1 LIST OF TABLES Example of biological databases .. Page
10
3.1 Information on genome assembly of the chosen species . 41 4.1 Contribution of each species in extracted blocks . . . . 57 4.2 List of genes associated with identified fragile regions and diseases 68LIST OF ALGORITHMS
3.1 Alignment block extraction. 3.2 Block fusion step . . . . . .
42 44
ABSTRACT
Evolution is emergence and disappearance of species traits due to small-scale mutations and genome rearrangements in favour of species fitness to their dynamic environment. Genome rearrangements happen when DNA breaks in two or more positions ( breakpoint) and reassembles in a different order. Comparative analyses of contemporary genomes have shown that several genomic regions have been resistant to any form of structural modification ( synteny regions). This could indicate the functional implication of th ose regions in survival and/ or reproduction of the species. Whereas the genomic regions that have been more subjected to rearrangements (fragile regions) could be for example, associated to traits that differentiate species. Our objective in this Master thesis 'wa.s to design and develop an approach to identify these fragile regions on human genome. Renee, we selected 11 well-sequenced vertebrates, 10 from different major superorders of mammalian tree of life and chicken as an outgroup. We then extracted the multiple sequence alignment (MSA) of the selected genomes from the MSA of 45 species against human genome a.vaila.ble on UCSC genome browser public site. Using comparative analysis and Lowest Common Ancestor method we have identified 33,424 human lineage specifie breaks on chromosome 1. With a sliding window approach on the chromosome 1, we computed the enrichment breakpoints of the regions· of chromosome 1. We identified 72 fragile regions of size 70 Kbp to 140 Kbp. These regions are a.ssocia.ted to genes known to be associated to disease. Finally, the developed approach will constitute an ideal framework to study the whole genome and then exploit the predictions in the study of the correlation between fragile regions and cancer associated rearrangements.
Keywords. breakpoint, synteny regions, rearrangements, comparative analysis, fragile regions.
RÉSUMÉ
L'évolution est l'émergence et la disparition des caractéristiques des espèces dues à des mutations à petite échelle et réarrangements génomiques en faveur de l'ada pta-tion des espèces à leur environnement dynamique. Les réarrangements génomiques se produisent lorsque l'ADN se casse en deux ou plusieurs positions (points de rupture) et se remonte dans un ordre différent. Des analyses comparatives de génomes contemporains ont montré que plusieurs régions génomiques ont été r é-sistantes à toute forme de modification structurelle (régions de synténic). Ce qui pourrait indiquer l'implication fonctionnelle de ces régions en matière de survie et/ou de reproduction de l'espèce. Considérant que les régions génomiques qui ont été plus soumises aux réarrangements (régions fragiles) pourraient être, par exemple, associées à des traits qui distinguent les espèces. Notre objectif dans ce mémoire de maîtrise est de concevoir et de développer une approche pour identi-fier ~es régions fragiles dans le génome humain. Par conséquent, nous avons sélec-tionné 11 vertébrés bien séquencés, 10 à partir de différents grands superordres de mammifères arbre de la vie et le poulet comme exogroupe. On a extrait ensuite l'alignement de séquences multiples (MSA) des génomes sélectionnés à partir de l'alignemenL multiple de séquences de 45 espèces contre le génome humain dispo-nibles sur le "UCSC genome browser". En utilisant une approche basé sur l'analyse comparative et la méthode du plus proche ancêtre commun, nous avons identifié 33,424 cassures de synténies sur le chromosome 1. Avec une approche de fenêtre coulissante passée sur le chromoso~e 1, nous avons calculé l'enrichissement des cassures de synténies sur les différentes régions du chromosome 1. Cela a permis d'identifier 72 régions fragiles de taille variant de 70 Kbp à 140 Kbp. Ces régions sont associées à des gènes connus pour être associés à plusieurs maladies. Enfin, l'approche développée constitue un cadre idéal pour étudier le génome complet, puis exploiter les prévisions de l'étude dans la corrélation entre les régions fragiles et les réarrangements associés au cancer.
Mots clés. points de rupture, régions de synténie, réarrangements, analyses com-paratives, régions fragiles.
CHAPTER I
INTRODUCTION
1.1 I TRODUCTION
Biological information needed for every living organism to survive and re pro-duce is encoded in its genome. The genomes of all organisms, except a group
of viruses, consist of a double stranded deoxyribonucleic acid (DNA). DNA is a linear polymer of a combin:ation of four types of a monomeric 'structure called
nucleotide. Each nucleotide is made up of three components : 1) a pentose sugar (2~deoxyribose), 2) a nitrogenous base (adenine, cytosine, guanine and thymine.
3) a phosphate group. These four nucleotides are as follows : Adenosine
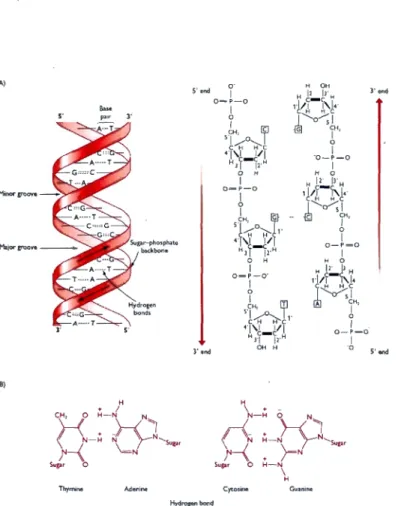
triphos-phate (dATP), Cytidine triphosphate (clCTP), Guanosine triphosphate (dGTP) and Thymidine triphosphate (dTTP), or when referring to a DNA sequence, A, C, G and T, respectively. See Figure 1.1. The double stranded DNA forms when two single-strandecl DNA molecules coil arouncl each other in opposite direction and hydrogen bonds-interactions pair the bases on the two strands (Base-pairing). These hydrogen bonds are specifically between an adenine on one strand and a thymine on the other strand, or between a cytosine and a guanine. The double
helix structure gives the DNA enough stability to protect genomic information.
Figure 1.2 shows the commonest structural conformation of the DNA double helix in living cells (B-conformation). In this conformation the DNA double helix is
2 about 2 nm or 20
 in diameter.
(A) A nuc.\eotide p. ·1 (8} The iour b~tcs. tl\ (»JA'
t
'
0 1 )~---·-c-;;';~N ,.c{ Il 1 '\f_-·C~~}CH -f 'J ..__c _....c,NH "c Il \'Y ___ .. ç, Qc., ~ N.y Nl-11Ademne(Al CYtosine(C) Guantne (G) Figure 1.1: 11
(A) The general structure of a deoxyribonucleotide, the type of nu
-cleotide found in DNA. (B) The four bases that occur in deoxyribonucleotides11 (Brown, 2002).
1.1.1 Genome organization in vertebrates
Genome size in vertebrates varies from 100Mb (mega bases pairs or millions of base pairs) to several Gb (giga base pairs or billions of base pairs) while human haploid genome size is "'3.08 Gb(Consortium et al., 2004b). The majority of geno-mic material in all vertebrates is enclosed in the nucleus by the nuclear membrane. This portion of the genome is called nuclear genome, and is divided in big seg-ments, which are wrapped around octamers of histone proteins. This structure is known as 'beads-on-a-string'. Each segment is coiled and compacted into 30 nm fibers called chromatin structure (DNA-histone complexes). See Figure 1.3. This 30 nm form is the most common form of the chromatin in the nucleus between each cell division cycle. Furthermore, during the cell division, the 30 nm structure coils and packs more and more (super coiling) to its most compact form, which would be visible under the light microscope in metaphase stage of cell division (Bernardi, 2005; Brown, 2002). This condensed structure is also known as chro
-3 (A) S'omd 3'o:nd Bm rond s· end (8)
Thymme Cytosme Guanine
Figure 1.2: "(A) Two representations of a DNA double helix. On the left the structure is shown with the sugar-phosphate 'backbones' of each polynucleo-tide drawn as a red ribbon with the base pairs in black. On the right the chemical structure of the sugar backbone for three base pairs is given. (B) A base-pairs with T, and G base-pairs with C. The bases are drawn in out-line, with the hydrogen bonding indicated by dotted lines. Note that each
G-e
base pair has three hydrogen bonds whereas an A-T base pair has just two. The structures in part (A) are redrawn from Turner et al. ( 1997) (le ft) and Strachan and Read (1999) (right) ." (Brown, 2002). The figure is taken from http://www.ncbi.nlm.nih.gov/books/NBK21134/30nm
Figure 1.3: "The solenoid model for the 30 nm chromatin fiber : The beads-on-a-string structure of chromatin is condensed by winding the nucleosomes into a helix with six nucleosomes per turn." (Brown, 2002).
4
mosome. Metaphase is the stage after the termination of DNA replication. Each
chromosome in this stage has two copies of a replicated DNA segment. The two copies are attached together at sorne place on the chromosome structure called
centromere (See Figure 1.4). Centromere on each chromosome has specifie
loca-tion. Thus, chromosomes could be distinctly identified by virtue of their size and the location of their centromeres. Chromosomes are also distinguishable in terms
Shortr~lonof t~~~~~~
I2om
ONAdoublehel!x 1!11'~~~~ 'Be•d•oo''";og'~
~Illnm
_
_,
__
,~ 3()-nmchromatin fibre of packed nucleosomes Section of chromosome in an extended form Condensee! section Entlremltotic chromos.ome~~
TOom
IOOomr~
I~·-Figure 1.4: The figure shows the steps in DNA packaging from a double stranded DNA to chromosome structure during the cell division. The figure is taken from : http://imgkid.com/nucleosome- structure.shtml
of the patterns of reaction to different staining methods. Any staining method results in a banding pattern, which is specifie to each chromosome. This is due to the non-homogeneous chemical nature of the genome. Figure 1.5 shows the hu-man chromosome 1 stained with Giemsa stain. Dark bands represent regions with higher A=T pairings as light bands represent C=G. Other than linear nuclear genome, mitochondria carry the rest of genome content in the form of a circular
5
a
Figure 1.5: a : Human chromosome 1 stained by Giemsa stain. It is ta-ken from : http://http://www.ncbi.nlrn.nih.gov/rnapview/rnaps. cgi?TAXID=9606&CHR=l&MAPS=ideogr[0.00:15100.00]. b : Human chromosome 1 ideogram. It is taken from: http://ghr.nlrn.nih.gov/ chrornosome/1
dsDNA. Mitochondria are the power house of the cells and their genome replicates independently from nuclear genome (Brown, 2002).
1.1.2 Regions of vertebrate genome
Other than the non-homogeneous chemical nature of the genome, as it is obser-vable in their reactions to stains in karyograms, genomic regions are not homoge-neous in terms of their functions either. Such unique differences could be used to categorize genomic regions. Genomic regions could be classified in the following groups :
- Coding : Codes for proteins and RNAs (Coding and noncoding genes) - Regulational : Regulates those coding regions (Promoters)
- Structural : Responsible for genome structure ( Centromeres and telo-meres)
6
Genes
Genes may be the most important part of the human genome as they carry
bio-logical information that code for biological molecules (polypeptide/protein and
RNA molecules). Most genes are expressed through an intermediate molecule,
called messenger or mRNA, which is transported outside the nucleus and will be
translated to specifie protein in the cytoplasm. Another group of genes are not
protein coding genes and they code for non-coding RN As, which play various roles
in the cell such as regulation (Brown, 2002).
Other genomic regions
- Pseudogenes : Genome is constantly subjected to changes and modifications.
One of the products of such modifications could be genes that have lost their functions. These non-functional genes are called Pseudogenes (Brown, 2002).
- Repetitive DNA : Repetitive DNA seems to be originated from transposable
element, which are DNA segments that jump from one place to another and leave a copy of themselves as they move (Brown, 2002). These repetitive segments are
known to have a higher rate of mutation and participa te in genome rearrangements
driving the evolution. Such rearrangements could modify gene regulation and
ex-pression without any modification in coding regions (Shapiro and von Sternberg,
2005). Also, it has be en shown th at modifications in repetitive regions could
af-fect chromatin formation which suggested their structural function in the genome
(Shapiro and von Sternberg, 2005).
1.1.3 Human genome organization
The size of human haploid nuclear genome is estimated to be around "'3.08 Gb.
7
two sex chromosomes, X and Y. (Brown, 2002). See Figure 1.6. The rest of the
human genome is stored in mitochondria. The mitochondrial is much smaller than
the nuclear genome. It has only 16 569 bp and contains 37 genes (Brown, 2002).
r•
..
..
.
e
13 14 15 16.
~ 19 20 21 22 • 1 10 11 17 xx 5 12 18 or XYFigure 1.6: 23 pairs of human chromosomes. This image is ta
-ken from http://education-portal .com/academy/l esson/
karyotype-definition-disorders-analysis.html#lesson
Coding regions in human genome
The human genome contains about 22,000 genes (Rosenbloom et al., 2013). Ho
-wever, only the functions of half of them are known or could be inferred. The
majority of human known genes have protein-coding function. Almost 25% of
these genes are responsible for expression, replication and maintenance of the ge
-nome. About 17.5% of the known genes are coding for enzymes responsible for
general biochemical functions. Another 20% of these genes are in a way involved
in pathways that regulate cellular activities in response to signais from outside of
8
Other genomic region in the human genome
It is estimated that about 25% of the human genome that lies between genes (intergenic regions) have no known function. These regions are previously called
junk DNA or gene deserts (Venter et al., 2001). But recent studies have shown that
sorne of these regions are carrying regulatory elements. These regions could not be eliminated without any phenotypic effects. This could indicate that such regions
harbor elements with critically important conserved biological roles. The review by Ovcharenko et al. (2005) shows that there are two categories of gene desert : stable and variable. Stable gene deserts have lower repeat density compared to
the gene-rich regions. This could suggest that these gene deserts are under a considerable degree of selective pressure (Ovcharenko et al., 2005). Furthermore, throughout vertebrate evolution, these non-coding stable regions maintain their
position and orientations (synteny) with respect to their neighboring genes. This could suggest the existence of an important linkage between these regions and their coding neighbors that could not be disturbed (Mongin, 2009).
1.1.4 Genome variation in human body
Most cells in a multi-cellular organism, such as human, are product of multiple divisions of one single cell (zygote),. However, we know that cells in each ind
i-vidual come in variety of shapes and sizes. This is the result of differences in gene expression and/or regulation so that each cell type could be specialized for
certain functions. Due to such specialization, different cell types have distinct sen
-sitivity and level of exposure to internaljexternal chemical or physical signals. For instance, alcohol consumption on cells in gastrointestinal (GI) tract and liver (P
e-lucchi et al., 2006), nicotine consumption on cells in respiratory tract, GI tract,
9
et al., 2001), nitrate in food preservatives on GI tract (Van Loon et al., 1998), urinary tract (Tazima et al., 1975) and liver cells (Van Loon et al., 1998) and narcotics could affect nervous system, liver and kidneys cells (Rivière et al., 2000) much easier than other cells in other tissues. Bence different cell types in different body organs could react to specifie signal distinctively as well as independently. This creates a diverse genome variety in the same individual. Diseases such as cancers, which are not inheritable, could manifest in just one single cell in an individual who has no other cell with such genome variation.
1.1.5 The Human Genome Project
The Human Genome Project (HGP) is an international collaboration, which be-gun in 1990 and was aimed to determine the nucleotide sequence of the entire "'3.08 Gb letters of the human haploid nuclear genome (Rosenbloom et al., 2013). Their goal is to provide researchers with powerful tools to understand the genetic factors in human diseases, which could help them to develop new strategies in their diagnosis, treatments and preventions. All information produced by the HGP are available in public databases. The HGP has already identified over 1800 genes related to different diseases. These data cnablcd researchers to develop more than 2000 tests for diseases and conditions caused by those genes. Such information could be used by health-care professionals in diagnosing the condition in early stages as well as in designing more efficient treatments (Institute, 2013).
1.1.6 Representation and storage of genomic data
Since Human Genome Project started, human genomic data became more and more abundant publicly. Biological databases store and maintain the different types of biological data around the world. Most of these databases represent their
10
data through interactive websites so they could be easily browsed, analyzed and re
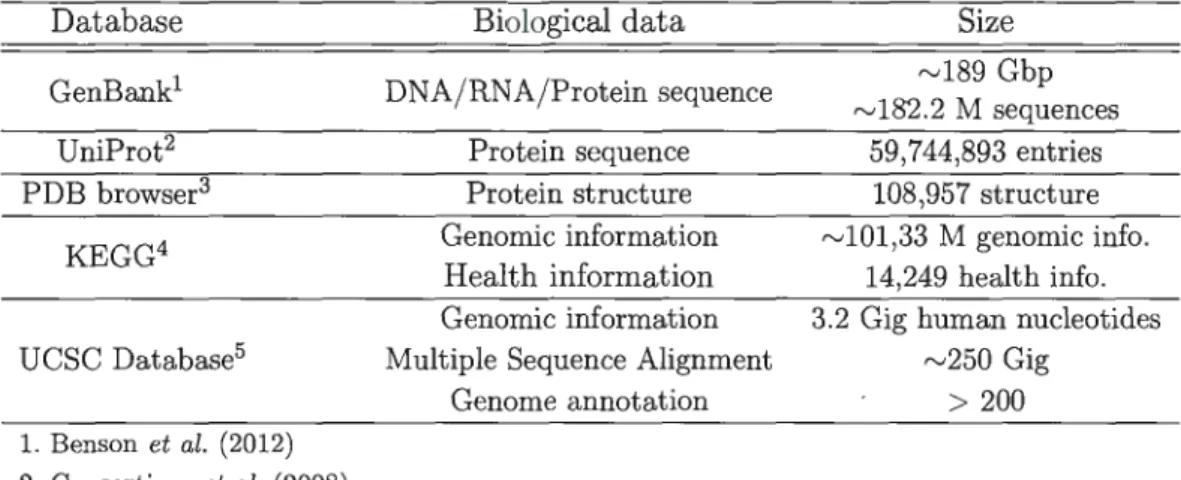
-trieved. Today biological information cornes in different formats. Sorne well-known biological databases are presented in Table 1.1. Among biological databases, UCSC
Data base Biological data Size
GenBank1 DNA/RNA/Protein sequence "'189 Gbp
"'182.2 M sequences
UniProt2 Protein sequence 59,744,893 entries
PDB browser3 Protein structure 108,957 structure
KEGG4 Genomic information "'101,33 M genomic info.
Health information 14,249 health info.
Genomic information 3.2 Gig human nucleotides UCSC Databasé Multiple Sequence Alignment "'250 Gig
Genome annotation > 200 1. Benson et al. (2012) 2. Consortium et al. (2008) 3. Berman et al. (2002) 4. Kanehisa et al. (2014) 5. Karolchik et al. (2003)
Table 1.1: Example of biological databases.
Genome Browser Database is one of the most popular biological databases. It pro-vides genomic sequence data, comparative data (Multiple Sequence Alignment), as well as graphical interface. UCSC genome browser is developed and maintained
by the Genome Bioinformatics Group, a cross-departmental team within the UC
Santa Cruz Genomics Institute and the Center for Biomolecular Science and
En-gineering (CBSE) at the University of California Santa Cruz (UCSC). The UCSC
Genome Browser provides genomic information on a variety of organisms from
yeast to higher mammalians. The information includes complete genome of 100 species, pairwise alignment of 78 species against human genome, full annotation
data on 67 vertebrates, multiple alignment of 99 species against human genome,
and more. The interactive site empowers users with a powerful visualization tool that allows them to visualize personalized information tracks on the human
ge-11
nome. It also provides users with tools such as liftOver (Hinrichs et al., 2006) that converts genome coordinates and genome annotation files between assemblies, and
phyloGif, which creates a gif image from the phylogenetic tree specification given.
Moreover it provides users with the source codes for sorne tools, freely and
down-loadable for academie, noncommercial, and personal uses (Karolchik et al., 2003).
1.2 Evolution
Evolution involves in the emergence and disappearance of traits and behaviors,
in favor of species fitness to their dynamic environments. Evolution is the result of gradual processes occurring at the genome level, which modifies the genomic
materials. Consequently, after a certain time, in two groups of the same species,
different traits and behaviours would emerge. Eventually, they could be classified as two distinct species (Blanchette, 2001). Not all genome modifications could
participate in the evolutionary process. Only those, that occur in the genome
of germline cells could be passed to the next generation; and most importantly, are in the favour of the species survival and fitness. Only in such case the given
modifications would be fixed into the genome.
1.2.1 Mechanisms that drive evolution
Genomic modifications could be induced by different exogenous as well as
endo-genous factors. Exogenous factors are those that cells receive from their environ-ments such as environmental toxins, radiations and toxic chemicals. Endogenous
factors, however, are factors that have no external source such as fiaws in
replica-tion machinery of the cells and recombination. These modifications accompanied
by environmental factors such as species migrations, competition over resources, climate change and diseases (natural selection) are the major forces driving evo
---
---·
--
--
--
--12 '
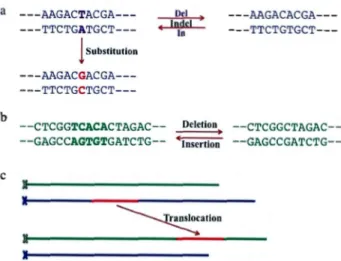
lution (Brown, 2002). These genomic modifications could be in three forms :
1- Point mutations : correspond to single nucleotide insertions, deletions or s
ub-stitutions by another nucleotide from one genomic sequence into another (Brown,
2002). Figure 1.7a illustrates the deletion of a T=A base-pair in the DNA se
-quence on the left or an insertion of the base-pair to the sequence on the left. Also, the conversion of the sequence on the left to the one beneath by replacement of
T=A base-pair with a C= G is an example of substitution point mutation.
2- Small-scale mutations : are modifications that affect a small number of nucleo
-tides such as deletion or insertion of a small DNA segment (Brown, 2002). Figure
1.7b shows the insertion or deletion of TCACA between the two DNA sequences. 3- Large-scale genome rearrangernents : are type of modifications that engage a large region on the chromosome and changes the genomic landscape. That could include translocat'ion, inversion of DNA segment and fusion or fission of two DNA
segments. Figure 1.7c shows one type of such modifications, which is the trans lo-cation of the region in red to somewhere along the green chromosome.
a ---AAGACTACGA ---TTCTGATGCT
---l
Substltulion ---AAGACGACGA ---TTCTGCTGCT ---Del > • Inde! ln ---AAGACACGA ---TTCTGTG CT---b--CTCGGTCACACTAGAC-- Deletion
--CTCGGCTAGAC----GAGCCAGTGTGATCTG-- Insertion
--GAGCCGATCTG--c
~
ation
Figure 1.7: Mutation types: a) Point mutation b) Small-scale mutation c) Large
- - -- -- - - -- - - ,
13
1.2.2 Example of evolutionary scenarios
The constant chçmging environment of all species along with the unstable nature of their genomes are the main forces that drive species diversity and evolution. For instance, as schematized in Figure 1.8, geographical separation of two groups of the same species (white population) in generation 0 could happen as a result of an
earthquake. This event has also separated two individuals with two new variations
(red and green). The red variant gives the individual the ability to produce and survive much easier than the others. If this population have enough resources, in just few generations they could overpopulate the down side of the valley. On the
other side of the valley, the green variant just slightly boosted the reproduction
ability. Renee, after about almost the same time as the red population, we could
observe that the green and white populations are both occupying the region almost equally. By accumulating such different modifications in a group of the same species during a long time (high number of generation), the members of that species could not be classified as a single species.
1.2.3 Prediction of evolutionary scenarios
Evolutionary relationship between species usually could be revealed by digging their relationship at the genomic level which is called phylogenetics (Brown, 2002). Using comparative analysis of the genomes or comparative genomics,
phylogenetic study could unveil the evolutionary scenarios that the genomes of contemporary species have been subjected to since a common ancestor (Hardison, 2003). One of the basic assumptions of comparative genomics is thefact that .a common phenotype in two given species are often encoded within the region that
is conserved between th ose species sin ce their common an ces tor. Su ch regions
-14
Figure 1.8: Example of an evolutionary scenario. Due to a geographical separation oftwo groups of the same species, two new variants (the green and the red variants) have been separated as well. As displayed in this figure, the red variant boosts the reproduction potential of the species therefore in just few generations they can overpopulate the down-side of the valley. On the other side the green variant affect slightly the reproduction of the species. At about the same time that species carrying the red caused their eosines go to the verge of extinction, species with
the green variant have co-occupied the upside of the valley, almost equally with
the original population. Therefore, studying individuals in the fourth generation, three different variation would be observed, which emanated from the original white variant.
production of those species (Hardison, 2003). Comparative genomics is a powerful approach for understanding the ancestral genome architecture and genomic rear-rangements scenarios during evolution by examining three main characteristics of contemporary genomes (Horvath et al., 2011) :a) DNA sequence conservation b) Genome function conservation c) Synteny conservation.
(a) DNA sequence conservation: One of the fundamental assumptions of compa-rative genomics is the fact that contemporary regions carrying highly similar (or identical) sequences might derive from a common ancestor irrespective of their evolutionary processes. To find the similarity between sequences,
se-15
quences have to be aligned together. Sequence alignments come in two for-mats : pairwise alignment, which.aligns two sequences together and finds
the corresponding characters on those sequences, multiple alignment (Fi
-gure 1.9), which is the extension of pairwise alignment to more than two
sequences. Aligning the genomic sequences is one of the core steps in
phy-logenetic analyses (Diallo, 2009). Several methods have been developed to
identify highly conserved genomic regions in a given Multiple Sequence
Ali-gnment (MSA) such as Mauve (Darling et al., 2004), PhyloP (Pollard et al.,
2010) and PhastCons (Siepel et al., 2005). These methods assign a conser
-vation score to each genomic region according to the number of nucleotide
identities, synonymous and non-synonymous substitutions, etc ...
a) Genomic sequences from 8 species:
Human TTCCTGTGGAGAGGAGCCATGCCTAGAGTGGGATGGGC Chimps TTCCTGTGGAGAGGAGCCATGCCTAGAGTGGGATGGGC Orangutan TTCCTGTGGAGAGGAGCCATGCCCAGAGTGGGAGGGGC Marmoset TTCCTGTGGAGAGGAGCCATGCCAGGGGTGGGATGGGC Cow CTCCTGTGGTGAGGACCCAGGCCCGGGGCGGTGGCAGGGGG Doq TTCCTGTGGTGAGAATCCGTGTCCAGGGTAGGC Elephant CTCTTGTGGTGAGTCTCCACGTCCAGGGTGGAACAAGC
b) Multiple Sequence Alignment of above gcnomic sequences:
Human TTCCTGTGGAGAGGAGCCATGCCTAGAG---TGGGATGGGC Chimps TTCCTGTGGAGAGGAGCCATGCCTAGAG---TGGGATGGGC Orangutan TTCCTGTGGAGAGGAGCCATGCCCAGAG---TGGGAGGGGC Marmoset TTCCTGTGGAGAGGAGCCATGCCAGGGG---TGGGATGGGC Cow CTCCTGTGGTGAGGACCCAGGCCCGGGGCGGTGGCAGGGGG
Doq TTCCTGTGGTGAGAATCCGTGTCCAGGG---TAGGC Elephant CTCTTGTGGTGAGTCTCCACGTCCAGGG---TGGAACAAGC
Figure 1.9: Multiple Sequence Alignment. a) Genomic sequences from 7 species.)
Multiple Sequence Alignment of those sequences in a.
(b) Functional conservation of genomic regions : During evolution, it is likely that
genes coding for functions that are essential for the survival of species conserve
from their last common ancestor. Moreover, to maintain the integrity of the
underlying functions of these genes, their regulating and controlling regions
should be conserved in the same manner. In contrast, regions that encode or
regulate proteins and RNAs responsible for species-specific traits might be
different (Hardison, 2003). Lack of information on functional elements and
16
Bowever, selective pressure and fitness maintain the sequence conservation of functional regions. Thus, they undergo a slower rate of sequence change through time (Ganley and Kobayashi, 2008). Yet, predicting the exact func-tion of those region remains a major challenge in computational biology (Bar
-dison, 2003).
( c) Synteny conservation : Genomes of distinct species do not share the same ar
-chitecture (gene or genomic segment organization). Bowever, species sharing more evolutionary history tend to share several regions in common. Bence, despite many modifications in the genome sequence and conformation during evolution, there are highly conserved regions in terms of their order integrity and their positions across the genome. As defined by Nadeau and Taylor (1984), any uninterrupted chromosomal region that is occupied by two or more gene (genomic region) in two (or more species) are called
"conser-ved segment" (Nadeau and Taylor, 1984) or "synteny block" (Pevzner
and Tesler, 2003a). This rigidity to rearrangement during evolution has been often associated to functional constraints of genomic region. Studies on the genome synteny have shown that conserved regions are not only significantly enriched in putative regulatory regions (Mongin et al., 2011; Kikuta et al.,
2007) but also are associated with transcriptional regulations and develop-mental processes (Mongin et al., 2011; Sandelin et al., 2004; Woolfe et al.,
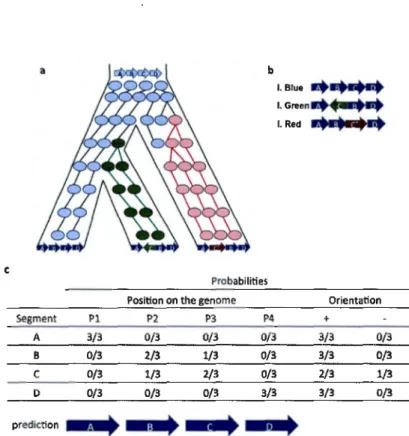
2004). For instance, if we go back to the example of the evolutionary scenario explained in Figure 1.8 at the time of generation 4, the only data available is the three groups of species in both sides of the valley. To infer the evolu-tionary scenario that could explain the origin of the three similar species, we have to run a comparative analysis on their genome sequences. The multiple alignment of their genomes would highlight most of their genomic regions as conserved among the three species. The only region that shows variation among the three groups is a region with four homologous segments as shown
~
-
--17
in Figure l.lüb. It shows that in all the species segments A and D have the same position, orientation and sequence homology. On the other band, block
C shows a sequence con-servation in the first two species (blue and green)
with two different orientations (loss of synteny conservation). Also the same
block, C, in the species in red has the same orientation as species in white with less sequence similarity with the other two species. This shows that in 2/3 of species block C is located between B and D and in 2/3 the orientation of C is positive. The suit help us infer their ancestral genome architecture as
18 c Segment Pl A 3/3 B 0/3 c 0/3 D 0/3 prediction
mr
~
b Probabilities Position on the genomeP2 P3 P4 0/3 0/3 0/3 2/3 1/3 0/3 1/3 2/3 0/3 0/3 0/3 3/3
-~
~
-
~
-·
!.Blue . . . I.Greenw++ - + - + !.Red . . . Orientation + 3/3 0/3 3/3 0/3 2/3 1/3 3/3 0/3~
Figure 1.10: Prediction of an evolutionary scenario : This simplified example shows
the prediction process Qf an evolutionary scenario from contemporary genomes. a) Shows the real evolutionary scenario of a segment of the genome presented in three contemporary species. b) Shows the original conformation of the genome of
these three species with respect to 4 homologous segments/regions/blocksjgenes
presented in all species. In all species A and D, are located on the same position.
In 2/3 of species C is located between B and D. In 2/3 of species, segment C
has a positive orientation (blue and red species). Segment C has the exact same
sequence in blue and green species but shows less homology in the red species.
The suit helps to infer the ancestral genome architecture as demonstrated in c.
Studies in comparative genomics are often based on a direct analysis of multiple
sequence alignments and their underlying phylogenies (Siepel et al., 2005; Darai
-Ramqvist et al., 2008; Ma, 2011). From a MSA, phylogenetic analysis would enable
us to construct the evolutionary relationships, or genealogies among compared
organisms. It also presents the historical course of their speciation through an
arborescent format so-called phylogenetic tree (Wiley and Lieberman, 2011) as
a
Human Chimps
TTCCTGTGGAGAGGAGCCATGCCTAGAG---TGGGATGGGC TTCCTGTGGAGAGGAGCCATGCCTAGAG---TGGGATGGGC Orangutan TTCCTGTGGAGAGGAGCCATGCCCAGAG---TGGGAGGGGC
Marmoset TTCCTGTGGAGAGGAGCCATGCCAGGGG---TGGGATGGGC Cow CTCCTGT.GGTGAGGACCCAGGCCCGGGGCGGTGGCAGGGGG Dog TTCCTGTGGTGAGAATCCGTGTCCAGGG---TAGGC Elephant CTCTTGTGGTGAGTCTCCACGTCCAGGG---TGGAACAAGC
b
4 - Placental mammal Basewise conservation Dy PhyloP
e-
.
•
--- ....
• • a aT - aw ~r-4 - Multiz Align.ments ot 46 vertebrates
C H~~~~ TTCCTGTGGF\GRGGRGCCRTGCCTRGRG~GGGATGGGCC
r---4~ Ch ;mp TTCCTGTOGRGRGGRGCCfHGCCTRGRGTGOGRTGGGCC
~ Orangutan TTCCTGTOGRGRGGRGCCRTGCCCRGRGTGOGAGGGGCC
Cow CTCCTGTGGTGRGGACCCRGGCCCGGGGII'GGCRGGGGGC
- - - - Oog TTCCTGTGGTGAGAATCCGTGTCCRGGG- -- - -TAGGCC
Ele-phant CTCTTGTGGTGRGTCTCCRCGTCCRGGGTGGAACARGC=
19
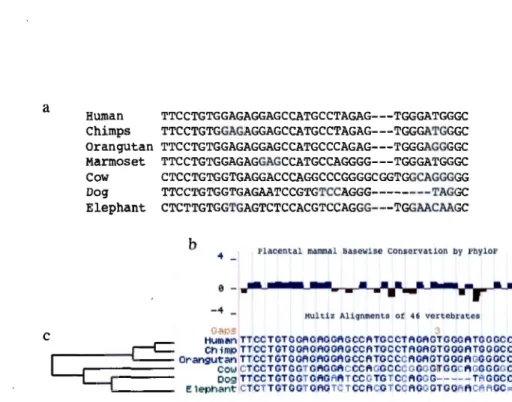
Figure 1.11: Comparative genomics. a) Multiple sequence alignment. b) MSA of a conserved region of 5 mammals genome sequences against the human genome and the corresponding conservation track from UCSC genome browser. c) Inferred phylogenetic tree based on the above alignment block.
Having phylogenetic data, we could trace back a specifie phenotype and/ or geno-type to the point in time that it originated. This would be possible by using a mathematical algorithm in graph theory called the Lowest Common Ancestor
(LCA). Given a rooted tree T, node x E T is an ancestor of node y E T if the
path from x to the root, passes through x. Also, a node v E T is called to be a
common ancestor of x and y if it is an ancestor of both. The Lowest Common Ancestor (LCA) of two nodes of x and y is a node whose distance to the x and y
is shorter than any of their common ancestors in that tree. In any tree, the root
is the common ancestor of all nodes (Moufatich, 2008). For example, in the tree in Figure 1.12, the LCA of the two nodes,
4
and 6, is the node 1.20
Figure 1.12: The Lowest Common Ancestor (LCA) of two nodes of 4 and 6 is a
node whose distance to the 4 and 6 is shorter than any of their common ancestors
in that tree. The ancestors o( the nodes 4 and 6, sorted by distance are 2, 1, 0
and 1, 0 respectively. Therefore the least common ancestor of these two nades is
the node 1.
1.2.4 Species tree vs. gene tree
Species tree is a phylogenetic tree constructed based on comparative analyses of
species and their evolutionary relationship. The species tree represents the evol u-tionary pathways and processes that those species have gone through in general. In contrast, the gene tree is a phylogenetic tree that shows the evolutionary history of a gene or a genomic sequence in different genomes or within a single genome.
It is now well-known that the gene trée does not always agree with the species
tree (Brown, 2002). Pro cesses such as duplication of a genomic region, Horizon
-tal Gene Transfer, and gene loss could cause su ch a discordance between the two
trees. For instance in Figure 1.13 a gene duplication has happened in time Ti.
Sorne time after the speciation, in each two new groups of species, one copy has
been lost. And finally, around the time T3 another duplication has occurred in
the species group carrying the original gene copy. The phylogeny of the species
highlights the evolutionary processes of their speciation due to accumulation of
genomic modifications in time accompanied by environmental changes and na
-tural selection. For example, the phylogeny of species in Figure 1.13 would be
21
Ti mc
+---- -- Duplication
+---- - - Spcciation
, . . _ _ Duplication
Figure 1.13: Example of an evolutionary scenario of a gene during the speciation of
species carrying that gene. This figure shows that somewhere beforc the speciation
a duplication has happened. Each new species received both copies of that gene.
But farther away after the speciation, each species lost one of their copies. Going down in time, another duplication has happened in an ancestor of SpcJI. The
result of these processes was three homologous copies of this gene in contemporary
species, one copy in Spcl and two copies in SpcJI.
those môdifications is depicted by the gene tree in Figure 1.14.a. One can easily
recognize the disagreement between these two trees. This is a simple example of discordances between species tree and gene tree.
b GcncX
GcncXI GcncXII.., GcncXII,,
Specles trec Gene trec
Figure 1.14: a and b, represent the species tree and gene tree, inferred by the
comparative analysis of the contemporary species in figure 1.13, respectively. As demonstrated in this figure, the duplication of the GeneX happened before the
speciation event. The second duplication of the same allele happened within the
Spcii, which is the source of the topological difference between the species tree
22
1.3 Genome Rearrangements
Genome rearrangements are considered as evolutionary earthquakes and tend to
dramatically change the genomic landscape (Peng et al., 2006). Over time, new
traits appear in favor of species fitness to their environments (Mongin, 2009).
Genome rearrangements, such as deletion, duplication or translocation of a DNA
segment, happen when double-stranded DNA breaks at two or more locations (breakpoints) and merge at different locations during DNA replication. This
re-sults in a distinct genome conformation from the original one (Blanchette, 2001)
as shown in Figure 1.15. Previous studies have shown that such rearrangements do
T2
Tl
T2
Figure 1.15: Common genome rearrangements: Rearrangements occurred passing
from time Tl to T2 in fragile regions and have changed completely the original size
and conformation of those regions. Gray arrows demonstrate regions resistant to rearrangements ( refractory regions), which keep the ir synteny ( order and content) during evolution.
not occur randomly across the genome. During genome evolution, certain regions
have kept their synteny (refractory regions (Mongin, 2009)), whereas others have been more subjected to rearrangement (fragile regions). These regions are
not distributed randomly across genomes (Peng et al., 2006; Lemaitre et al., 2009; Pevzner and Tesler, 2003c). Any rearrangements in fragile regions could be just
damaging without any effect on the survival or breading of the species, such as sorne subtelomeric rearrangements (Hengstschliiger et al., 2005). They could be
23
even in favor of fitness, such as rearrangements in immunoglobulin genes (Maizels,
2005). Genomic regions could also be very rigid (so-called breakpoint-refractory
regions). Rearrangements in th ose regions are expected to be deleterious and could
not be fixed in the genome (Mongin et al., 2009). Such regions are mostly carrying
developmental genes or regulatory elements responsible for their regulation (Mon
-gin et al., 2011; Sandelin et al., 2004; Woolfe et al., 2004). The heterogeneity in
the distribution of synteny breaks across genomes could be due to less functional
pressure on the different regions and thus less resistant to rearrangement (Mangin,
2009; Ciccarelli et al., 2005).
1.3.1 Mechanisms of genomic rearrangements
Large-scale genomic rearrangements could be due to three major mechanisms :
- Non-Allelic Homologous Recombination (NAHR) : is a genomic
re-combination between products of a segmentai duplication also known as
Low Copy Repeat (LCR). It appears in cell division and is due to a misa
li-gnment in crossover between two non-allelic homologous regions, instead of
two allelic regions. NAHR could lead to a deletion, inversion, duplication
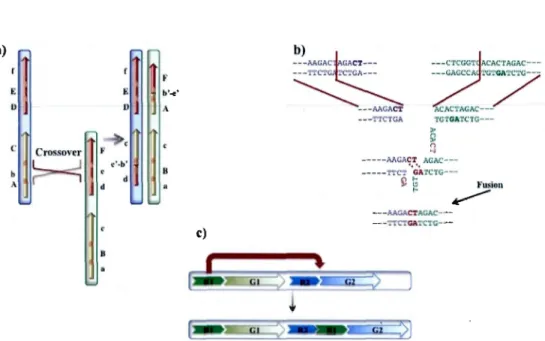
or translocation of DNA segments (Gu et al., 2008). See Figure 1.16, a.
This mechanism plays a major role in DNA repair and genome evolution
by producing allelic variations (Gu et al., 2008; Ban§ et al., 2013a).
Non-homologous end joining (NHEJ) : is a repair mechanism in DNA
double strand breakage. This mechanism also known as nonhomologous re-·
combination that necessitates little or no homology to join two free DNA
ends together (Moore and Haber, 1996). See Figure 1.16, b. It generally
causes variation of genetic materials (Ban§ et al., 2013a). A study has
24
a)
E Il
were consistent with faulty NHEJ repairs (Raphael et al., 2008).
Retrotranspositions or mobile element insertions (MEis) : are mo -bile genetic elements spread throughout genome by 'copy-and-paste'
me-chanism. In this process, DNA segments jump from one place to another and leave a copy of themselves as they move (Brown, 2002). It could alter the number of copy of that segment in the genome or Copy Number Va-riation (CNV). See Figure 1.16, c. The mechanism involved in MEl, is me-diated by LIN Es (long interspersed nucleotide elements), SIN Es (short
in-terspersed nucleotide elements) and retrovirus infections (Kazazian, 2004).
E Il F b'-~· 8 c) b) ---A.l\G.r...c• 'GACT-- --- -1"fC'l'G' !'C1'CA
---~
---
AA
G
P.
CT
---'M'C"l'GA ---GAGCCA. 'l'G'l'GA 'l'C'l'G---ACAC"tAGAC--7 1'GTGA'l'C 'l'G- --5
" ... -----A.l\G.P.CT AGAC-- -•.•, - - - - -'l''fC'!' GA'L'C'l'G-- -~ t..
---;..AGACTACAC- ----·r-rc'l"GA'l"C'fG---Figure 1.16: Genome rearrangement mechanisms. a) Non-allelic homologous re
-combination (NAHR) : A misalignment in crossover between two non-allelic ho-mologous regions, instead of two allelic regions. b) Non-homologous end joining
(NHEJ) : Double strand DNA breakage in two different chromosome regions and reassemble in new fashion. c) Retrotransposition or mobile element insertions
(MEis) : A transposable element, R1 that transposed between R2 and G2 and left a copy of itself as well.
25
1.3.2 Characteristic of genomic rearrangements
Studies have shown that synteny breaks are more frequent in regions carrying
specifie markers such as GC-rich (Lemaitre et al., 2009; Darai-Ramqvist et al.,
2008), segmentai duplication (Darai-Ramqvist et al., 2008; Carbone et al., 2009; Bailey et al., 2003) and simple repeats (De and Michor, 2011; Carbone et al., 2009). CpG islands are regions with lengths greater than 200 bp containing over 50% GC. They are more presented in or proximate to regulatory regions and are involved
in gene regulation by obstructing the transcriptional factors (Larsen et al., 1992;
Wang and Leung, 2004). CpG methylations has shown to be more susceptible
to rearrangements (Lemaitre et al., 2009; De and Michor, 2011; Carbone et al., 2009). DNA secondary structure such as G-quadruplex has also been shown to be mutagenic by obstructing the replication machinery (Kruisselbrink et al., 2008;
Pontier et al., 2009; De and Michor, 2011). Regions enriched in arrangement sites
essentially contain adaptive genes such as genes associated with infiammatory
response and muscle contractility (Larkin et al., 2009).
1.3.3 Genome rearrangements and evolution
Mutations and large-scale rearrangements empower genome with a particular dy-·
namism by virtue of which species could cope with their constantly changing
environment, survive natural selection and maintain their fitness. Genome rear
-rangements have mostly deleterious effects as they could cause loss or modification of traits that are crucial to the species survival and reproduction capacity. Ho-wever, these modifications occasionally cause modifications that are in favor of
species fitness and would undergo a positive selection and be fixed in the genome.
This is the major force that drives species diversity and evolution (Brown, 2002;
- - - -- - - -~
---26
example of such rearrangements in genomic region in red in few generation. In this example, the red genomic region (the red black) is duplicated in one of the
descendants of A (Bi). Then in the next generation the duplicated segment is lost
partially in the next generation (Cl). At the same time the very same segment
moves to another position (translocation) in C2. On the other hand, the other
descendant of the A (B2), the red black stays conserved. Furthermore, in the next
generation, this segment goes through an inversion in just one descendant of B2
( C3). Such genome rearrangements in germ-line cell that pass to next generations
would change the original genome conformation slowly such that two groups of
the same species would diverge enough to be recognized as two close but different
species ( speciation processes) (Blanchet te, 2001). M urphy et al. categorized these
rearrangements into four different categories : 1) lineage-specific : are th ose rear
-rangements that found only in one species. 2) order-specific : are those that overlap
between species of the same order. 3) super-ordinal : are those that happen in all
representatives of a super-ordinal clade. 4) reuse : are the rearrangements that occur in the same region in species on different branches of species tree (Murphy
et al., 2005). Genome rearrangements could be recognized only by comparison of
at least two different genomes (Sankoff, 2009). Regions that are more susceptible to synteny breaks ( rearrangements) during evolution are so called 11 rearrange
-ment hotspots" or "fragile regions" (Peng et al.,· 2006). Figure 1.18 shows two
different genomic regions on the human chromosome 1 from UCSC genome brow
-ser (Karolchik et al., 2003) conservation track. Both of these regions are shared among 6 other mammals and chicken. As can be seen in this figure, these two regions show different levels of conservation. In the figure below the region, syn-teny region shows a very high conservation between all species even in chicken.
Whereas the region above, a fragile region, has a very weak conservation in all
27
Figure 1.17: Genome rearrangements in the course of evolution. The red black rea r-ranged in few generations and modified the original conformation of that specifie
region in different contemporary genomes.
1.3.4 Association of evolutionary rearrangements with genome functions
Genome rearrangements could have three kinds of effects on genome in terms of
functionality :
i. Rearrangements which are not in favor of the species fitness to the environment are deleterious and will be lost in time (Blanchette, 2001). One good example could be the 1p36 deletion syndrome. The syndrome is caused by a deletion in the
short arm of chromosome 1. Sorne symptoms of this particular deletion include
intellectual disability, distinctive facial features, and structural abnormalities in several body systems. This means that individuals carrying this rearrangement have much lesser chance to survive and reproduce.
ii. Rearrangements that could create new functions and lessen the selective constraints will be fixed in genome (Ciccarelli et al., 2005). Such as DRD4 7-repeat allele, originated about 40,000 years ago showed a higher proportion in migratory po-pulations (Chen et al., 1999). This gene is also known as novelty seeking gene. Children diagnosed with Attention deficit hyperactivity disorder (ADHD) was
28 ~ Fragile region: Chimp Orfllf\o9Ut".t~n ~lOUS,._ Rat """ ooo ~SSUI' C!\ickert -_----=----=-: ~~- y~ -~
-
1
-
_J: f-~--
---
-
--· ~=-- _:3- :~-l-~ Synteny conserved region
ChilnP or.angutan Mouso ••t <ow l!oO 01)0Ssu«< Chic ken - - - -- - - -
-:::
Il
1
:
~- -
---~-~~~~_--
--
- - -~ ~---~ ~ :::tl_::r.::_~~ ~=--=---=--==-=--====-==----Figure 1.18: Example of conservation track on UCSC genome browser for two geno -mic regions of equal sizes on the human chromosome 1 with diflerent conservation
levels among 7 other vertebrates. Fragile region above shows week conservation
between compared species whereas the synteny region below is almost conser
-ved between all the species and shows a complete conservation with respect to
primates.
not be favorable in today's complex societies but it was an advantage for those of our ancestors who left Africa 50,000 years ago.
iii. Rearrangements happening in non-functional regions could stay, change or be lost in time and could have no eflect on individuals or on species fitness (Blan
-chette, 2001). Rearrangements in intronic regions are generally of those kinds.
1.3.5 Genome rearrangement and human diseases
Unlike evolutionary rearrangements that occur in germline cells, genomic
rearran-gements in somatic cells have an immediate eflect on the very same individual
and could not be passed to oflspring. The eflect of such rearrangements could
vary from a complete loss of a DNA region to sometimes hundreds of copies of a
DNA fragment (Stratton et al., 2009). Somatic rearrangements could alter genes and gene regulation causing a variety of diseases and disorders in human. For instance, apposing a gene to the regulatory elements of another gene (Santoro
29
into loss, gain or modification of a protein function) involved in cell growth and
proliferation (Rowley, 2001) could cause an uncontrollable cell division and growth leading to cancers (Fu treal et al., 2004; GoUin, 2005). For example, a deletion
in-volving the HBA1 and HBA2 genes located on chromosome 11 (11p15.5) causes
a.-thalassemia. Fusion of TMPRSS2 and ETS transcription factor genes in prostate
cancer is another example of such rearrangements (Tomlins et al., 2005). Other than exogenous factors ( e.g. nicotine, chemical hair dyes and UV exp os ure), sorne -times DNA adopts non-B conformations. This destabilizes and damages the DNA. For example it has been shown previously that Guanine-rich genomic regions can
adopt a four-stranded DNA structure (G-quadruplex/G4). See Figure 1.19. This structure plays a key role in genomic alterations observed in cancer genomes (De
and Michor, 2011).
Figure 1.19: G-quadruplex structure on dsDNA. The image is taken and mo-.
dified from : http: 1 /biologicalexceptions. blogspot. ca/20 13/101
dna-is-as-easy-as-b-z.html
Genomic rearrangements in cancer
Cancers may be triggered by accumulation of mutations and genome rearrange -ments in somatic cells which alter cell division and growth. Somatic Copy Num-ber Alterations (SCNA) are extremely common in cancer (Baudis, 2007; Stephens et al., 2009; De and Michor, 2011; Zack et al., 2013). SCNA are genome altera
-tions that cause an abnormal number of copies of one or more DNA segments
no-30
mie markers are known to be associated with cancer genome alterations, such
as G4 structures by obstructing the movements of DNA polymerase (Sun and
Hurley, 2010), CpG methylation (Behe and Felsenfeld, 1981; Vargason and Ho,
2002), and repeat elements (Hanahan and Weinberg, 2000). Moreover, a recent
study has shown a significant presence of G4 structure proximate to translocation
breakpoints in lymphoid genome (Katapadi et al., 2012). Epigenetic factors such
as modifications in DNA methylation and histone acetylation are other key role
-players in human carcinogenesis (Kanai, 2010; Archer and Hodint, 1999; Feinberg
and Tycko, 2004). The other phenomenon involved in rearrangements of cancer
cells is injection of an alien DNA in genome through sorne viral infections such
as Human Papilloma Virus (HPV), Epstein-Barr Virus (EBV) and Hepatitis B
Virus (HBV) (Stratton et al., 2009; Talbot and Crawford, 2004).
Cancer vs. evolutionary rearrangements
Genome instability and rearrangement mechanisms in both cancer associated and
evolutionary rearrangements are driven by the same mechanisms. Somatic rea
r-rangements have immediate cffects in the individual whereas rearrangements in
germline cells could pass to the next generations and participate in evolutionary
processes. In a comparative analysis of the human genome with 6 non-primate
species, performed by Murphy et al. (2005), evolutionary scenarios of rea
rran-gements between all species and their ancestors have been reconstructed. 367
evolutionary breakpoints have been identified. Comparing these data with cance
r-associated breakpoints has shown that distribution of the cancer-common chro
-mosomal rearrangements are three times more frequent than those of the less
common, proximal or within evolutionary breakpoints. Furthermore, the results
showed a complete absence of cancer-associated breakpoints within the three
31
the colocalization of evolutionary fragile regions with tumor-associated deletions
in human chromosome 3·(Kost-Alimova et al., 2003; Darai et al., 2005). In 2008,
Darai-Ramqvist and his team conducted a comparative genomic analysis on three
mammals, a primate and a lower vertebrate genome against human chromosome
3. They found out that tumor break-prone segmentai duplications share sequence
features with sorne genomic fragile regions. Other than physical proximity, they
share CG content, presence of gene clusters associated with diversity and spe
-ciation, satellite repeats, transposable elements, and evolutionary history. They
identified two tumor-related breakpoints on chromosome 3, presented disting
ui-shed tumor break-prone segmentai duplications (TBSDs), which have also been
involved in recent evolution of primates. It has been also noted that regions ca
r-rying TBSDs were broken more frequently during mammalian evolution than a
random region on the same or other chromosomes (Darai-Ramqvist et al., 2008).
1.3.6 Previously identified chromosomal fragility in human
Fragile regions (fragile sites) are cytogenetically defined as genomic regions that
are more prone to break during the cell division (metaphase) causing partial
inhi-bition of DNA synthesis. The chromosomal fragility is visible in metaphase c
hro-mosomes as gaps, breaks or poor staining in cell cultures under certain chemical
stress (Durkin and Glover, 2007; Lukusa and Fryns, 2008; Mrasek et al., 2010;
Savelyeva and Brueckner, 2014). So far, over 200 fragile sites are identified on
human genome (Mrasek et al., 2010). Majority of these sites are common in all·
normal chromosomes in every individual. Such regions are called Common Fragile
Sites (CFS). CFS are mostly induced by aphidicolin (DNA-polymerases o: and
5 specifie inhibitor). The other CFS induce by synthetic nucleotides analogues,
bromodeoxyuridine (thymidine analogue) and 5-azacytidin ( cytidine analogue)