Sand/dust storms over Northeast Asia and associated large-scale circulations in spring 2006
24
0
0
Texte intégral
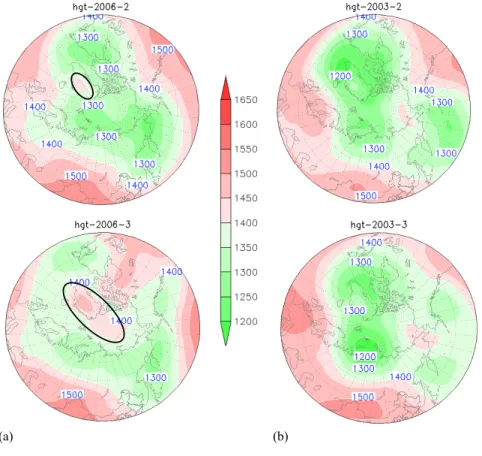
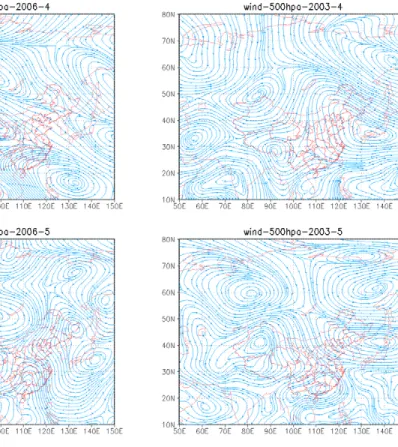
Figure

Documents relatifs