Éthique et économique/Ethics and Economics, 14 (2), 2017 http://ethique-economique.net/
BY/PAR
P
HILIPPEA
DAIR(1)
&
O
KSANAN
EZHYVENKO(2)
(1) ERUDITE, Université Paris-Est Créteil (UPEC). Email: adair@u-pec.fr
(2)
ERUDITE, UPEC and National University of Kyiv-Mohyla Academy (NaUKMA). Email oksana.nezhyvenko@gmail.comA
BSTRACTProstitution regimes in the EU-28 include prohibition, regulation and abolition; we tackle this typology from the perspective of both free sex work and forced labour, in order to gauge the magnitude of the European sex market as of 2010. We document the behaviour of customers on the demand-side for prostitution. Next, we address the supply-side, using HIV prevalence among sex workers to achieve a first series of two estimates. We design a second series of two estimates from miscellaneous sources (NGOS and the police). We investigate forced sexual labour trafficking, providing an additional series of estimates from the ILO and from Eurostat and UNODC. We check the magnitude of prostitution as regards employment figures and ranking with respect to the distribution of population in the EU countries. Thanks to an ordered probit, we test all five estimates; eventually, we come up with one best estimate (from HIV prevalence) that is also the lowest one. Keywords: European Union, informal employment, ordered probit, prostitution, sex work, victims of sexual exploitation trafficking
R
ESUMELes régimes de prostitution dans l'UE-28 recouvrent la prohibition, la réglementation et l'abolition; Nous abordons cette typologie du point de vue du travail sexuel non contraint et du travail forcé, afin de mesurer l'ampleur du marché du sexe européen en 2010. Nous documentons le comportement des clients du côté de la demande pour la prostitution. Ensuite, nous abordons le côté de l'offre, en utilisant la prévalence du VIH parmi les travailleurs du sexe pour obtenir une première série de deux estimations. Nous élaborons une deuxième série de deux estimations provenant de sources diverses (ONG et la police). Nous analysons le trafic de main-d'œuvre sexuelle forcée, qui fournit une série supplémentaire d'estimations issues de l'OIT et d'Eurostat et de l’UNODC. Nous contrôlons l'ampleur de la prostitution au regard des chiffres de l'emploi et du classement par rapport à la répartition de la population dans les pays de l'UE. Grâce à un probit ordonné, nous testons les cinq estimations; Finalement, nous aboutissons à l’estimation la plus robuste (résultant de la prévalence du VIH) qui est aussi la plus faible.
Mots clés : emploi informel, probit ordonné, prostitution, travail du sexe, Union Européenne, victimes du trafic d’exploitation sexuelle
117
1.
I
NTRODUCTIONProstitution, the controversial so-called “most ancient profession in the world” (Kipling, 1888), raises moral and economic issues such as social stigma, health risks and tax evasion. These issues echo the doctrines of philosophers and economists (Mandeville, Malthus, Lecky, Stuart Mill, Molinari and Guyot), which inspired current legislation regarding prostitution in the European Union (EU-28). Promoting the abolition of prostitution (Charpenel, 2013) confronts advocacy for laissez-faire (Hakim, 2015).
Prostitution is back again on the agenda: the EU political arena (Mendez Bota, 2014; Schulze, 2014) discussed the issue, which also deserves special attention from Eurostat since illegal production and namely prostitution is included into the national accounts since 2010. Strangely enough, no assessment has been yet applied to varied expert calculations. It is our purpose to bridge the gap and provide a tentative benchmark for the EU-28, wherein three different policy regimes rule prostitution: prohibition, regulation and abolition, albeit all regimes ban human trafficking for sexual exploitation
As for prohibition, prostitution is illegal, a criminal offence, and the prostitutes are liable to penalties in four EU Member States: Croatia, Lithuania, Malta and Romania (until decriminalisation in 2013), which account for 1.63 percent of EU GDP and 5.5 percent of total population in 2010.
As for regulation, in line with Mandeville (1724), prostitution in brothels is a legal trade, including tax collection from the State and labour contracts for sex workers, in four EU Member States that contribute 29.2 percent EU GDP and almost one fourth (23.26 percent) of total population in 2010: Austria, Germany, Greece and the Netherlands.
As for abolition, in line with Stuart Mill (1870) and the United Nations Universal Declaration of Human Rights (1948), sexual exploitation is evil and it should be extinct as well as non-coercive sex trade. Prostitution must be banned with the criminalisation of third parties, such as pimps and brothels managers, but not the prostitutes themselves. This policy regime applies to the remaining 20 EU member states that account for 69.1 percent EU GDP and 71.2 percent of total population in 2010: Belgium, Bulgaria, Cyprus, Czech Republic, Denmark, Estonia, Finland, France, Hungary, Ireland, Italy, Latvia, Luxembourg, Poland, Portugal, Slovakia, Slovenia, Spain, Sweden1 and the UK.
Few papers address the empirics of prostitution in the recent economics literature that includes two strands. One explores various theoretical models based upon and extending the general assumption of rational choice behaviour from sex workers (Edlund and Korn 2002)
1
The customer alone is prosecuted. Hence, Swedish neo-abolitionism may be added to the typology as a fourth regime that France also adopted in 2016.
118
The other strand focuses on victims of sexual exploitation (Kara, 2009), designing predictions upon supply and demand as well as equilibria and policy regimes.. Cho et al (2013) address the effect of legalising prostitution upon a sample of 150 countries from the UNODC dataset. On the demand-side, some clients will be deterred from consuming commercial sex services if prostitution is illegal. Hence, legalising prostitution will increase demand for prostitution. On the supply side, legalising prostitution will induce some potential sex workers (or their pimps) to enter the market. Supply might decline due to tax collection from legalised prostitution. However, prostitutes unwilling to comply with tax payment can operate illegally. The legalisation of prostitution has two opposite effects on the incidence of trafficking, a substitution effect away from trafficking and a scale effect increasing trafficking. Hence, the overall effect is theoretically indeterminate and becomes an empirical issue.
Jakobsson and Kotsadam (2013) find a positive effect of legal prostitution on trafficking in a cross-sectional dataset of 31 European countries, using the ILO and UNODC datasets. Sexual exploitation trafficking of women is least prevalent in countries where prostitution is illegal, most prevalent in countries where it is legal, and in between in those countries where it is legal but procuring is illegal. Case studies of Norway and Sweden that have criminalised buying sex support the possibility of a causal link from harsher prostitution laws to reduced trafficking.
Hence, there are two distinct but related approaches. One addresses the issue of prostitution as legal sex work, a market economic activity that deserves thorough analysis in terms of supply and demand as well as estimates with regard to employment and value added. The other one addresses the issue of coercive prostitution in terms of victims of sexual exploitation or forced labour; the emphasis is upon illegal trafficking within a given country as well as cross-border migration, which is used as an approximation in order to estimate overall prostitution including both coercive and non-coercive sex work that actually blurs such a distinction.
The paper is structured as follows. Section 2 records the data sources on the demand-side and sketches an overview of British surveys upon sexual behavior patterns. Section 3 investigates the supply-side, starting with a series of estimates from HIV prevalence among sex workers. Section 4 provides another series of estimates from miscellaneous sources, including NGOs. Section 5 documents the patterns and magnitude of sexual exploitation trafficking according to the ILO, Eurostat and the UNODC; it provides a third series of estimates. Section 6 compares estimates as regards their magnitude and accuracy; thanks to an ordered probit that sheds light upon the distribution of countries as for employment figures.
2.
INVESTIGATING THE DEMAND SIDE OF THE SEX MARKET IN THE EU-28
2.1. Prices for sex trade and earnings premium
There are various criteria to gauge the market for sexual services depending on their prices, premises and working schedules. Prostitution encapsulates three broad distinct segments that address the customers: the upper tier or luxury prostitution (escorts and call girls); the
119
intermediate category includes indoor prostitution (brothels, bars, clubs, massage parlours, etc.); outdoor or street prostitution is the lower tier.
We compiled piecemeal data from 21 EU countries (Czech Rep., France, Luxembourg, Malta, Slovakia, Slovenia, Sweden are missing) from Havocscope Black Market (www.havocscope.com). Prices for street prostitution range from € 1 3up to € 63 and € 27 is the average price for twelve countries. Regarding brothels, the range is € 30-67, with an average price of € 45 (eight countries) that stands over one and a half times higher than street prostitution. Escort girls would charge from € 37 up to € 225 in five countries, with an average price of € 125 that stands more than four and a half times as high as street prostitution.
Let us assume that these are (net) hourly prices and that prostitutes earn half of the average price, whereas the other half is the pimp’s cut. Hence, we may compare with median gross hourly earnings for EU-27 employees in 2010 (Eurostat earn_ses_pub2i), namely € 11.8.
There is a premium as for earnings from street prostitution (€ 13.5), brothels (€ 22.5) and escorts (€ 62.5).
All studies agree that demand for prostitution comes from men. The issue remains controversial as regards male behaviour. In line with Stuart Mill (1870), abolitionists contend that demand should -and actually can be curbed, whereas Cho et al (2013) assume that demand is inelastic (Malthus, 1798). Hakim (2015) claims that demand is on the rise, due to male sexual deficit in Britain and Finland.
2.2. Qualitative and quantitative survey on sexual behavior in the EU.
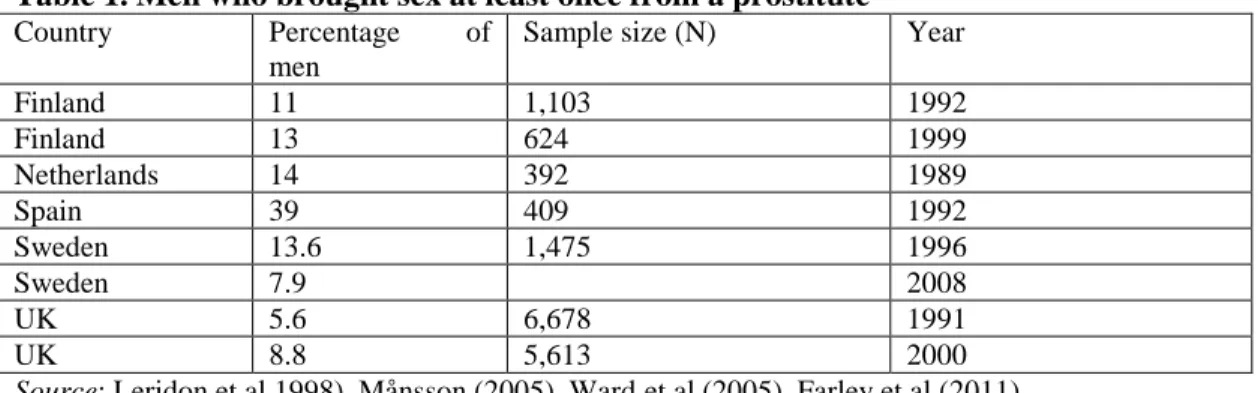
A first series of quantitative surveys addressed male sexual behaviour with the question ‘did the respondent pay at least once for sex with a prostitute’. Table 1 records data from five EU countries dating back to the 1990s, mostly before the Internet propelled easy access to sex services.
Table 1. Men who brought sex at least once from a prostitute Country Percentage of
men
Sample size (N) Year
Finland 11 1,103 1992 Finland 13 624 1999 Netherlands 14 392 1989 Spain 39 409 1992 Sweden 13.6 1,475 1996 Sweden 7.9 2008 UK 5.6 6,678 1991 UK 8.8 5,613 2000
Source: Leridon et al 1998), Månsson (2005), Ward et al (2005), Farley et al (2011)
Actually, a smaller proportion of men belonging to all socio-economic groups buy sex regularly in the UK, although demand increased from two percent up to four per cent over the 1990-2000 decade as for those who paid for sex in the previous five years (Ward et al, 2005). Demand depends on cultural patterns that encapsulate the social acceptance of prostitution. In Spain, the rate on men who did pay for sex at least once is three times higher
120
than in Finland and Sweden, and amounts to nine per cent in the UK. However, the sample for Spain as well as Finland and the Netherlands is too small a size to be representative. Table 2 records a second series of national surveys on sexual behaviour in Europe that developed during the 1990s (Hubert et al, 1998; Johnson et al, 2001). It addressed the proportion of men reporting having commercial sex in the past 12 months.
Table 2. Proportion of men reporting having commercial sex in the past 12 months Country Year Prevalence of clients of Female Sex Workers Source
France 1992 1.1% Natsal
France 1998 0.7% NEM
Germany (West) 1990 4.8% Natsal
Germany 1998 0.0% NEM Greece 1998 5.3% NEM Italy 1992 2.0% Natsal Italy 1998 1.7% NEM Netherlands 1989 2.8% Natsal Portugal 1991 5.4% Natsal Portugal 1999 2.4% NEM Spain 1990 11.0% Natsal UK 1990 2.0% Natsal UK 1998 1.0% NEM Source: Carael et al (2006)
National Surveys of Sexual attitudes and Lifestyles (Natsal) were conducted in the early nineties upon samples including sexually active only for 18–49 years old age group in seven European countries (France, West Germany, Italy, Netherlands, Portugal, Spain and the UK). There are large discrepancies across countries in reported contact with a sex worker: 1.1 per cent in France and 11.0 per cent in Spain. The median value is 4.95 per cent, with a mean of 4.1 per cent.
Surveys were designed in the late nineties using the EU New Encounter Module (NEM) in five countries (France, Germany, Italy, Portugal and the UK) and provide much smaller estimates: The median value is 2.22 per cent, with a mean of 2.65 per cent. It is worth noticing the bias in the early 1990s surveys due to age concentration and small sample size for some countries; hence, one cannot conclude that demand is declining. For instance, 3.1 per cent among a sample of 5,540 French males reported having commercial sex in the previous five years as for 2006 (Bajos et al, 2007), whereas the proportion was 3.3 per cent in 1992 (Spira et al, 1992).
2.3. The UK as a case study for sexual behavior
Although we do not assume it is representative of the EU-28 countries, the UK is an interesting case study in as much as several extensive studies have documented male sexual behavior (Johnson et al, 2001; Ward et al, 2005). Several papers also addressed the analytics of demand in the UK, which deserves a focus.
121
Two papers use data from the British National Survey of Sexual attitudes and Lifestyles (Natsal), which was conducted in 1990-1991 and 2000-2001 upon a representative sample of 12,110 clients and non-clients aged 16-44 years old.
Cameron and Collins (2003) estimate a probit model for the choice by males of consuming female prostitution services upon the 1990-1991 survey. The search cost for single men of finding sexual partners is an important determinant and pricing is a reflection of risk preferences for non-single men; the risk of disease has a significant deterrent effect, while risk disposition and belonging to a sexually restrictive religion have a significantly positive effect.
Della Giusta et al (2014) use the 2000-2001 survey, but restrict their sample to men aged 26-44 years; thus, there is no difference as regards average age between clients and non-clients. Their probit model includes the same variables as in Cameron and Collins (2003); determinants are very similar albeit educational attainment and skills seem to run opposite: client are better educated although more unskilled; clients are less often married or co-habiting than non-clients.
Both these surveys are biased are regards the age groups of clients: Males over 44 years old are also potential clients.
Another two papers design a hedonic price model that captures both the demand side and the supply-side upon data collected from an Internet website.
Moffatt and Peters (2004) used a sample of 998 clients in the whole UK that completed reports submitted between January 1999 and July 2000. They provide evidence that pricing reflects risk preferences and find that sex-workers in the UK earn twice the weekly wage of a typical non-manual female worker.
Muravyev and Talavera (2013) designed a matched female prostitutes-clients panel data over 1999-2009 from the same website, with a larger sample (4,569 observations from 1,580 sex-service providers) restricted to the London area and with a narrower focus upon unprotected sex. The average age of a service provider is 25 years old, there is a premium (median price per hour is £150) and a client spends on average 48 minutes while Moffat and Peters (2004) report a lower price and a shorter span of time.
It is worth noticing that these papers may focus on the upper end of the sex market and the average number of customers per prostitute is unknown. Hence, prices do not reflect the average gains of overall prostitutes throughout the country.
Furthermore, the UK may not be representative of sexual behaviour patterns across EU countries and we ignore the share of clients among the 168 million adult male population in EU-28. Addressing the demand-side issue requires some tentative assessment (Adair and Nezhyvenko, 2016), which falls out of the scope of this paper.
122
3.
ESTIMATES FROM THE SUPPLY SIDE: HIV PREVALENCE AMONG SEX WORKERS
As for the supply-side, it is worth noticing that some students and housewives participate on a part time basis in addition to full time professionals. Hence, we assume that prostitution is an equivalent full-time activity, the magnitude of which we measure, thanks to qualitative and quantitative surveys issued from primary as well as secondary sources.
There are qualitative surveys upon small non-random samples in three EU countries that have regulatory prostitution regimes. Farley et al (2003) interviewed 54 sex workers in Germany. Wagenaar et al (2013) interviewed 82 sex workers in Austria and 44 in the Netherlands; they suggest there are no barriers to entry as for brothels and earnings in prostitution are generally low: hourly gross earnings rarely exceeding € 8. Proprietors take usually 40-50 per cent from earnings. Hence, the sex worker would get roughly € 1,000 average monthly net earnings. Adriaenssens and Hendrickx (2015) designed a survey addressing the various segments of prostitution from the supply side altogether with a wide range of prices: it claims that the official figures for prostitution in Belgium are underestimated.
We assume that sex workers are overwhelmingly females (90 per cent); hence, we do not address male and transgender prostitution that nevertheless does exist.
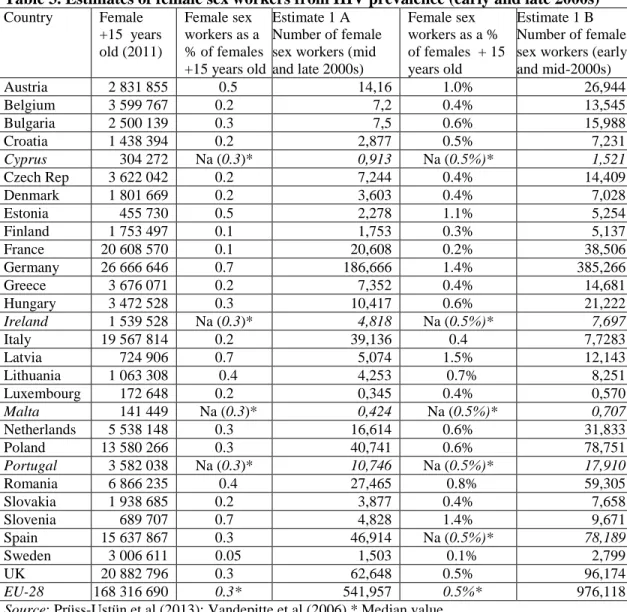
In Table 3, we estimate the number of female sex workers using an indirect measure from two series of data upon HIV prevalence collected from the World Health Organisation. In the first series, data for 23 EU countries relate either to 2000 or 2004 (Vandepitte et al, 2006); after adjusting for missing data with the median value of HIV prevalence in the EU (0.5 per cent), the number of females sex workers is slightly below one million stands for Estimate 1B. In the second series, data for 24 EU countries relate to mid and late 2000s (Prüss-Ustün et al, 2013); after adjusting for missing data with the median value of HIV prevalence in the EU (0.3 per cent), the number of females sex workers that is slightly over half a million stands for Estimate 1A.
Comparing these two series, one should not conclude that the magnitude of prostitution has declined, which would run opposite to the trend in demand. It is quite unlikely a serious drop in HIV prevalence occurred during so short a period that would only be due to safer sex practices, an assumption that is not documented. At last, there is no reason to assume that epidemic recording has deteriorated over time. We have yet no strong clue to decide if Estimate 1A understates the magnitude of sex work, although Prüss-Ustün et al (2013) acknowledge that survey coverage for female sex workers was adjusted for injection drug use and makes it a conservative estimation; conversely, Estimate 1B may overstate the magnitude of sex work.
123
Table 3. Estimates of female sex workers from HIV prevalence (early and late 2000s) Country Female +15 years old (2011) Female sex workers as a % of females +15 years old Estimate 1 A Number of female sex workers (mid and late 2000s) Female sex workers as a % of females + 15 years old Estimate 1 B Number of female sex workers (early and mid-2000s) Austria 2 831 855 0.5 14,16 1.0% 26,944 Belgium 3 599 767 0.2 7,2 0.4% 13,545 Bulgaria 2 500 139 0.3 7,5 0.6% 15,988 Croatia 1 438 394 0.2 2,877 0.5% 7,231 Cyprus 304 272 Na (0.3)* 0,913 Na (0.5%)* 1,521 Czech Rep 3 622 042 0.2 7,244 0.4% 14,409 Denmark 1 801 669 0.2 3,603 0.4% 7,028 Estonia 455 730 0.5 2,278 1.1% 5,254 Finland 1 753 497 0.1 1,753 0.3% 5,137 France 20 608 570 0.1 20,608 0.2% 38,506 Germany 26 666 646 0.7 186,666 1.4% 385,266 Greece 3 676 071 0.2 7,352 0.4% 14,681 Hungary 3 472 528 0.3 10,417 0.6% 21,222 Ireland 1 539 528 Na (0.3)* 4,818 Na (0.5%)* 7,697 Italy 19 567 814 0.2 39,136 0.4 7,7283 Latvia 724 906 0.7 5,074 1.5% 12,143 Lithuania 1 063 308 0.4 4,253 0.7% 8,251 Luxembourg 172 648 0.2 0,345 0.4% 0,570 Malta 141 449 Na (0.3)* 0,424 Na (0.5%)* 0,707 Netherlands 5 538 148 0.3 16,614 0.6% 31,833 Poland 13 580 266 0.3 40,741 0.6% 78,751 Portugal 3 582 038 Na (0.3)* 10,746 Na (0.5%)* 17,910 Romania 6 866 235 0.4 27,465 0.8% 59,305 Slovakia 1 938 685 0.2 3,877 0.4% 7,658 Slovenia 689 707 0.7 4,828 1.4% 9,671 Spain 15 637 867 0.3 46,914 Na (0.5%)* 78,189 Sweden 3 006 611 0.05 1,503 0.1% 2,799 UK 20 882 796 0.3 62,648 0.5% 96,174 EU-28 168 316 690 0.3* 541,957 0.5%* 976,118
Source: Prüss-Ustün et al (2013); Vandepitte et al (2006) * Median value
4.
ESTIMATES FROM THE SUPPLY SIDE: NGOS AND MISCELLANEOUS SOURCES
There are qualitative surveys upon small non-random samples in three EU countries that have regulatory prostitution regimes. Farley et al (2003) interviewed 54 sex workers in Germany. Wagenaar et al (2013) interviewed 82 sex workers in Austria and 44 in the Netherlands; they suggest there are no barriers to entry as for brothels and earnings in prostitution are generally low: hourly gross earnings rarely exceeding € 8. Proprietors take usually 40-50 per cent from earnings. Hence, the sex worker would get roughly € 1,000 average monthly net earnings. Adriaenssens and Hendrickx (2015) designed a survey addressing the various segments of prostitution from the supply side altogether with a wide range of prices: it claims that the official figures for prostitution in Belgium are underestimated.
124
An international foundation defending sex workers (TAMPEP, 2010) collected 380 responses from 600 standardised questionnaires sent to key organisations, mostly NGOs (56 per cent) and Health Services (22 per cent) in direct contact with sex workers. It helped building reports for 23 EU countries; Croatia, Cyprus, Ireland, Malta and Sweden are missing (See Table 4).
Table 4. Sex workers in the EU according to TAMPEP (2008) Country Nationals (% of prostitutes) Migrants (% of prostitutes) Dummy (%) Outdoor prostitution Number of prostitutes year Austria 78% Import 15% 27,000-30,000 2008 Belgium 60% Import 34% 15,000-20,000 2008 Bulgaria 98% 33% 6,000-10,000 2008 Croatia Cyprus Czech Rep 59% 19 % 10,000-13,000 2008 Denmark 65% Import 25% 5,560 2008 Estonia 95% 2% 1,000-1,200 2008 Finland 69% Import 10% 5,000-6,000 2008 France 61% Import 61% 18,000-30,000 2008 Germany 65% Import 13% 400,000 2008 Greece 73% Import 60% 10,000 2008 Hungary 75% 40% 10,000-15,000 2008 Ireland Italy 90% Import 60% 50,000 2008 Latvia 88% 40% 2,000-3,000 2008 Lithuania 90% 57% 1,250–1,550 2008 Luxembourg 92% Import 30% 5,000 2008 Malta Netherlands 60% Import 11% 10,000-15,000 2008 Poland 66% 40% 10,000 2008 Portugal 56% Import 45% 9,700 2008 Romania 98% 64% 2,500-3,800 2008 Slovakia 98% 73% 7,500 2008 Slovenia 70% 2% 1,500-3,000- 2008 Spain 90% Import 46% 6,000 2008 Sweden 2008 UK 41% 23% 80,000 2008 EU-23 693,000-730,000 Source: TAMPEP (2010)
Some answers regarding earnings suggest that the questions were misunderstood and estimates were not checked. However, reports provide data on working conditions and vulnerability, mobility and earnings that may be used for qualitative assessment.
As regards location, almost two thirds of sex workers in Europe work indoor (brothels, clubs, bars, parlours, windows and escort), which makes prostitution less visible, hence more difficult to estimate.
125
Table 5. Maximin and minimax Estimates from miscellaneous sources (circa 2010) Country Number of adult females (thousand) Number of prostitutes (circa 2010) Number of prostitutes (circa 2010) Estimate 2A: Maximin Estimate 2B: Minimax Austria 2,815.5 27,000-30,000 5,500-10,000 10,000 27,000 Belgium 3,555.9 15,000-20,000 10,000-15,000 15,000 20,000 Bulgaria 2,535.48 6,000-10,000 8,000-10,000 10,000 10,000 Croatia 1,438.29 6,700 6,700 6,700 Cyprus 295.125 915 1,446 Czech Rep. 3,641.35 10,000-13,000 5,000-25,000 13,000 25,000 Denmark 1,800.06 5,560 5,500 5,500 5,500 Estonia 459.12 1,000-1,200 1,000 1,000 1,200 Finland 1,756.75 5,000-6,000 12,000-15,00 6,000 15,000 France 21,197.0 18,000-30,000 18,000-20,000 20,000 30,000 Germany 26,628.5 400,000 150,000-400,000 150,000 400,000 Greece 3,684.2 10,000 1,200-20,000 10,000 20,000 Hungary 3,483.1 10,000-15,000 8,000-10,000 10,000 15,000 Ireland 1,543.8 1,000 1,000 1,000 Italy 19,501.4 50,000 50,000-100,000 50,000 100,000 Latvia 743.3 2,000-3,000 15,000-20,000 3,000 20,000 Lithuania 1,102.8 1,250–1,550 1,550 1,550 Luxembourg 169.06 5,000 5,000 5,000 Malta 141.9 467 467 Netherlands 5,519.2 10,000-15,000 20,000-30,000 15,000 30,000 Poland 13,561.5 10,000 12,000 10,000 12,000 Portugal 3,590.1 9,700 28,000 9,700 28,000 Romania 6,899.5 2,500-3,800 2,000-23,000 3,800 23,000 Slovakia 1,941.3 7,500 7,500 7,500 Slovenia 688.4 1,500-3,000- 1,500 3,000 Spain 15,653.1 6,000 300,000-400,000 300,000 400,000 Sweden 3,000.7 1,500 1,500 1,500 UK 20,769.0 58,000-80,000 80,000-100,000 80,000 80,000 EU-28 168,116.1 693,000-730,000 740,400-1,253,700 747,970 1,309,634
Source: TAMPEP (2010); Charpenel (2013); UNODC (2014).
Twelve EU countries wherein the share of migrants among sex workers is above 50 per cent are net importers; the UK is an outlier. Conversely, ten EU countries wherein the share of nationals among sex workers is above 50 per cent are most likely to be exporters. One third
126
of migrants came from EU countries in 2008, especially from Eastern Europe, Romania and Bulgaria being most mentioned countries of origin. Nationals account only for 30 per cent of total number of sex workers, whereas migrant sex workers account for almost 70 per cent. The latter are highly mobile and more vulnerable as regards working conditions and risks (including HIV as well as deportation); two thirds are prone to be exploited by third party (pimps and brothel managers). The figures for nationals are opposite: one third is prone to be exploited by third party.
Aforementioned data including both nationals and migrants (TAMPEP, 2010) suggest that over one third (36 per cent) of sex workers might be independent from third party (although not from family ties) and could be considered as self-employed, including part-time sex workers. Hence, the majority of sex workers is trapped in forced labour, wherein migrants fill in the largest share.
In order to fill in the vacuum for the five missing countries from Table 4 and do
justice to other estimates, we picked up the figures from the abolitionist Scelles
foundation (Charpenel, 2013) and the UNODC (2014) that are included in Table 5.
It is worth noticing that figures come from miscellaneous sources (NGOs, the police,
etc.) and no information is available as regards coverage and time period for data
collection. We compiled all estimates whatever sources for 26 EU countries and
completed the missing figures for Cyprus and Malta with the median value of the 26
EU countries. We first calculate the highest of the lowest figures (Maximin) and
come up with Estimate 2A that amounts to 748,000 prostitutes. When calculating the
lowest of the highest figures (Minimax), Estimate 2B amounts to 1,310,000
prostitutes, which is 75 per cent higher.
5.
ESTIMATES FROM THE SUPPLY-SIDE: SEXUAL EXPLOITATION TRAFFICKING AND
FORCED LABOURSexual exploitation trafficking or forced labour and prostitution do not overlap, in as much as the latter encapsulates non coerced sex work. Although a subsample of overall prostitution, sexual exploitation trafficking is used as an indirect measurement of the former. The ILO (2012), Eurostat (2013) and UNODC (2014) provide fragmented information on the patterns of prostitution and its magnitude in the EU. Eurostat and UNODC assert that trafficking for sexual exploitation is the most common form of human beings trafficking. Available and reliable data recording depend on judicial and police effectiveness across countries. Databases do not collect necessarily from the same source: neither UNODC nor Eurostat collect primary sources, whereas the ILO collects data from both primary and secondary sources (Vermeulen et al, 2006).
5.1. The ILO survey on forced labour and sexual exploitation trafficking
The ILO (2009) designed from experts a list of 67 indicators related to trafficking. The subset of indicators for sexual exploitation encapsulates very bad working conditions (including excessive working time and hazardous work), low or no salary and no compliance with labour regulations (including the absence of contract signed and social protection). It
127
leaves room for non-coercive prostitution (including casual activity) in as much as it is not related to sexual exploitation. In this connection, non-coercive prostitution is included in informal employment as defined by the ILO (2013).
The ILO (2012) computed a global estimate of forced labour for the 2002- 2011 reference period from a capture-recapture investigation based on reported cases from different sources (research institutes, NGOs and the media). There are some 880,000 victims of forced labour in Europe, among which 270,000 (30 per cent) are enslaved in sexual exploitation, which does not cover up the overall magnitude of prostitution. Forced sexual exploitation is mostly affecting women (98 per cent) and the average duration is less than 18 months for commercial sexual exploitation. As for the prevalence of forced labour, the ratio is highest in the Central and South-Eastern Europe regions (4.2 victims per 100,000 inhabitants) and lowest in the European Union (1.5 victims per 100,000 inhabitants).
5.2. Designing an Eurostat-UNODC estimate from victims of sexual exploitation
Eurostat (2013) collected data on human beings trafficking over the period 2008-2010. It is acknowledged that the EU currently lacks reliable and comparable statistical information on trafficking in human beings. This is mainly due to the differences between the Member States in the criminal codes, in the reporting and monitoring systems as well as for the rates of reporting cases to the police, NGOs and other entities.
In the year 2010, 24 EU Member States reported a total number of 9,528 identified and presumed victims of trafficking, whereas the total number of identified victims is 5,535. Data are broken down between other forms of forced labour and sexual exploitation, which amounts to the largest share of victims (62 per cent) that are predominantly female (96 per cent). Sexual exploitation includes all forms of forced prostitution whether indoor or outdoor. Most victims detected in EU Member States are citizens from Romania and Bulgaria.
Box 1. The Palermo Protocol
The United Nations Protocol to Prevent, Suppress and Punish Trafficking in Persons, Especially Women and Children, coined as the Palermo Protocol (2000) sets the minimum standards for the elimination of trafficking of human beings. The United Nations Office on Drugs and Crime (UNODC) is in charge of the implementation and records the victims (UNODC, 2014). The Palermo Protocol entered in force in 2003 and states that exploitation of prostitution and trafficking cannot be separated, albeit it does not apply to non-coercive prostitution. Tier 1 gathers 17 EU Member States that fully comply with the minimum standards, whereas the remaining 11 EU Member States that do not fully comply belong to Tier 2 It is worth noticing that Tier 2 gathers countries from all three-policy regimes as regards prostitution. See Table 6.
UNODC (2014) provides some similar patterns for the period 2010- 2012. Most victims detected in EU Member States for year 2010 are citizens from Romania and Bulgaria. In Central Europe and the Balkans, domestic trafficking accounts for about 80 per cent of the detected victims in accordance with previous findings (TAMPEP, 2010). Among the detected victims trafficked to EU countries, sexual exploitation is prevalent (66.25 per cent).
128
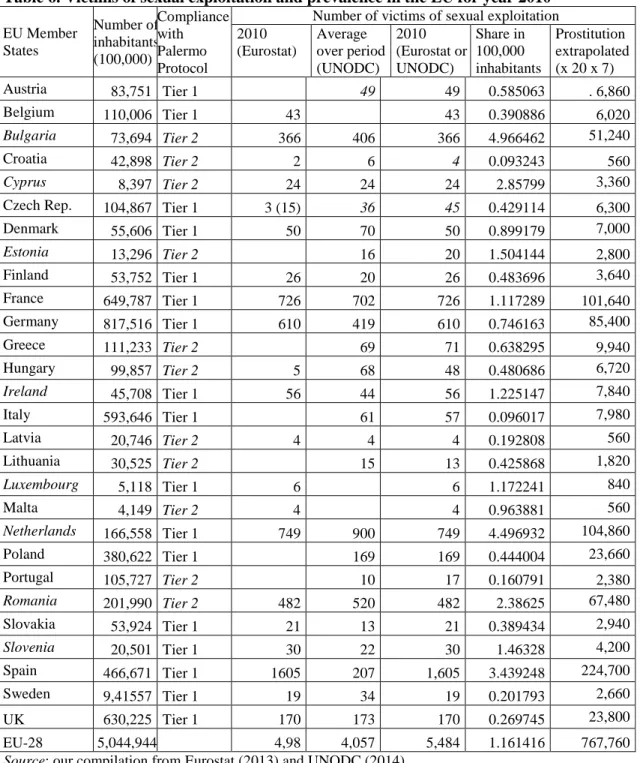
Table 6. Victims of sexual exploitation and prevalence in the EU for year 2010 EU Member States Number of inhabitants (100,000) Compliance with Palermo Protocol
Number of victims of sexual exploitation 2010 (Eurostat) Average over period (UNODC) 2010 (Eurostat or UNODC) Share in 100,000 inhabitants Prostitution extrapolated (x 20 x 7) Austria 83,751 Tier 1 49 49 0.585063 . 6,860 Belgium 110,006 Tier 1 43 43 0.390886 6,020 Bulgaria 73,694 Tier 2 366 406 366 4.966462 51,240 Croatia 42,898 Tier 2 2 6 4 0.093243 560 Cyprus 8,397 Tier 2 24 24 24 2.85799 3,360
Czech Rep. 104,867 Tier 1 3 (15) 36 45 0.429114 6,300
Denmark 55,606 Tier 1 50 70 50 0.899179 7,000 Estonia 13,296 Tier 2 16 20 1.504144 2,800 Finland 53,752 Tier 1 26 20 26 0.483696 3,640 France 649,787 Tier 1 726 702 726 1.117289 101,640 Germany 817,516 Tier 1 610 419 610 0.746163 85,400 Greece 111,233 Tier 2 69 71 0.638295 9,940 Hungary 99,857 Tier 2 5 68 48 0.480686 6,720 Ireland 45,708 Tier 1 56 44 56 1.225147 7,840 Italy 593,646 Tier 1 61 57 0.096017 7,980 Latvia 20,746 Tier 2 4 4 4 0.192808 560 Lithuania 30,525 Tier 2 15 13 0.425868 1,820 Luxembourg 5,118 Tier 1 6 6 1.172241 840 Malta 4,149 Tier 2 4 4 0.963881 560 Netherlands 166,558 Tier 1 749 900 749 4.496932 104,860 Poland 380,622 Tier 1 169 169 0.444004 23,660 Portugal 105,727 Tier 2 10 17 0.160791 2,380 Romania 201,990 Tier 2 482 520 482 2.38625 67,480 Slovakia 53,924 Tier 1 21 13 21 0.389434 2,940 Slovenia 20,501 Tier 1 30 22 30 1.46328 4,200 Spain 466,671 Tier 1 1605 207 1,605 3.439248 224,700 Sweden 9,41557 Tier 1 19 34 19 0.201793 2,660 UK 630,225 Tier 1 170 173 170 0.269745 23,800 EU-28 5,044,944 4,98 4,057 5,484 1.161416 767,760
Source: our compilation from Eurostat (2013) and UNODC (2014).
We compared and compiled data for victims of sexual exploitation in 2010 from Eurostat (2013) and UNODC (2014). In Table 6, we report the numbers of victims for 20 EU countries. With regard to consistency, we first checked both series of data for the same 18 EU countries; the data do not match for Spain. We computed the missing data thanks to the
129
average share of victims according to the UNODC series. At last, we completed the series for all 28 EU countries, using Eurostat series when available and UNODC otherwise. It is worth noticing that some large countries such as Italy and Poland did not provide data although they belong to the Tier 1 Palermo Protocol. We calculated the "Number of victims/100,000" (last column) by dividing "Number of victims of sexual exploitation in 2010" (seventh column) per "Population in 100,000 in 2010” (second column).
In the EU-28, in line with the estimate from the ILO (2012), the average number of
victims of sexual exploitation is over one (1.16) for a thousand hundred inhabitants
in 2010. Bulgaria, Estonia, and Romania as well as Cyprus do not fully comply with
the Palermo Protocol and stand above average; such is also the case for Slovenia that
is compliant. Fully compliant countries such as Ireland, Luxembourg, the
Netherlands and Spain also stand above average, whereas France is pretty close to
average.
According to UNODC (2010) the detection ratio is one in 20 victims of sexual
exploitation trafficking and one sex worker in seven would be a trafficking victim
2.
If we use these figures, there would be a flow of 100,000 victims for sexual
exploitation in the EU 28 in 2010 (5,000 recorded victims times 20) and over
750,000 sex workers. However, UNODC calculates a stock from a flow, ignoring
how large is the flow that leaves the market (replacement) or just moves across
countries. If net inflow increases, the stock of prostitutes will rise and prices should
decline, unless demand increases.
We apply the multiplier (times 20 times seven) to the number of victims of sexual
exploitation in each country and extrapolate the magnitude of prostitution (see last
column in Table 6): we come up with an overall figure of 767,760 prostitutes for
EU-28, which is our Estimate 3B. Some results regarding country distribution are
obviously inconsistent: for instance, Germany counts less prostitutes than the
Netherlands albeit five times larger a population. Hence, one may be very skeptical
as for the accuracy of such a proxy to gauge prostitution at country level (Savona and
Stefanizzi, 2007).
6.
A
COMPARISON OF ESTIMATES:
INFORMAL EMPLOYMENT AND POPULATION DISTRIBUTION6.1. Prostitution and informal employment
Prostitution as any other activity falls within the employment framework designed by the ILO in order to compile informal employment, which gathers employees and self-employed both within the formal and the informal sector (ILO, 2013). Employees are considered informal in as much as their employment relationship is not subject to national labour
2
Transcrime (2002) suggests a multiplier of 20 for every victim detected, which comes from a pilot survey tested in Spain, Italy and Finland. The share of victims among sex workers remains unexplained.
130
legislation, income taxation or social protection entitlement. Informal employees may be undeclared, hold casual jobs or jobs with a limited short duration; experience working hours (beyond) or wages (below) a specified threshold; workplace is outside the premises of the employer’s business; or jobs for which labour regulations are not applied, not enforced, or not complied with for any other reason. Self-employed in unincorporated enterprises are informal in as much as their job is not registered, escaping both income taxation and social security contribution payment.
The EU countries do not compile informal employment. The absence of a fixed contract may provide a proxy for informal employment; in this connection, it applies to both the employees with a limited duration contract and to self-employed. Sex workers do not usually have a fixed contract ensuring that they benefit from labour and social regulations, although they may have a job in massage parlours or other legal activities. In as much as prostitutes are considered as self-employed workers without fixed contract, regardless they are trapped in (illegal) forced labour or practice (legal) non-coercive sex work, they are informal workers.
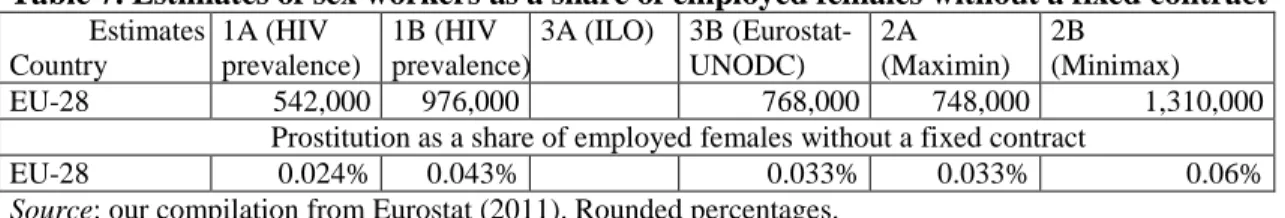
Table 7. Estimates of sex workers as a share of employed females without a fixed contract Estimates Country 1A (HIV prevalence) 1B (HIV prevalence) 3A (ILO) 3B (Eurostat-UNODC) 2A (Maximin) 2B (Minimax) EU-28 542,000 976,000 768,000 748,000 1,310,000
Prostitution as a share of employed females without a fixed contract
EU-28 0.024% 0.043% 0.033% 0.033% 0.06%
Source: our compilation from Eurostat (2011). Rounded percentages.
As regards informal employment, sex workers should be (are) included in total employed females. In as much as they are not considered officially as wage earners, sex workers belong to the category of self-employed females. However, most of them are employees without a fixed contract. Adding these two categories, we come up with a broad category of employed females without a fixed contract, as a proxy for informal workers. There are 21.797 million females without a fixed contract among 101.136 million employed females as for 2010 the EU-28: one female worker out of five. See Table 7.
6.2. Checking estimates: An ordered probit
We calculated the share of prostitutes among the female workers, using our five estimates as a percentage of employment according to the data from Eurostat (2011) for year 2010. We applied an ordered probit model to our five estimates according to several variables mostly focusing on the supply-side3: GDP per capita, Legal brothels, Adult female population (aged
15-64,) International female migrant stock per 100,000 population, rate of unemployment for females below 25, Part-time female workers. See Table 8.
Looking for the best estimate, Estimate 1A (541,957 prostitutes) is an obvious candidate, followed by Estimate 1B (976,118 prostitutes), Estimate 2B (1,309,634 prostitutes), Estimate 2A (747,970 prostitutes) and Estimate 3B (767,760 prostitutes). Figures from HIV
3
We cross checked the demand side including total adult male population and the scale effect as regards total population. These variables are not included in the paper. Detailed results are available upon request.
131
prevalence are more reliable than Estimates 2B and 2A from miscellaneous sources (NGOs, the police, etc.), whereas Estimate 3B from victims of sexual exploitation is the least reliable. As regards numbers, our best estimate is also the most conservative one, albeit it may stand as a lower bound.
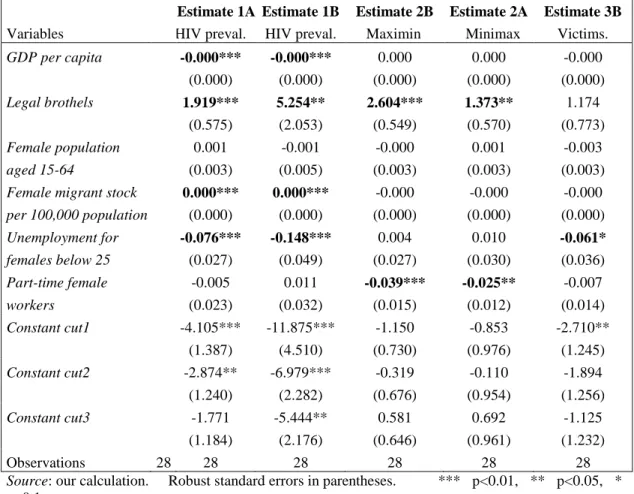
Table 8. Ordered probit model
Estimate 1A Estimate 1B Estimate 2B Estimate 2A Estimate 3B Variables HIV preval. HIV preval. Maximin Minimax Victims.
GDP per capita -0.000*** -0.000*** 0.000 0.000 -0.000 (0.000) (0.000) (0.000) (0.000) (0.000) Legal brothels 1.919*** 5.254** 2.604*** 1.373** 1.174 (0.575) (2.053) (0.549) (0.570) (0.773) Female population 0.001 -0.001 -0.000 0.001 -0.003 aged 15-64 (0.003) (0.005) (0.003) (0.003) (0.003)
Female migrant stock 0.000*** 0.000*** -0.000 -0.000 -0.000
per 100,000 population (0.000) (0.000) (0.000) (0.000) (0.000) Unemployment for -0.076*** -0.148*** 0.004 0.010 -0.061* females below 25 (0.027) (0.049) (0.027) (0.030) (0.036) Part-time female -0.005 0.011 -0.039*** -0.025** -0.007 workers (0.023) (0.032) (0.015) (0.012) (0.014) Constant cut1 -4.105*** -11.875*** -1.150 -0.853 -2.710** (1.387) (4.510) (0.730) (0.976) (1.245) Constant cut2 -2.874** -6.979*** -0.319 -0.110 -1.894 (1.240) (2.282) (0.676) (0.954) (1.256) Constant cut3 -1.771 -5.444** 0.581 0.692 -1.125 (1.184) (2.176) (0.646) (0.961) (1.232) Observations 28 28 28 28 28 28
Source: our calculation. Robust standard errors in parentheses. *** p<0.01, ** p<0.05, * p<0.1
GDP per capita is very significant for Estimates 1A and 1B (p-value is 0.01), albeit it proves
negative. This may run against the intuition that higher GDP attracts more prostitutes (especially migrants).
Legal brothels is significant for almost all Estimates (p-value is 0.01 or at least 0.5), with the
exception of Estimate 3B; it proves always positive, in line with the results of existing literature (Cho et al, 2013; Jakobsson and Kotsadam, 2013).
Adult female population is insignificant for all Estimates and proves positive only for
Estimates 2A and 1A, making sure that prostitutes are women.
International female migrant stock per 100,000 of population is very significant and proves
132
Unemployment rate of females below 25 is very significant for Estimates 1A and 1B (p-value
is 0.01) and weakly significant for Estimate 3 (p-value is 0.1); it proves negative, suggesting that unemployment does not drive prostitution.
Rate of female part-time workers is significant for Estimates 2A and 2B (p-value is 0.01 and
0.5); it proves negative, suggesting that prostitution is a full-time job.
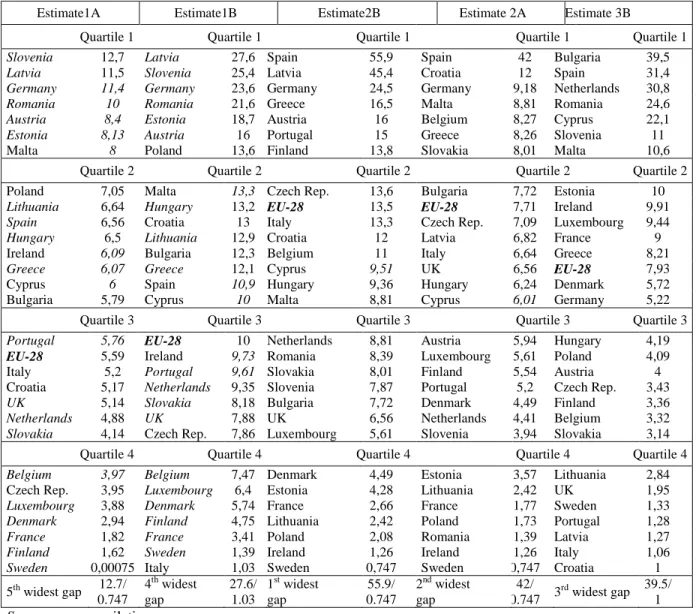
We selected quartiles as cut points for each estimate, dividing the sample into four categories of equal size (seven countries) according to the share of prostitutes per one thousand female workers, from highest to lowest. Quartile 1 is the upper half above median, quartile 2 is the lower half above median, quartile 3 is the upper half below median, and quartile 4 the lower half below median. Ranking is similar as regards the first two Estimates (1A and 1B) for 24 countries (save Croatia, Ireland, Italy and Poland), the mean for EU-28 is also very close to the median. Nineteen countries display similar ranking at least for three Estimates, among which only five countries display similar ranking for four Estimates (France, Germany, Hungary, Netherlands and Sweden). On average, the share of prostitutes in the EU-28 for year 2010 would amount from less than six up to over 13 per 100,000 female workers, with respect to Estimates. See Table 9 in appendix.
7.
C
ONCLUSIONIt is common knowledge that data on prostitution are scant and expert’s calculations are ‘guesstimates’. Our sample is small (28 countries) albeit consistent because EU membership is binding with respect to budget issues and the requested harmonisation of National Accounts. Moreover, the EU is an open area for both labour and capital mobility, which makes cross-border trafficking easy.
Recalling that the share of countries wherein brothels are legal is close to one fourth of total EU-28 population, one main finding in line with the existing literature is that the regulation of legal brothels positively correlates with four out of five Estimates. We also suggest that there is a premium for prostitution, despite some mixed evidence that the upper end segment of the prostitution market may pull prices; conversely, the lower end may be far less profitable for sex workers but not for pimps and brothel managers.
To our best knowledge, the five Estimates we have compiled as for the EU-28 are the first ones in the economic literature on prostitution. We designed ordered probit models according to which Estimates 1A and 1B issued from HIV prevalence prove most robust. Conversely, other Estimates from miscellaneous sources (2A and 2B) and Estimate 3B from victims of sexual exploitation trafficking prove far less robust. Estimate 1A provides a lower bound figure (542,000 prostitutes) as for 2010 that may be used as a benchmark for macroeconomic purposes.
There are limitations in our study. First, we did not use panel data in the absence of a reliable database for prostitution; hence, we did not address the dynamics of the EU sex market. Second, we have no robust variable addressing the demand side that deserves dedicated surveys upon sexual behavior as well as National Accounts data for expenditure on prostitution. Last, we have little evidence regarding either the share of coercive (sexual
133
exploitation) vs. non-coercive prostitution, or the share of employees vs. self-employed prostitutes.
In our work in progress (Adair and Nezhyvenko, 2016) we crosscheck these estimates with data from National Accounts in order to address the value added from sex work and we make some tentative assumptions regarding the demand-side and earnings. In this connection, prostitution may possibly be the tip of iceberg as regards the sex industry, including sex shops and the pornographic movie business industry that the Internet has triggered, we know little about. So far, investigation is lacking with respect to the spillover effects of prostitution on hotel occupation rate and cabaret dancing entertainment, etc.
R
EFERENCESAdair, P. and Nezhyvenko, O. (2016) Sex work vs. sexual exploitation: Assessing guesstimates for prostitution in the European Union. Proceedings of the 6th OECD Conference, September 6-9, Paris, IISES. DOI: 10.20472/EFC.2016.006.002
Adriaenssens S. and Hendrickx J. (2015) A direct measure of output in prostitution in Belgium. Faculty of Economics and Business, KU Leuven: Belgium.
Bajos, N., Bozon, M., Beltzer, N. (2007) Enquête sur le Contexte de la Sexualité en France. ANRS, INED, INSERM, PARIS: France.
Cameron, S. and Collins, A. (2003) “Estimates of a model of male participation in the market for female heterosexual prostitution services”. European Journal of Law and
Economics 16(3): 271-288.
Carael, M., Slaymaker, E., Lyerla, R. and Sarkar, S. (2006) “Clients of sex workers in different regions of the world: hard to count”. Sexually Transmitted Infections 82(Suppl 3): 26–33.
Charpenel, Y. ed. (2013). Sexual Exploitation Prostitution and Organized Crime.
www.fondationscelles.org/pdf/rapport_mondial/sexual_exploitation_prostitution_Fondati on_Scelles.pdf
Cho, S-Y., Dreher, A. and Neumayer, E. (2013) “Does Legalized Prostitution Increase Human Trafficking”? World Development 41: 67–82.
Della Giusta, M., Di Tommaso, M. L. and Jewell, S. L. (2014) Stigma and Risky Behaviors
among Clients of Prostitutes. Working Paper Series 19/14, Universita di Torino: Italy Edlund, L. and Korn, E. (2002) “A theory of prostitution”. Journal of Political Economy
110(1): 181-214.
Eurostat. Earnings of employees in 2010. Eurostat.online data code: earn_ses_pub2i
Eurostat, (2011) Labour market statistics. Publications Office of the European Union: Luxembourg.
Eurostat, (2013) Trafficking in human beings, Luxembourg: Publications Office of the European Union
Farley, M., Cotton, A., Lynne, J., Zumbeck, S., Spiwak, F., Reyes, M. E., Alvarez, D. and Sezgin, U. (2003) “Prostitution and Trafficking in Nine Countries: an Update on Violence and Posttraumatic Stress Disorder”. Journal of Trauma Practice 2 (3-4): 33-74.
134
Farley, M., Macleod, J., Anderson, L. and Golding, J. M. (2011) “Attitudes and Social Characteristics of Men Who Buy Sex in Scotland”. Psychological Trauma Theory
Research Practice and Policy 3(4): 369-383.
Farmer, A. and Horowitz, A. W. (2013) “Prostitutes, Pimps, and Brothels: Intermediaries,
Information, and Market Structure in Prostitution Markets”. Southern Economic Journal
79(3): 513-528.
Hakim, C. (2015) Supply and Desire: Sexuality and the sex industry in the 21st century. IEA
Discussion Paper No.61, August. London: UK.
Havocscope Black Market. www.havocscope.com
Hubert, M., Bajos, N., Sandfort, T. (1998) Sexual behavior and HIV/AIDS in Europe:
comparisons of national surveys. UCL Press, London: UK.
ILO, (2014) Profits and Poverty: The Economics of Forced Labor. International Labour Organisation, Geneva: Switzerland.
ILO, (2013) Measuring Informality: a Statistical Manual on the Informal Sector and
Informal Employment, International Labour Organisation, Geneva: Switzerland.
ILO, (2012) ILO Global estimate of forced labour - Results and methodology. Indicators of Forced Labour. Special Action Programme to Combat Forced Labour, International Labour Office, Geneva: Switzerland. http://www.ilo.org/wcms
ILO, (2009) Operational indicators of trafficking in human beings Results from a Delphi survey implemented by the ILO and the European Commission, September. International Labour Organisation, Geneva: Swizterland.
Johnson, A.M, Mercer, C.H., Erens, B., Copas, A.J., McManus, S. and Wellings, K. (2001) “Sexual behaviour in Britain: partnerships, practices, and HIV risk behaviours”. Lancet, 358(9296):1835-42.
Jakobsson, N. and Kotsadam, A. (2013) “The law and economics of international sex slavery: Prostitution laws and trafficking for sexual exploitation”. European Journal of
Law and Economics 35(1): 87-107
Kipling, R. (1888) On the City Wall. Black and White. A H Wheeler & Co.’s Indian Railway Library.
Leridon, H., Zesson, G. and Hubert, M. (1998): The Europeans and their sexual partners, in Hubert. M., Bajos N. and Sandfort T. (eds) Sexual Behaviour and IV/AIDS in Europe, pp. 165–196, UCL Press, London: UK.
Malthus, T. R. (1798) An Essay on the Principle of Population. Liberty Fund, Inc., 2000.
http://oll.libertyfund.org/titles/311
Mandeville, B. (1724) A Modest Defence of Publick Stews. In Bernard Mandeville's "A
Modest Defence of Publick Stews", Primer I. ed. (2006), pp. 42-100. Palgrave MacMillan:
New York.
Månsson, S-A. (2005) Men’s practices in prostitution and their implications for social work.
In Månsson S-A and Proveyer Cervantes C. eds. (2005) Social Work in Cuba and
Sweden. Prospects and Achievements. Department of Social Work, Göteborg University and Department of Sociology, University of Havana: Cuba.
Mendes Bota, P. (2014) Prostitution, trafficking and modern slavery in Europe, Doc. 13446, March 20. www.assembly.coe.int
135
Moffatt, P. G and Peters, S. A. (2004). “Pricing personal services: An empirical study of earnings in the UK prostitution industry”. Scottish Journal of Political Economy 51(5): 675-690.
Moffatt, P. G (2005) Economics of prostitution. In Bowmaker S. W. (Ed) Economics Uncut
A Complete Guide to Life, Death and Misadventure, Edward Elgar Publishing, Chapter 7:
pp. 193-228.
Muravyev, A. and Talavera, O. (2013) Unsafe Sex in the City: Risk Pricing in the London Area, February 13, University of Sheffield: UK.
Prüss-Ustün, A., Wolf, J., Driscoll, T., Degenhardt, L., Neira, M. and Calleja, J.M.G. (2013) “HIV Due to Female Sex Work: Regional and Global Estimates”. PloS ONE 8(5): 1-7. Savona, E. U. and Stefanizzi, S. eds. (2007) Measuring Human Trafficking: Complexities
and Pitfalls, Springer:New-York.
Schulze, E. (2014) Sexual exploitation and prostitution and its impact on gender equality. Policy Department C: Citizens’ Rights and Constitutional Affairs. European Parliament. Brussels: Belgium
Spira, A., Bajos, N. and the ACSF group (1992) “Aids and sexual behaviour in France”.
Nature, 360: 407-409.
Stuart Mill, J. (1870) The Evidence of John Stuart Mill, taken before the Royal Commission of 1870, on the Administration and Operation of the Contagious Diseases Acts of 1866 and 1869, Collected Works of John Stuart Mill, Volume XXI, Robson J. M. (ed), University of Toronto Press, Routledge and Kegan Paul (1984), pp 349-371.
http://oll.libertyfund.org/titles/255
TAMPEP, (2010) National mapping reports, European Network for HIV/STI Prevention and Health Promotion among Migrant Sex Workers, TAMPEP International Foundation: the Netherlands
Transcrime, (2002) A Pilot Study on Three European Union Key Immigration Points for Monitoring the Trafficking of Human Beings for the Purpose of Sexual Exploitation across the European Union. Transcrime Reports No 3, European Commission, Brussels: Belgium.
UNODC, (2014) Global Report on Trafficking in Persons, country profiles Western and Central Europe, United Nations Office on Drugs and Crime, Vienna: Austria.
UNODC, (2010) Trafficking in Persons Report 2010. United Nations Office on Drugs and Crime, Vienna: Austria.
Vandepitte, J., Lyerla, R., Dallabetta, G., Crabbe, F., Alary, M. and Buve, A. (2006) “Estimates of the number of female sex workers in different regions of the world”.
Sexually Transmitted Infections, 82(Supplement 3): 8-25.
Vermeulen, G., Balcaen, A., Di Nicola, A., Cauduro, A. (2006) The Siamsect Files: Standardised Templates and Blueprint for EU-wide collection of statistical information and analysis on missing and sexually exploited children and trafficking in human beings. Institute for International Research on Criminal Policy, Ghent University: Belgium. Wagenaar, H., Altink, S., Amesberger, H. (2013) Final Report on International Comparative
Study of Prostitution Policy: Austria and the Netherlands. Platform 31, The Hague: Netherlands.
136
Ward, H., Mercer, C. H., Wellings, K., Fenton, K., Erens, B., Copas, A., and Johnson, A. M. (2005) “Who pays for sex? An analysis of the increasing prevalence of female commercial sex contacts among men in Britain”. Sexually Transmitted Infections 81(6): 467-471.
A
PPENDIXTable 9. Distribution of the number of prostitutes per 100,000 EU female workers across countries (2010)
Estimate1A Estimate1B Estimate2B Estimate 2A Estimate 3B
Quartile 1 Quartile 1 Quartile 1 Quartile 1 Quartile 1
Slovenia 12,7 Latvia 27,6 Spain 55,9 Spain 42 Bulgaria 39,5 Latvia 11,5 Slovenia 25,4 Latvia 45,4 Croatia 12 Spain 31,4 Germany 11,4 Germany 23,6 Germany 24,5 Germany 9,18 Netherlands 30,8 Romania 10 Romania 21,6 Greece 16,5 Malta 8,81 Romania 24,6 Austria 8,4 Estonia 18,7 Austria 16 Belgium 8,27 Cyprus 22,1 Estonia 8,13 Austria 16 Portugal 15 Greece 8,26 Slovenia 11
Malta 8 Poland 13,6 Finland 13,8 Slovakia 8,01 Malta 10,6
Quartile 2 Quartile 2 Quartile 2 Quartile 2 Quartile 2
Poland 7,05 Malta 13,3 Czech Rep. 13,6 Bulgaria 7,72 Estonia 10
Lithuania 6,64 Hungary 13,2 EU-28 13,5 EU-28 7,71 Ireland 9,91 Spain 6,56 Croatia 13 Italy 13,3 Czech Rep. 7,09 Luxembourg 9,44
Hungary 6,5 Lithuania 12,9 Croatia 12 Latvia 6,82 France 9
Ireland 6,09 Bulgaria 12,3 Belgium 11 Italy 6,64 Greece 8,21
Greece 6,07 Greece 12,1 Cyprus 9,51 UK 6,56 EU-28 7,93
Cyprus 6 Spain 10,9 Hungary 9,36 Hungary 6,24 Denmark 5,72
Bulgaria 5,79 Cyprus 10 Malta 8,81 Cyprus 6,01 Germany 5,22
Quartile 3 Quartile 3 Quartile 3 Quartile 3 Quartile 3
Portugal 5,76 EU-28 10 Netherlands 8,81 Austria 5,94 Hungary 4,19
EU-28 5,59 Ireland 9,73 Romania 8,39 Luxembourg 5,61 Poland 4,09
Italy 5,2 Portugal 9,61 Slovakia 8,01 Finland 5,54 Austria 4
Croatia 5,17 Netherlands 9,35 Slovenia 7,87 Portugal 5,2 Czech Rep. 3,43
UK 5,14 Slovakia 8,18 Bulgaria 7,72 Denmark 4,49 Finland 3,36
Netherlands 4,88 UK 7,88 UK 6,56 Netherlands 4,41 Belgium 3,32 Slovakia 4,14 Czech Rep. 7,86 Luxembourg 5,61 Slovenia 3,94 Slovakia 3,14
Quartile 4 Quartile 4 Quartile 4 Quartile 4 Quartile 4
Belgium 3,97 Belgium 7,47 Denmark 4,49 Estonia 3,57 Lithuania 2,84
Czech Rep. 3,95 Luxembourg 6,4 Estonia 4,28 Lithuania 2,42 UK 1,95
Luxembourg 3,88 Denmark 5,74 France 2,66 France 1,77 Sweden 1,33 Denmark 2,94 Finland 4,75 Lithuania 2,42 Poland 1,73 Portugal 1,28 France 1,82 France 3,41 Poland 2,08 Romania 1,39 Latvia 1,27 Finland 1,62 Sweden 1,39 Ireland 1,26 Ireland 1,26 Italy 1,06 Sweden 0,00075 Italy 1,03 Sweden 0,747 Sweden 0,747 Croatia 1 5th widest gap 12.7/ 0.747 4th widest gap 27.6/ 1.03 1st widest gap 55.9/ 0.747 2nd widest gap 42/ 0.747 3 rd widest gap 39.5/ 1