Science Arts & Métiers (SAM)
is an open access repository that collects the work of Arts et Métiers Institute of Technology researchers and makes it freely available over the web where possible.
This is an author-deposited version published in: https://sam.ensam.eu
Handle ID: .http://hdl.handle.net/10985/8276
To cite this version :
Emmanuel RICHAUD, Pierre GILORMINI, Marie COQUILLAT, Jacques VERDU - Crosslink Density Changes during the Hydrolysis of Tridimensional Polyesters - Macromolecular Theory and Simulations - Vol. 23, n°5, p.320–330 - 2014
Full Paper
Crosslink density changes during the hydrolysis
of tridimensional polyesters
Emmanuel Richauda*, Pierre Gilorminia, Marie Coquillatb and Jacques Verdua
–––––––––
aPIMM, Arts et Métiers ParisTech, CNRS, 151 bd de l’Hôpital, 75013 Paris, France
bHerakles Groupe Safran, Centre de Recherches du Bouchet, 9 rue Lavoisier, 91710 Vert le
Petit, France
corresponding author : [email protected]
–––––––––
The hydrolysis of almost ideal networks based on macrodiols (poly(adipate of ethylene glycol)) of average molar mass about 2 kg/mol, with L=18 ester groups per chain has been studied. Tensile testing was used to evaluate the crosslink density through the statistical theory of rubber elasticity at two temperatures and three values of relative humidity. A kinetic model for ester consumption including an autocatalysis term was proposed and combined with two original approaches for modeling the crosslink density changes. This allowed kinetic parameters of hydrolysis to be determined, and very good predictions were obtained for the variations of crosslink density (or elastic modulus) in the three aging conditions considered. The initial curvature of elastic modulus vs. time was predicted positive for weak autocatalysis and negative for strong autocatalysis. The obtained conversion ratio at degelation was found to decrease sharply with the number of esters per elastically active chain.
1.
Introduction
Polymer networks containing ester groups in their backbone and having industrial applications belong mainly to three families: styrene crosslinked unsaturated (maleate-phthalate) polyesters, anhydride crosslinked epoxies (AEs), and isocyanates crosslinked aliphatic polyesters (IPs). All these materials are known to react with water, even in their usual applications. This “humid aging” aroused an abundant literature, especially in the case of unsaturated polyesters (UPs), owing to their practical interest in composite applications such as boat hulls, swimming pools, pipes and tanks. However, UPs are not well suited for theoretical studies: half the elastically active chains (polystyrene) are not hydrolysable, and hydrolysable (polyester) chains contain esters with at least two different reactivities. Initial samples contain noticeable quantities of free chain ends(1) and hydrolysis induces osmotic cracking(2,3), which complicates any analytical approach considerably. Complications are also involved in AE hydrolysis: they contain at least four kinds of elastically active chains (EACs) among which two are not hydrolysable, while each of the two others bear two ester groups. When the material is incompletely cured, three potentially hydrolysable groups coexist: anhydrides, epoxides and esters. Like UPs, common AEs are in glassy state at ambient temperature, and their hydrolysis products are not very stable at the temperatures where the statistical theory of rubber elasticity can be applied to their elastic properties. Finally, IP polyesters appear as the best candidates for basic investigations in the field of network hydrolysis. As a matter of fact, they can be in rubbery state at ambient temperature, quasi ideal (stoichiometric) networks can be synthesized where all the chains are polyesters (they differ only by their lengths), and very low concentrations of free chain ends can be obtained. Moreover, the average number L of esters per chain can be varied, which is 18 in the present work.
Three types of experimental methods are most frequently used in the study of polyester hydrolysis. Gravimetry has been applied for instance to PET(4), Polyamide 11(5) or polysilanols(6); it allows to deduce the hydrolysis rate readily from mass uptake if the formation of small (soluble) fragments can be neglected, i.e., at low conversions. Alternatively, nuclear magnetic resonance(7) and infrared(8) spectrometries can be used to measure the remaining ester concentration [e] by integrating the corresponding peak. Finally, hydrolysis can also be analyzed through its impact on the rubber elasticity of the network, since crosslink density is decreased by hydrolytic ester scissions in EACs. This is the method considered in this paper, where the elastic modulus is assumed to be proportional to the crosslink density, as stated by the statistical theory of rubber elasticity.
In an ideal network at low conversion, each hydrolysis event occurs on an EAC and the relationship between the hydrolysis rate and the decrease of crosslink density is very simple. For s chain scissions occurring on a system of n EACs (both quantities per mass unit), one has(9):
3 (1) if the network is trifunctional. As the hydrolysis conversion ratio x increases, the number of dangling chains also increases, and scissions on these chains lead to free (soluble) fragments. Since scissions on dangling or free chains do not modify crosslink density, the share of the “elastically active scissions”, i.e., scissions on EACs, decreases. The problem can be summarized by the following expression:
with (2)
where the change of crosslink density is the product of two terms. The first term (dx/dt) characterizes the chemical reaction and does not depend on the network structure, at least in a
first approximation, whereas the second term (dn/dx) does not depend on the hydrolysis kinetics involved. Combining (1) and (2), one obtains
3 since (3)
and, therefore:
3 (4) for a trifunctional network at low conversions. This simple equation raises several questions: What is its validity limit? Can this limit be extended by a simple model? Can the “degelation”(10) point be predicted, where the polymer becomes fully soluble? What are the characteristics of the soluble fraction? The variations of crosslink density in the early period of exposure (and the associated changes of thermo-mechanical properties) are important in aging problems. In addition, knowing the degelation point and the characteristics of the soluble fraction can be very useful in the chemical recycling of polyesters, especially in near-critical water(11-15), or for delignification in paper processing(16-18).
The most fruitful approach of network degradation consists in considering that degradation is exactly the opposite of polycondensation, with the network state obtained for a conversion ratio x of the degradation process being the same as the network produced for a conversion 1–
x of a (possibly virtual) polycondensation process(16-18). In these conditions, the basic theory of Flory-Stockmayer(19-21) can be used in a reversed manner. From a literature survey, this procedure appears to have been applied essentially to the characteristics of the soluble fraction and to the degelation point, the latter being reached when the weight average molar mass of the former reaches a maximum. For a network with a single reactive group per EAC, a Monte Carlo simulation has been performed by Galina and Lechowicz(22,23) and the degelation point has been obtained for a conversion ratio of xd = 0.45 close to the 1/2 value predicted by the
reversed Flory-Stockmayer theory. The hydrolysis of a polyester network with two ester groups per EAC was investigated experimentally by Argyropoulos and Bolker(24) with a degelation point, as deduced from the molar mass distribution of the sol, found close to the value (xd = 0.293) predicted by this theory. In the present paper, emphasis is put rather on crosslink density changes, which can be obtained from mechanical or solvent swelling measurements. Limited to small hydrolysis conversions, the proposed theory carefully differentiates x (the chemical variable) from n (the mechanical variable). Autocatalysis due to acid build-up is included, and special emphasis is put on the influence of the number of esters per primary chain.
The remainder of the paper is organized as follows. First, a kinetic model for autocatalyzed hydrolysis is presented for the first time, and two approaches of network degradation kinetics are developed. This theoretical part is followed by the presentation of the variations of the elastic modulus measured in three exposure conditions. The hydrolysis rate constants are deduced by fitting the model to the experiments, and they are discussed by comparing to literature values obtained on model compounds.
Theory
1.1. Hydrolysis kinetics
The reaction was assumed second order with respect to ester and water concentration in the first studies of polyester hydrolysis(25-27). The water concentration is supposed constant in most cases, nevertheless, and therefore hydrolysis is considered as a pseudo-first order reaction, so that ester concentration is expected to decrease exponentially. If hydrolysis reaches an equilibrium, this must occur at very high conversion, outside the domain of
practical interest, so that the reverse reaction (polycondensation) is ignored systematically. Water absorption measured on hydrolyzed PET samples(28) revealed an increase of equilibrium water concentration with hydrolysis conversion, as a result of the build-up of highly hydrophilic alcohol and acid groups that is expected to auto-accelerate the polymer degradation. However, autocatalysis is presumably the main cause of auto-acceleration in aliphatic polyesters, which are totally impermeable to ionic species coming from the environment(29,30) because of their relatively low polarity. By contrast, carboxylic acids resulting from ester hydrolysis are able to dissociate partially and to give H+ ions that can play a catalytic role. Antheunis et al.(31) have recently proposed to take this effect into account in a pseudo bimolecular model:
(5) where [ac] is the acid concentration. It is implicitly assumed that water concentration is constant and is included in the rate constant ka = kc [w], where kc would be a trimolecular rate constant (L2 mol-2 s-1). In order to work, this model requires a non-zero initial acid concentration. When the polyester has been synthesized with a diol excess, which is the case in the present study, the samples are acid-free initially and, according to (5), hydrolysis cannot start. The same objection applies to the model of Siparsky et al.(32), for instance. This is the reason why it is proposed here to add a term related to uncatalyzed hydrolysis in the rate expression:
(6) i.e., since each ester is transformed into an acid by hydrolysis:
which has the following analytical solution:
(8)
where
and . (9) Introducing a dimensionless autocatalysis ratio as
(10)
the following expression of the ester concentration is obtained:
. (11) The hydrolysis rate and its initial value are:
and . (12)
The conversion ratio is x = ([e]0 – [e])/[e]0, and thus:
and . (13) Let now the problem of a possible kinetics control by water diffusion be considered. The coupled diffusion-reaction kinetics is described by the following system of two equations:
(14)
where D is the coefficient of diffusion of water in the polymer (D = 2.910-10 m2 s-1 at 60°C, see section 2.2 below) and z is the layer depth. The boundary conditions are: [e] = [e]0 at t = 0
for every z, [w] = [w]s at t = 0 for every z, and [w] = [w]s at both z = 0 and z = h for every t. The above system can be solved numerically, but it can be noticed yet that the degraded layer thickness is a decreasing function of the hydrolysis rate; it is thus maximum at the onset of exposure, since hydrolysis is auto-accelerated. For x << 1/A, hydrolysis can be considered as a pseudo-first order process with rate constant k1 = ku [e]0, and the degraded layer thickness hD can be approximated by(33):
. (15)
The initial ester concentration is of the order of 10 mol L-1, and literature values of ku are of the order of 10-9 L mol-1 s-1 (see section 3 below), so that hD 170 mm, a value of the same order as the one found for poly(hydroxyl acids) (74 mm(34)). Although this is a rough approximation, no doubt, hydrolysis is very likely non-diffusion controlled (i.e., homogeneous) for samples with a thickness less than 5 mm.
1.2. Hydrolytic degradation and network structure
1.2.1. First approach
The early period of exposure is considered, where hydrolysis events occur essentially on primary elastically active chains (of type A containing esters of type a). In order to keep the present theory simple, only the average number L of ester groups per chain is considered, and the effect of dispersion is neglected, which is consistent with a limitation to small conversion ratios. Each hydrolysis event destroys one ester and transforms all other esters of the same chain into “inactive” ones, since their subsequent hydrolysis does not change crosslink density. Let [a] and sA denote the concentration of esters born by EACs and the number of scissions on EACs, respectively. The following relation yields readily:
(16) and, since esters are equireactive:
(17) so that, according to (10) and (11):
(18)
which leads finally to:
(19)
and the number of chain scissions is:
1 . (20) In the domain of low conversions, for a trifunctional network, each scission of an EAC induces the loss of three EACs(Fig. 1) and, since n0 = [e]0/L:
3 . (21)
Figure 1
Therefore, the initial rate of crosslink density decrease is given by:
i.e., the initial rate is three times the initial rate of hydrolysis, whatever the amount of autocatalysis. This does not involve any simplifying assumption.
Degelation occurs when crosslink density falls to zero, i.e., when:
(23)
which, combined with (13), leads to the following conversion ratio at degelation:
1 . / . (24) In contrast with (22), this relationship hinges on a simplifying hypothesis, since it assumes that only primary EACs are broken, whereas a great diversity of EACs is generated by chain scissions, and primary ones have probably disappeared totally when the system approaches degelation. It may be noted finally that, combining (13) and (24), degelation occurs when
.
Ln 1 1 . / . (25)
1.2.2. Second approach
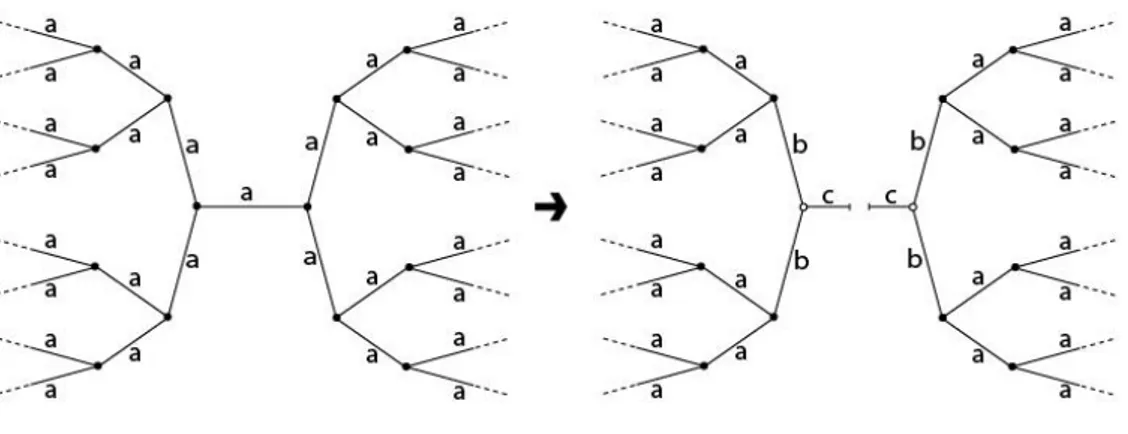
As already mentioned, the above approach is oversimplified since a single kind of chain scission (on primary EACs) is considered. Therefore, a more refined approach has been developed by including chain scissions on the secondary EACs (chains of type B containing esters of type b) that are produced by scissions on primary ones (Fig. 2). Actually, two kinds of A chains must be distinguished when chains of type B are present: those directly connected to B chains and the other ones. Scissions on these two kinds of A chains do not have exactly the same effects, but the difference is expected to be small at low conversions and will be neglected here. Scissions on dangling chains or soluble fragments (chains of type C) will also
be neglected. This model is expected to be valid at higher conversions than the first approach, but it must also lose its validity near degelation. Even so, the variations with respect to the first model are worth being studied up to degelation.
Figure 2.
The numbers of scissions occurring in chains of types A and B are considered; they are denoted sA and sB, respectively. The following relation applies, since scissions in chains of type C (dangling chains and soluble fragments) are neglected:
. (26)
Each scission on a chain A induces the loss of 5 chains of type A, i.e., 5L esters of type a. Each scission on a chain of type B induces the loss of 4 chains of type A, i.e., 4L esters of type a. Therefore:
5 4 . (27) Similarly, each scission on a chain A leads to the formation of 4L esters of type b, and each scission on a chain of type B leads to the formation of 2L esters of type b. Consequently:
4 2 . (28) Assuming that all esters are equireactive, the probability for a scission on a given type of ester is proportional to the molar fraction of this ester, so that:
and (29) where
and, therefore, the following system is obtained:
(31)
with [a] = [e]0 and [b] = 0 at t = 0. The analytical solution to this system can be written as cos √ √ sin √ exp √ sin √ exp (32) where, using (13), Ln Ln 1 . (33)
According to the basic assumptions of the present approach, the crosslink density n is given by (34) and, consequently, cos √ √ sin √ exp . (35)
The crosslink density cancels when
√ Arc tan √ . (36) and, therefore, according to (33), the conversion ratio at degelation is
1 . / (37) which occurs, according also to (13), when
.
Ln 1 1 . / . (38)
As shown below, the conversion ratio x1/2 for which the initial crosslink density is halved can be used to obtain the autocatalysis kinetic parameter. According to (35), this conversion ratio can be obtained by solving the following equation:
cos √
√ sin
√ exp
(39) which gives KLu= 0.1866 so that, according to (33):
⁄ 1 exp . 1 . / (40)
i.e., x1/2=1.031% when L=18. By combining (33) and (35), the rate of crosslink density decrease is given by:
cos
√
√ sin
√ exp
(41)
with, consequently, an initial value that is given by (22), like in the first approach. Moreover, the second derivative of the crosslink density can also be derived, and its initial value is
3 . (42)
Consequently, the initial curvature of crosslink density vs. time is negative in the case of strong autocatalysis, for A > L, whereas it is positive when autocatalysis is negligible. It may be noted that the first approach, using (21), also leads to (42). Since both approaches are equivalent in the early hours of exposure, only the second one will be considered in the following, because its domain of validity is expected to be larger.
2.
Experimental
2.1. Materials
The polyester under study is a polycondensate resulting from the reaction of 60% by weight adipic acid, 12% ethylene glycol and 28% diethylene glycol. The analysis of its molar weight distribution was performed by size-exclusion chromatography using a Waters 717+ machine with Styragel FR 4, HR 3, and HR 0.5 columns in series with a tetrahydrofuran (THF) flow rate of 1 mL min−1, and a Waters 2414 RI detection apparatus was used. The columns and detector temperatures were 40 and 35°C, respectively. Aliquots were prepared by dissolving samples of ca. 2 mg in 2 mL of THF (Chromassolv plus grade supplied by Sigma Aldrich). The injection volume was 20 μL. The Breeze software was used for data acquisition and analysis. The column was calibrated using monodisperse polystyrene standards with molar weights of 1200, 3070, and 7210 g mol-1. This lead to an average number L of esters per chains ca. 18 and to a polydispersity index of 1.7. It may be noted that additional SEC analyses were performed after keeping the prepolymer at 60°C in dry air for the same durations as in the humid aging experiments described below, and no variation of the molar mass was observed. This suggests that oxidation, as another possible degradation mechanism, was not active during our experiments. One possible reason is a very long induction period for this mechanism compared to the duration of the humid aging experiments performed.
This macrodiol was crosslinked 14 days at 50°C by a stoichiometric amount of benzene trisocyanate in molds to produce foils of 2 mm thickness. Dogbone H3 samples of calibrated length (20 mm) and width (4 mm) were cut from these foils.
2.2. Network characterization
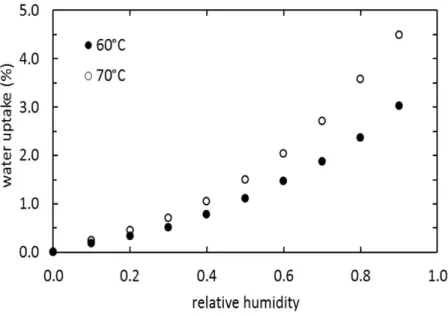
Uniaxial tension was performed at 20°C and at 8.3310-3 s-1 strain rate, using an INSTRON 4301 machine with a 100 N cell. The engineering stress F/S0 was recorded against (λ – λ-2), where λ denotes the draw ratio, so that the initial slope of the curve provided the shear modulus G (or G0 if the test is performed before humid aging). A value of the crosslink density n could then be deduced by applying the statistical theory of rubber elasticity(19). The polymer affinity with water was measured by keeping ca. 20 mg samples in air at 1 bar with fixed water partial pressures between 0 and 90% in a dynamic vapor sorption apparatus DVS-1000 from Surface Measurement Systems. The water uptake was recorded and the resulting sorption isotherms at 60 and 70°C are presented in Fig. 3. For given water activity, the water concentration [w] in mol.L-1 is obtained from:
. (43)
where m is the relative mass uptake (in percent) and ρ is the mass density of the wet polymer (in kg.L-1), taken equal to the mass density of the dry polymer in a first approximation. The specimens were exposed to humid aging under the following three conditions: 60°C, 29% RH; 60°C, 75% RH; 70°C, 25% RH. Temperatures were regulated at ± 1°C, and saturated salt solutions were used to regulate humidity: MgCl2, 6H2O, NaCl, for 25, 29, 75% RH, respectively. Water diffusivity was found almost constant in the moisture range investigated, about 2.910-10 m2 s-1 at 60°C.
3.
Results
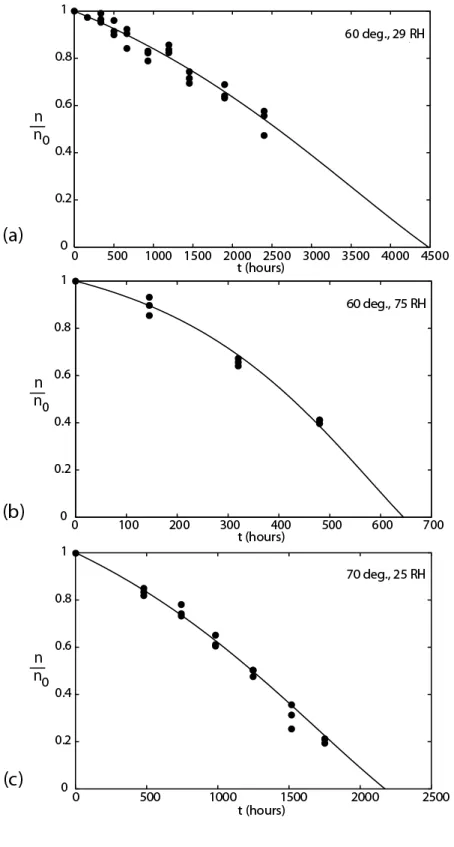
Each set of experimental conditions has been applied three times. The evolutions of the ratio of the crosslink density over its initial value (n/n0) vs. exposure time are shown in Fig. 4. A continuous decrease is observed, and the values between 1 and 0.5 can be fitted with parabolas
1 (44) with correlation coefficients larger than 0.95. The rate constant ku of uncatalyzed hydrolysis can be calculated from the initial slopes a1 by using (22):
. (45)
Table 1 reports the a1 values, the correlation coefficients of the parabolic fits, the water concentrations [w] interpolated from the sorption isotherms, and the ku values calculated from (46). The latter are found to be independent of relative humidity and to increase with temperature, as expected
The time for the crosslink density to reach half its initial value, t1/2, was interpolated between the closest points in Fig. 4. Due to the uncertainties involved, only round values are given in Table 1. Using (40), (13) and (45),
/ 0.01031 ⁄ /
⁄ / (46)
allows to adjust A numerically. The results are given in Table 1 in round numbers, since a ±5% variation on t1/2 induces up to 15% variations on A in the cases considered, and they confirm that hydrolysis is auto-accelerated. A behaves opposite to ku, since it increases with water activity and is almost independent of (or slightly decreasing with) temperature. The
predictions of the model (second approach) are plotted in Fig. 4, and a very good agreement with the experimental results can be observed.
Table 1. Figure 4.
4.
Discussion
The hydrolysis of polyester has often been found slightly or not auto-accelerated(1,4,8,25,35), which may explain why autocatalysis has rarely been taken into account in kinetic modeling. In a recent article, however, the simple equation (5) was proposed(31), assuming implicitly a constant water concentration included in the ka constant. When various experimental conditions are compared, the value of the water concentration cannot be ignored and (5) should be rewritten as:
. (47) This equation is plausible provided that acid groups are present at the very beginning of exposure and that autocatalysis is strong enough. Unfortunately, this equation cannot apply to the experiments presented in this paper, since there is no acid initially, and this motivated appending a non-catalyzed term in equation (6). [w] has been considered constant in the latter, which is probably an oversimplification because the build-up of acids and alcohols must increase the polymer hydrophily, like in vinyl ester networks(8) and PET(28) hydrolyses. This aspect will be examined elsewhere. For the sake of simplicity, it has been assumed here that parameter A includes all the causes of auto-acceleration, as well chemical (autocatalysis) as physical (increase of equilibrium water concentration).
This study uses crosslink density changes to obtain the kinetic parameters of hydrolysis, and the two approaches proposed here lead to the same relation (22) between the initial rate of crosslink density decrease and the uncatalyzed rate constant of hydrolysis. This is not surprising, since this expression does not involve any simplifying assumption. Therefore, its use can be recommended in practice to obtain ku inasmuch as the initial rate of crosslink density decrease can be measured precisely enough.
The ku values obtained here can be compared to values reported in the literature for relatively simple substrates, such as methyl formate and ethyl formate(36), ethyl acetate(12), several aliphatic methyl and butyl esters with carboxylate group ranging from 8 to 16 carbons(37), prepolymers for UP resins(38), PLA(39) and other aliphatic polyesters(40), and a polyester urethane(41). The ku values were deduced by using simple assumptions (first order kinetics for ester consumption at low conversion rate) and are plotted in Fig. 5, which calls for the following comments:
(i) The uncertainty on ku is ca. 2 decades, which is not surprising given the variety of substrates considered, with different hindrances of their ester groups.
(ii) The activation energy for hydrolysis is evaluated ca. 65 kJ mol-1, which is consistent with values already reported(36,42).
(iii) The values obtained in this work are in the lower range of the scatter, but the order of magnitude is reasonable.
Figure 5.
Only the second approach proposed here has been used to deduce the autocatalysis parameter
A, because it is more realistic than the first one, and its relation with the “half lifetime” t1/2 has been used among other alternative possibilities. Since t1/2 corresponds to low values of the conversion ratio (x1/2 ~ 1%), two important points can be noted: (i) at such low conversions,
some simplifying hypotheses are fully justified, like the constancy of water concentration for instance; and (ii) a relatively strong autocatalysis process is suggested by the fact that auto-acceleration is measurable at such low conversions.
Some ku and kc values have been reported in the literature for auto-catalyzed hydrolyses(12, 36-42). For instance, Krammer and Vogel(12) presented a plot for the hydrolysis of ethyl acetate,
which displays a curvature from which A can be assessed by using (11) and the time for consuming half the initial esters. Table 2 gathers the A values deduced from the above references, which range from ca. 20 to 5000.
Table 2.
It may be noted first that the largest values, deduced from(36), correspond to an extrapolation from the 250-350°C temperature range, which may explain their magnitudes at moderate temperature. Then, the effect of the exposure conditions on A can be interpreted tentatively as follows. Concerning the (small) negative temperature effect, one may refer to the definition (10) of A: this parameter is expected to obey Arrhenius law with an activation energy
, where Ec and Eu are the activation energies of catalyzed and uncatalyzed reactions, respectively. Since catalysis is likely to involve a decrease of the activation energy (Ec < Eu), A is expected to be a decreasing function of temperature, as observed indeed. Concerning now the effect of humidity, the following explanation can be proposed. Autocatalysis is due to the presence of H+ ions coming mainly from the dissociation of acids resulting from hydrolysis. The [H+] concentration depends essentially of two factors: the acid concentration, which is taken into account in the model, and the fraction of dissociated acids. The latter depends on the acid structure (inductive effects, etc.) and on the polarity of the medium (here the polymer matrix). This polarity is, no doubt, increased by absorbed water, acids are thus more and more efficient catalysts as water concentration increases in the
polymer, which may explain why A is doubled at 60°C when the relative humidity increases from 29% to 75%. Unfortunately, very little is known about the dissociation of organic acids in polymer matrices of low polarity.
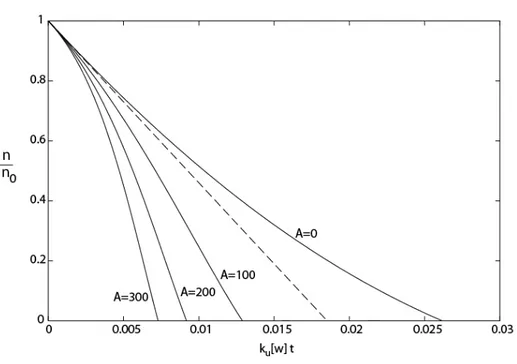
The kinetic model resulting from the second approach to simulate the variations of crosslink density is plotted in Fig. 6 with a dimensionless timescale, for L = 18 and several values of A. It may be observed first that the initial curvature is positive in the absence of autocatalysis or for low autocatalysis ratios (A < L according to (42)). Therefore, a negative initial curvature characterizes an autocatalytic behavior. Degelation can be defined by the crosslink density (and, therefore, the elastic modulus) vanishing completely, i.e., by the intersection of the curves of Fig. 6 with the time axis. Although the hypotheses on which the kinetic model is based lose their validity when the system approaches degelation, it can be assumed that correct trends are obtained for the variation of degelation time with structural parameters, especially with the number L of esters per initial elastically active chains, the role of which has been almost totally ignored in the literature. To illustrate this role, the conversion ratio xd at degelation has been computed for L = 1, 2 and 18 by applying the model (second approach). For L= 1, the result of a Monte Carlo simulation(22, 23) is available, and an experimental value(24) has been evaluated for L = 2 from the molar mass distribution in the soluble fraction. These two reference values are close to the predictions obtained by reversing the Flory-Stockmayer theory for network formation(19-21), as shown in Table 3. The model proposed here, which is able to consider large L values, deviates somewhat from the reference values, but the correct trend is obtained, i.e., xd decreases sharply when L increases (Table 3).
Figure 6.
5.
Conclusion
The hydrolysis of almost ideal networks based on macrodiols (poly(adipate of ethylene glycol)) of average molar mass about 2 kg/mol, with L=18 ester groups per chain, has been studied at 60°C, 29%RH; 60°C, 75%RH; and 70°C, 25%RH. The polymer degradation has been monitored by applying the statistical theory of rubber elasticity to deduce the crosslink density from tensile tests.
A kinetic model for ester consumption including autocatalysis has been elaborated, and two approaches for modeling crosslink density changes have been tested. Both approaches gave the same relationship between the initial rate of crosslink density decrease and the rate constant for uncatalyzed hydrolysis. The latter was found to be 2.010-9 L.mol-1.s-1 at 60°C and 4.810-9 L.mol-1.s-1 at 70°C. The exposure time for the elastic modulus to reach half its initial value allowed obtaining a dimensionless autocatalysis ratio of the order of 140 ± 10 at 25-29% RH and 350 at 75%RH.
Using these values for the kinetic parameters of hydrolysis, the proposed model provides a crosslink density decrease vs. exposure time that agrees very well with the experimental results. Moreover, two original outcomes have been obtained: (i) the conversion ratio at degelation is a sharply decreasing function of the number of esters per elastically active chain, and (ii) the initial curvature of the modulus vs. time plot is positive for weak autocatalysis and negative for strong autocatalysis. From a practical point of view, only the upper part of the modulus vs. time curve, i.e., for an elastic modulus larger than half its initial value typically, should be used to evaluate hydrolysis parameters from the model, since it is less reliable in the vicinity of degelation.
6.
Acknowledgement
The Délégation Générale de l’Armement is gratefully acknowledged for financial support.
7.
References
[1] B. Mortaigne, V. Bellenger, J. Verdu, Polym. Networks Blends 1992, 2, 187. [2] H.P. Abeisinghe, J.S. Ghotra, G. Pritchard, Composites 1983, 14, 57.
[3] L. Gautier, B. Mortaigne, V. Bellenger, J. Verdu, Polym. 1999, 41, 2481. [4] A. Launay, F. Thominette, J. Verdu, Polym. Degrad. Stab. 1994, 46, 319. [5] G. Serpe, N. Chaupart, J. Verdu, Polym. 1997, 38, 1911.
[6] L. Salmon, F. Thominette, M.F. Pays, J. Verdu, Compos. Sci. Technol. 1997, 57, 1119. [7] F.C .Jr. Schilling, W.M. Ringo, N.J.A. Sloane, F.A. Bovey, Macromolecules 1981, 14, 532.
[8] M. Ganem, B. Mortaigne, V. Bellenger, J. Verdu, Polym. Networks Blends 1994, 4, 115. [9] J.P. Pascault, H. Sautereau, J. Verdu, R. Williams, Thermosetting Polymers, Marcel Dekker, New York, 2002, p 420.
[10] J.F. Yan, D.C. Johnson, J Agr. Food Chem. 1980, 28, 850. [11] G.C. Tesoro, Y. Wu, Adv. Polym. Technol. 1993, 12, 185. [12] P. Krammer, H. Vogel, J. Supercrit. Fluid. 2000, 16, 189.
[14] R. Piñero-Hernanz, C. Dodds, J. Hyde, J. García-Serna, M. Poliakoff, E. Lester, M.J. Cocero, S. Kingman, S. Pickering, W.H. Wong, Compos. Part. A – Appl. S. 2008, 39, 454. [15] G. Oliveux, J.-L.Bailleul, E. Le Gal La Salle, N. Lefèvre, G. Biotteau, Polym. Degrad.
Stab. 2013, 98, 785.
[16] A. Szabo, D.A.I. Goring, Tappi 1968, 51, 440. [17] H.I. Bolker, H.S. Brenner, Science 1970, 70, 173.
[18] J.F. Yan, Macromolecules 1981, 14, 1438.
[19] P.J. Flory, Principles of Polymer Chemistry, Cornell University Press, Ithaca N.Y., 1953. [20] K. Dusek, in Telechelic Polymers: Synthesis and Applications (Ed: E. Goethals), CRC Press: Boca Raton, 1989, Chap 12.
[21] P. Gilormini, in The Sol-Gel Process (Ed: R.E. Morris), Nova Science Publishers Inc., New York, 2011, Chap 29.
[22] H. Galina, J. Lechowicz, Comput. Chem. 1998, 22, 39. [23] H. Galina, J. Lechowicz, Polym. Gels Networks 1998, 6, 103. [24] D.S. Argyropoulos, H.L. Bolker, Macromolecules 1987, 20, 2915.
[25] W. McMahon, H.A. Birdsall, G.A.Johnson, C.T. Camilli, J. Chem. Eng. Data 1959, 4, 57.
[26] C.G. Pitt, Z. Gu, J. Control. Release 1987, 4, 283.
[27] S. Lyu, R. Sparer, D. Untereker, J. Polym. Sci. Polym. Phys. 2005, 43, 383. [28] A. Ballara, J. Verdu, Polym. Degrad. Stab. 1989, 26, 361.
[29] D.A.S. Ravens, Polymer 1960, 1, 375.
[30] E.A. Schmitt, D.R. Flanagan, R.J. Linhardt, Macromolecules 1994, 27, 743.
[31] H. Antheunis, J.C.D. Van Meer, M. De Geus, W. Kingma, C.E. Koning,
Macromolecules 2009, 42, 2462.
[32] G.L. Siparsky, K.J. Voorhees, F. Miao, J. Env. Polym. Degrad. 1998, 6, 31.
[33] L. Audouin, V. Langlois, J. Verdu, J.C.M. de Bruijn, J. Mater. Sci. 1994, 29, 569. [34] F. von Burkersroda, L. Schedl, A. Göpferich, Biomaterials 2002, 23, 4221.
[35] C.A. Pryde, M.Y. Hellman, J. Appl. Polym. Sci. 1980, 25, 2573.
[36] O. Jogunola, T. Salmi, J. Wärnå, J.-P. Mikkola, Chem. Eng. Sci. 2012, 69, 201.
[37] P. Khuwijitjaru, T. Fujii, S. Adachi, Y. Kimura, R. Matsuno, Chem. Eng. J. 2004, 99, 1. [38] F. Bélan, V. Bellenger B. Mortaigne, J. Verdu, Polym. Degrad. Stab. 1997, 56, 301. [39] G. Gorrasi, R. Pantani, Polym. Degrad. Stab. 2013, 98, 1006.
[40] M. Partini, R. Pantani, Polym. Degrad. Stab. 2007, 92, 1491.
[41] D.G. Thompson, J.C. Osborn, E.M. Kober, J.R. Schoonover, Polym. Degrad. Stab. 2006, 91, 3360.
[42] O. Jogunola, T. Salmi, K. Eränen, J. Wärnå, J.-P. Mikkola, Chem. Eng. Proc. 2011, 50, 665.
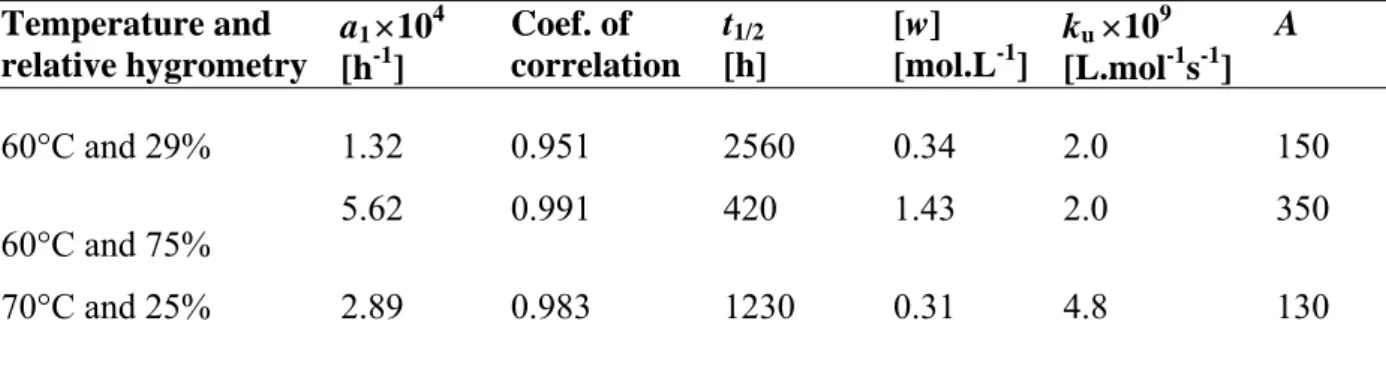
Table 1. Experimental data and kinetic parameters of hydrolysis ku and A according to the second approach (see text).
Temperature and relative hygrometry a1 104 [h-1] Coef. of correlation t1/2 [h] [w] [mol.L-1] ku 109 [L.mol-1s-1] A 60°C and 29% 1.32 0.951 2560 0.34 2.0 150 60°C and 75% 5.62 0.991 420 1.43 2.0 350 70°C and 25% 2.89 0.983 1230 0.31 4.8 130
Table 2. Autocatalysis constant A from literature data.
Substrate T (°C) H20 A Ref. Remark
Ethyl ethanoate 250 PH2O = 28 MPa 178.7 [12]
250 PH2O = 30 MPa 16.4
350 PH2O = 28 MPa 130.5
350 PH2O = 28 MPa 23.1
Ethyl formate 350 199.2 [36] Eu = 63.1 kJ.mol-1,
Ec = 45.4 kJ.mol-1
250 382.7
150 1001.1
50 4749.5
Ethyl formate 75 16.28 mol.L-1 46.5 [42] Eu = 74.5 kJ.mol-1,
Ec = 58.9 kJ.mol-1 Methyl formate 75 18.87 mol.L-1 103.8 [42] Eu = 64.4 kJ.mol-1,
Ec = 47.1 kJ.mol-1
Table 3. Conversion ratio xd at degelation according to the present model (second approach), to simulations or experiments from the literature, and to the reversed Flory-Stockmayer theory.
Number of ester groups per chain (L)
Present model (second approach) Simulations[22] or experiments[24] Flory-Stockmayer theory (reversed) 1 0.375 0.45[22] 0.500 2 0.21 > 0.288[24] 0.293 18 0.026 n.a. n.a.
Figure 1. Illustrating scheme for the loss of three elastically active chains resulting from one
chain scission.
Figure 4. Crosslink density variation (relative units) against time of exposure at: 60°C, 29%
RH (a); 60°C, 75% RH (b); 70°C, 25% RH (c) Symbols: experimental results. Curves: model (second approach).
Figure 5. Arrhenius plot of ku values from literature () and obtained in this work ().
Figure 6. Reduced crosslink density against reduced hydrolysis time for L=18 and several