HAL Id: hprints-00328246
https://hal-hprints.archives-ouvertes.fr/hprints-00328246
Submitted on 10 Oct 2008HAL is a multi-disciplinary open access archive for the deposit and dissemination of sci-entific research documents, whether they are pub-lished or not. The documents may come from teaching and research institutions in France or
L’archive ouverte pluridisciplinaire HAL, est destinée au dépôt et à la diffusion de documents scientifiques de niveau recherche, publiés ou non, émanant des établissements d’enseignement et de recherche français ou étrangers, des laboratoires
The Reference Return Ratio
Tove Faber Frandsen, Jeppe Nicolaisen
To cite this version:
Tove Faber Frandsen, Jeppe Nicolaisen. The Reference Return Ratio. Journal of Informetrics, Else-vier, 2008, 2 (2), pp.128-135. �hprints-00328246�
The Reference Return Ratio
Jeppe Nicolaisen
1and Tove Faber Frandsen
2The Royal School of Library and Information Science Birketinget 6, DK-2300 Copenhagen S., DENMARK
Abstract: The paper introduces a new journal impact measure called The Reference Return Ratio (3R). Unlike the traditional Journal Impact Factor (JIF), which is based on
calculations of publications and citations, the new measure is based on calculations of bibliographic investments (references) and returns (citations). A comparative study of the two measures shows a strong relationship between the 3R and the JIF. Yet, the 3R appears to correct for citation habits, citation dynamics, and composition of document types – problems that typically are raised against the JIF. In addition, contrary to traditional impact measures, the 3R can not be manipulated ad infinitum through journal self-citations.
1. Introduction
In his paper on the history of the development of the journal impact factor (JIF), Cameron (2005) highlights the usage of the measure in academia. He makes clear that the measure was originally invented to assist the Institute for Scientific Information (ISI) in selecting journals for coverage in their various products. It was NOT intended to be used for other purposes. Yet, Cameron (2005, p. 113) concludes that “[w]e are left in a situation where impact factors are now routinely used to evaluate scientists, departments, entire institutions, and even nations”. Over the years, a number of alternative journal impact measures have been proposed (consult e.g. Glänzel & Moed, 2002). However, none of these measures appear to have had much impact on bibliometric research including research evaluation. Moed (2005, p. 1995) notes that “the […] journal impact measure is nowadays so widely dispersed and so frequently used that it seems difficult, if not impossible, to have it replaced by a single alternative measure, especially in the near future”. We fully agree. Moreover, as pointed out by Rousseau (2002), the quality of a journal is a multifaceted notion necessitating a whole battery of indicators. The aim of this paper is consequently not to introduce a single measure that can fully replace the JIF, but instead to present and discuss an additional measure for the battery.
1
The measure introduced here is called The Reference Return Ratio (3R). It is based partly on an existing impact measure (the citation factor (Yanovsky, 1981)), yet developed further. It is well known that the average number and age of references per article affect the probability of being cited (see, e.g., Moed et al., 1983; Seglen, 1997). In the following we intend to demonstrate, that by taking the number and age of references into account, the 3R avoids some of the problems facing the traditional impact measures, and, consequently, that the 3R is a noteworthy supplement.
2. Related
measures
Arguing that “it is better to make quantitative comparison of citations with citations and articles with articles”, Yanovsky (1981, p. 229) proposed the ‘citation factor’.
The citation factor is denoted as CF(Y), and defined as:
( )
( )
( )
0 0 , , Y i Y i CIT Y i CF Y REF Y i = = =∑
∑
(1)CIT (Y,X) denotes the number of citations received in the year Y, by articles published in the year X. Similarly, REF(Y,Z) denotes the number of references in the articles published by the same journal in the year Z. The citation factor CF(2004) of journal J is thus calculated by dividing the number of references cited by J in 2004 with the citations received by J in 2004
It should be noted that similar measures have been suggested by others. Pinski and Narin (1976) introduced a measure similar to the citation factor of Yanovsky but excluding self-citations. This indicator measures “the influence weight of the journal, a size independent measure of the weighted number of citations a journal receives from other journals, normalized by the number of references it gives to other journals” (Pinski & Narin, 1976, p. 298). Price (1981) proposed a method for analyzing square matrices. In the worked examples “each nation or journal has an export size, an import size and some sort of self-interest (e.g. self-citation)” (Price, 1981, p. 62). The method is based on interaction and the degree of interdependence between the journals included. However, the model only considers the import and export between the included journals and does not consider the investments and returns of the single journal.
The suitability of the citation factor in journal evaluation is restricted. Although Yanovsky’s measure is appealing at first sight, it suffers nonetheless from an important problem. It operates with identical time periods in both the numerator and the denominator. For instance, in one of his examples, Yanovsky (1981, p. 229) computes the citation factor of a journal by weighting the
journal’s 874 cited references in the year 1975 against the 256 citations received by the same journal in 1975. Today, there seem to be general agreement about the necessity for operating with longer time windows. Glänzel and Schoepflin (1995) conclude that a three-year citation window is a good compromise between the fast obsolescence of some fields (e.g., nanotechnology) and the slow obsolescence of other fields (e.g., theoretical mathematics). Consequently, we suggest expanding the citation window to three years and to use the following notation:
np denotes the length of the publication period
nc denotes the length of the citation window
Yp is the first year of the publication period
Yc is the first year of the citation period
Then the reference impact factor of an article set S is denoted as R-IFs(np,nc,Yp,Yc), and defined as:
(
)
1 1 0 0 1 0 ( , ) , , , ( ) p c p n n c p i k S p c p c n p i CIT Y k Y i R IF n n Y Y REF Y i − − = = − = + + − = +∑ ∑
∑
(2)Calculating an R-IF is done using the same data in the numerator, but exchanging the data on citable items in the denominator with data on references in the same or all publications. An R-IF(5,5,2000,2000) is to be understood as the number of citations received in the years 2000-2004, by articles published in the years 2000-2004 divided by the total number of references in publications published in 2000-2004. Although this measure is definitely more suitable than the first, it still gives an unfair advantage to journals in fast obsolescence fields.
3.
The Reference Return Ratio
The traditional JIF and related impact measures (e.g. the aforementioned R-IF) favor journals that publish in fast obsolescence fields – i.e. fields in which ideas are turned over quickly or where knowledge is added to frequently. Seglen (1997) has, for instance, pointed out that in highly dynamic research fields, such as biochemistry and molecular biology, where published reports rapidly become obsolete, a large proportion of citations are captured by the two-year citation window traditionally used to calculate JIFs. However, fields with a more long-lasting literature, such as mathematics, have a smaller fraction of short term citations and hence lower journal impact factors. He consequently concludes that “citation habits and citation dynamics can be so different in
different research fields as to make evaluative comparisons on the basis of citation rate or journal impact difficult or impossible” (Seglen, 1997, p. 501).
Seglen (1997) raises other problems that face the JIF. Among these is the well-known problem related to the composition of document types. Review articles have been found to be heavily cited and to inflate the impact factor of other journals, and long articles have been found to collect many citations and to produce high journal impact factors.
We believe that the problems of citation habits, citation dynamics, and composition of document types may be dealt with at least to some extent by modifying the denominator of the R-IF. Instead of counting all references in the denominator, we suggest employing a reference period. This small adjustment ensures more equal evaluation conditions. Journals that publish research in fields in which ideas turn over quickly cite a high proportion of recent publications and receive a high proportion of citations soon after being published. Conversely, journals in fields characterized by long-lasting literature cite a small proportion of recent publications and receive a small proportion of citations soon after being published. Thus, by establishing the 3R on short-term bibliographic investments (references) and returns (citations) it should be possible to correct for both the problem of citation habits and the problem of citation dynamics. The problems related to composition of document types also seems to be adjusted for as the high citation rates of review articles and long articles are balanced by the extensive reference lists normally produced by these document types.
The modified notation is as follows:
np denotes the length of the publication period
nc denotes the length of the citation window
nr denotes the length of the reference period
Yp is the first year of the publication period
Yc is the first year of the citation period
Yr is the first year of the reference period
The 3R of an article set is consequently denoted as 3R(np,nc,nr,Yp,Yc,Yr) and defined as:
(
)
1 1 0 0 1 1 0 0 ( , ) 3 , , , , , ( , ) p c p r n n c p i k S p c r p c r n n r p j i CIT Y k Y i R n n n Y Y Y REF Y j Y i − − = = − − = = + + = + +∑ ∑
∑ ∑
(3)A 3R(2,2,2,2002,2004,2000) is to be understood as the number of citations received in 2004-2005, by articles published in 2003 divided by the number of references in publications from 2002-2003 to publications published in 2000-2001.
In the following example we illustrate the calculation of the 3R using a selection of economics journals.
4. 3R
contra
JIF
The following comparative study investigates the characteristics of the 3R and relates it to the JIF using multiple linear regressions on a larger data set.
4.1 Data
The comparative study is based on data from 32 economics journals. 3Rs are calculated for 1986, 1988, 1990, 1992, 1994, 1996, 1998, 2000 and 2002. A publication period of 1 year, a citation window of 3 years and a reference period of 3 years are employed. The 3R for 1990 is denoted as 3R(1,3,3,1990,1990,1988), which implies that the total number of citations received in 1990-1992, by articles published in 1990 is divided by the number of references in publications from 1990 to publications published in 1988-1990. In addition, a 3-year diachronous JIF is calculated. The JIF calculation for 1990 is denoted as IF(1,3,1990,1990) which indicates that the number of citations received in 1990-1992 to publications published in 1990 is divided by the number of citable units published in 1990.
A number of variables have been added to test the robustness of the two measures. A short description of the variables is offered in the following (for further explanation consult Frandsen, 2007):
• The composition of document types each year. Documents are divided into 7 categories (article, review, letter, note, editorial, book review, and other). The categories consist of just the document type indicated in the category label. The only exception is the ‘other’ category that consists of discussion, item about an individual and that sort of publications. These document types are aggregated as there are so few of them, and as the use of them varies considerably over the years.
• The total number of publications of each journal
• The number of documents included by the ISI (article, review and note) and their share of the total number of documents.
• Geographic location of journal • Share of publications not in English
• Self-citing rate
• Self-cited rate (transformed). The variable is transformed as the relationship is non-linear. The transformation is done as follows: 1 divided by self-cited rate. Consequently a much better fit is achieved.
The three citation indexes (Arts & Humanities Citation Index (A&HCI), Science Citation Index (SCI) and Social Sciences Citation Index (SSCI)) were used in order to retrieve citations received from outside the discipline. However, it is important to keep in mind that only citations from journals covered by ISI are retrieved.
4.2 Results
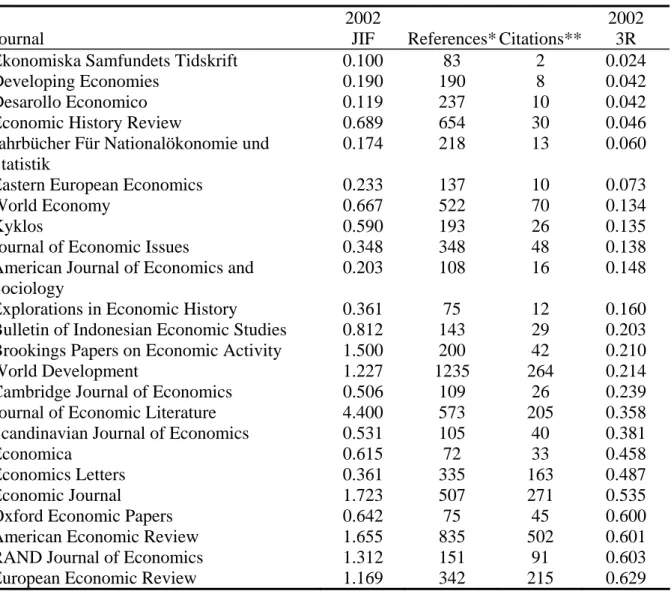
Table I displays the journals sorted by 3R, the references and citations used in the calculation of 3R, and JIF.
Table I. JIFs and 3R for a selection of economics journals
Journal
2002
JIF References*Citations**
2002 3R Ekonomiska Samfundets Tidskrift 0.100 83 2 0.024 Developing Economies 0.190 190 8 0.042 Desarollo Economico 0.119 237 10 0.042 Economic History Review 0.689 654 30 0.046 Jahrbücher Für Nationalökonomie und
Statistik
0.174 218 13 0.060
Eastern European Economics 0.233 137 10 0.073
World Economy 0.667 522 70 0.134
Kyklos 0.590 193 26 0.135
Journal of Economic Issues 0.348 348 48 0.138 American Journal of Economics and
Sociology
0.203 108 16 0.148
Explorations in Economic History 0.361 75 12 0.160 Bulletin of Indonesian Economic Studies 0.812 143 29 0.203 Brookings Papers on Economic Activity 1.500 200 42 0.210 World Development 1.227 1235 264 0.214 Cambridge Journal of Economics 0.506 109 26 0.239 Journal of Economic Literature 4.400 573 205 0.358 Scandinavian Journal of Economics 0.531 105 40 0.381
Economica 0.615 72 33 0.458
Economics Letters 0.361 335 163 0.487 Economic Journal 1.723 507 271 0.535 Oxford Economic Papers 0.642 75 45 0.600 American Economic Review 1.655 835 502 0.601 RAND Journal of Economics 1.312 151 91 0.603 European Economic Review 1.169 342 215 0.629
Journal of Econometrics 1.320 290 209 0.721 Review of Economic Studies 1.789 152 127 0.836 Journal of Economic Theory 0.816 307 299 0.974 International Economic Review 0.817 84 84 1.000
Econometrica 2.163 350 423 1.209
Review of Economics and Statistics 1.383 149 182 1.221 Journal of political Economy 2.622 205 281 1.371
* The number of references in publications from 2002 to publications published in 2000-2001 ** The number of citations received in 2002, by articles published in 2000-2002
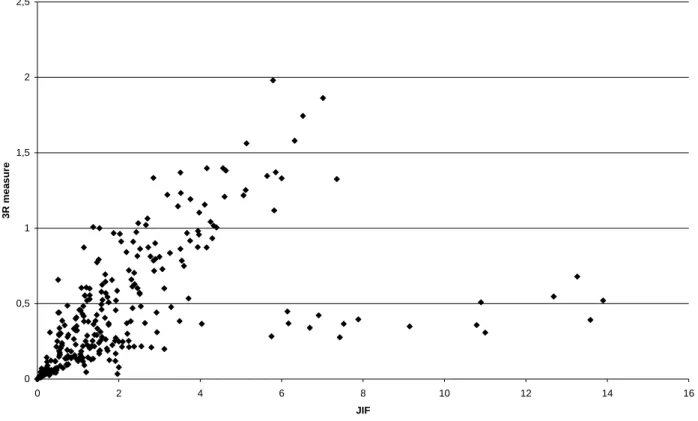
Figure I illustrates a strong relationship between the 3R and the JIF. The strong relationship is expected as the numerator in both expressions is identical. However, the correlation is not complete. A number of journals with very high JIFs score relatively low on 3R. Further analysis revealed that in some cases it is journals containing a considerable amount of ‘not citable units’ (publications not included in the calculation of JIF). In other cases it was journals publishing a very low number of relative lengthy articles each year. An example is Brookings Papers on Economic Activity that published 12 publications in 2000 with an average length of 58 pages.
0 0,5 1 1,5 2 2,5 0 2 4 6 8 10 12 14 16 JIF 3R m e a s ure
Using a univariate regression analysis to test the correlation, we find the coefficient of the dependent variable to be 0.102 with a p-value <0.01. Other central information in the outcome is the R square of the model that summarizes the fit of the model. In this case the R square of the model is 0.452, which indicates that we are able to explain 45.2 per cent of the variance in the data set. The 3R is not perfectly correlated with the JIF and thus that the two indicators are not describing identical phenomena.
As described earlier, one of the characteristics of the 3R is that it does not directly distinguish between different document types in the denominator as done in the ISI JIF. Indirectly it does, however, since different document types tend to contain more or less references. It is well known that document types that typically cite a low number of references also typically are less cited (e.g. book reviews (Diodato, 1984; Nicolaisen, 2002)), while document types that typically cite a high number of references typically are also more cited (e.g. review articles (Garfield, 1972; Moed, Van Leeuwen & Reedijk, 1996.). We would thus expect the composition of document types to be less influential. Figure I lend some credence to the hypothesis. The two indicators seem to treat journals with certain compositions of document types differently. Table II and III present the results of univariate and multivariate linear regression analyses investigating the influence of 3R and JIF by composition of document types.
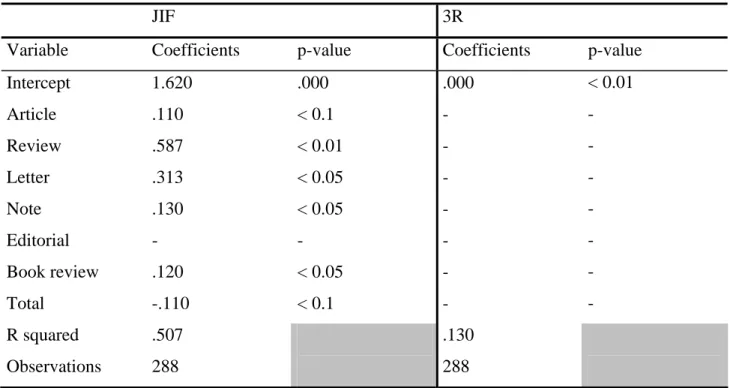
Table II. Multivariate linear regression analysis. Dependent variable is JIF and 3R.
JIF 3R
Variable Coefficients p-value Coefficients p-value Intercept 1.620 .000 .000 < 0.01 Article .110 < 0.1 - - Review .587 < 0.01 - - Letter .313 < 0.05 - - Note .130 < 0.05 - - Editorial - - - - Book review .120 < 0.05 - - Total -.110 < 0.1 - - R squared .507 .130 Observations 288 288
First of all, the substantial differences in R squares are noticeable. In the case of JIF we are able to explain 50 per cent of the variation in the dataset by composition of document types as many of the
variables proved to be significantly influential on JIF. However, in the case of the 3R we are only able to explain 13 per cent of the variation in the data set because none of the document types nor the total proved to be significantly influential on the 3R. As expected the 3R is not under influence of the composition of document types and this leads us to suggest that the 3R do correct for composition of document types. The various document types are characterized by different patterns in the number of references and this is why JIF and the 3R are so closely related. Although highly related, they describe different aspects of journals as illustrated by the fact that JIF is influenced by composition of document types whereas the 3R is not.
Before introducing the outputs of the two final models we have to make a note concerning the document types. We tried running the models including all the document types but the high number of variables weakened the model considerably and very few turned out to contribute to the understanding of JIF and the 3R. Therefore we only include the document types in aggregated forms. We investigate the influence of the total number of publications, the number of publications with the most scientific content (citable units and the share of these publications). The data and the results of the analysis of JIF presented in table III are only described and analyzed in relations to the output of the similar regression of the 3R as the analysis of JIF is done with very similar results in Frandsen (2007).
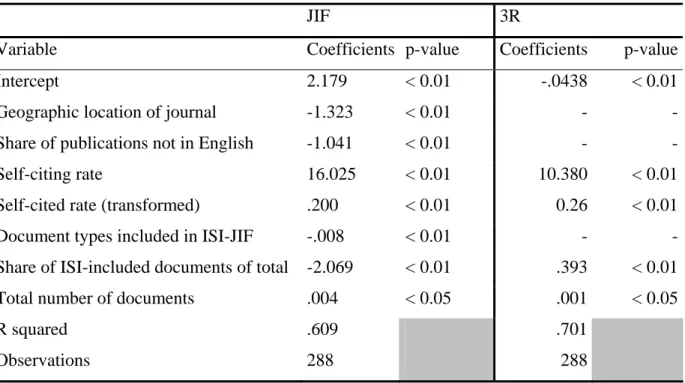
Table III. Multivariate linear regression analysis of 3-year diachronous JIF and 3R
JIF 3R
Variable Coefficients p-value Coefficients p-value Intercept 2.179 < 0.01 -.0438 < 0.01
Geographic location of journal -1.323 < 0.01 - -Share of publications not in English -1.041 < 0.01 - -Self-citing rate 16.025 < 0.01 10.380 < 0.01 Self-cited rate (transformed) .200 < 0.01 0.26 < 0.01 Document types included in ISI-JIF -.008 < 0.01 - -Share of ISI-included documents of total -2.069 < 0.01 .393 < 0.01 Total number of documents .004 < 0.05 .001 < 0.05
R squared .609 .701
Both models have relatively high R squares which indicate that the model is a good fit. We are able to explain 60 and 70 per cent of the variations in the datasets.
Both the JIF and the 3R are positively correlated with the total number of publications. The coefficient of .001 of the 3R is to be understood like this: If a journal editor increases the total number of documents published in the journal each year by 10 we will expect to see an increase in the 3R by .01. The variables describing the self-citing rate and self-cited rate are affecting the distribution of the two measures across journals similarly for both indicators. Consequently, A journal may boost its JIF and 3R by journal self-citations. However, contrary to other impact measures, the 3R can not be manipulated ad infinitum. The self-citation manipulation maximum is 1.0 as all self-citations are also ‘self references’ and thus counted in both the numerator and denominator of the 3R.
The variable describing geographic location is negatively correlated with JIF but no correlation is found with the 3R. This is also the case with the variable describing the share of publications not written in English. As the multiple linear regression only presents statistical tendencies in the data set further research is needed if we are to understand why the 3R is not negatively correlated with these variables as the JIF is.
Furthermore, JIF is negatively correlated with the number of documents included in the calculation of the ISI JIF. The coefficient of -.008 implies that an increase in the number of documents included in the ISI calculation of JIF by 100 the JIF leads to a decrease in JIF by 0.8. This aspect is further described by the variable of the share of document types included in the ISI calculation of JIF as it is also significant at the 0.01 level and the coefficient is negative. We interpret the correlation of these two variables combined with the coefficient of the variable describing the total number of documents as: An increase in the total number of documents (excluding the publications included in the ISI calculation of JIF) will lead to an increase in JIF all other things being equal. The 3R is not correlated with the number of documents included in the calculation of the ISI JIF. Opposite to the JIF, the variable of the share of document types included in the ISI calculation of JIF is positively correlated with the 3R. We interpret this as: An increase in the total number of documents (regardless of being included in the ISI calculation of JIF) will lead to an increase in the 3R.
In the results we can see that some of the characteristics of JIF are the same when we analyze the 3R. The variables describing the number of publications, the self-citing rate and the self-cited rate are affecting the distribution of the two measures across journals similarly. Furthermore the results clearly support our initial hypothesis that the 3R is not influenced by the composition of document types. Finally, the variables describing geographic location of the journal and the share of publications not written in English do not affect the distribution of the two measures across journals similarly.
5.
Discussion and conclusion
Traditionally, impact has been measured in the currency of received citations. Authors, journals, institutions, and countries are frequently evaluated and compared using this yardstick. The success of the individual is relative to the success of ‘the others’ - just like personal success in all markets is relative to the success of the other players.
The market analogy is not a new construct in bibliometrics. It has, for instance, been used before as a starting point for explaining citation behavior. In fact, both supporters and skeptics of citation analysis have used the analogy to argue their cases. Merton (1979, p. viii) argued, for instance, that “[c]itations and references operate within a jointly cognitive and moral framework. In their cognitive aspect, they are designed to provide the historical lineage of knowledge and to guide readers of new work to sources they may want to check or draw upon for themselves. In their moral aspect, they are designed to repay intellectual debts in the only form in which this can be done: through open acknowledgment of them”. Merton’s view on citations and references was consequently based on the idea that science resembles a market where scientists are supposed to exchange information in the form of publications for recognition in the form of citations. It echoes Hagstrom’s (1965) idea that the process is a form of barter.
Among the skeptics, Law and Williams (1982, p. 543) have equated scientists’ choice of references to that of “packaging a product for market”, and MacRoberts and MacRoberts (1996, p. 440-441) have stated that “papers are meant to sell a product” and, consequently, that “[a]n author’s main objective is not to cite their influences but to present as authoritative an argument as possible”. These claims are in line with the so-called ‘persuasion hypothesis’ (Gilbert, 1977) - the idea that persuasion in science and scholarship relies on misleading manipulation indistinguishable from commercial advertising.
Although supporters and skeptics of citation analysis clearly disagree over how the market mechanisms work, they seem to agree that references and citations at least possess some value or worth. This belief is shared by a number of economists. Diamond (1986) has actually tried to establish the worth of a citation by studying the relationship between salaries and number of citations among scientists, and Toutkoushian (1994) has used citation counts to measure sex discrimination in faculty salaries.
Intuitively, the market analogy also makes sense as a theoretical framework for the 3R. There is a clear association between bibliographic investment (references) and return (citations). Yet, the fact that the ISI citation indexes are not representing a closed market may limit the practical potentials of the market analogy.
Our results show that there is a strong relationship between the 3R and the JIF. Yet, the 3R appears to correct for citation habits, citation dynamics, and composition of document types – problems that typically are raised against the JIF. In addition, contrary to traditional impact measures, the 3R can not be manipulated ad infinitum through journal self-citations.
Although the 3R avoids some of the problems facing the traditional JIF and related impact measures, it also faces some of the same problems and challenges. As pointed out by Case and Higgins (2000, p. 636), “citing a seminal discovery or a methodological breakthrough certainly is more important than citing other investigators who have pursued the same topic”. Yet, as most other citation measures, the 3R does not take the varied purposes of references and citations into account. Instead, all references and citations are treated as functionally equivalent. However, there is nothing to prevent the 3R from being applied to the measuring of weighted references and citations as well. One would only have to obtain the relevant data3.
A potentially more important problem concerns the possible biases of editorial practices. The citation counts of the 3R are influenced by the editorial practices of many journals whereas the reference counts are affected by the editorial practices of just a single journal. Consequently, special editorial practices could potentially affect the referencing practices of the authors writing for a particular journal, and thus the results of its 3R. However, an extensive search for literature that could facilitate an estimation of the magnitude of this potential problem retrieved no results of relevance.
Acknowledgements
The authors would like to thank Ronald Rousseau and two anonymous referees for their valuable comments.
References
Cameron, B.D. (2005). Trends in the usage of ISI bibliometric data: Uses, abuses, and implications.
Libraries and the Academy, 5(1): 105-125.
Case, D.O & Higgins, G.M. (2000). How can we investigate citation behavior?: A study of reasons for citing literature in communication. Journal of the American Society for Information
Science, 51(7): 635-645.
Diamond, A.M. (1986). What is a citation worth? Journal of Human Resources, 21(2): 200-215. Diodato, V. (1984). Impact and scholarliness in arts and humanities book reviews: A citation
analysis. Proceedings of the 47th ASIS Annual Meeting: 217-220.
Frandsen, T.F. (2007). Journal self-citations: Analysing the JIF mechanism. Journal of Informetrics, 1(1): 47-58.
Garfield, E. (1972). Citation analysis as a tool in journal evaluation. Science, 178: 471-479. Gilbert, G.N. (1977). Referencing as persuasion. Social Studies of Science, 7: 113-122.
Glänzel, W. & Moed, H.F. (2002). Journal impact measures in bibliometric research.
Scientometrics, 53, 171-193.
Glänzel, W. & Schoepflin, U. (1995). A bibliometric study on ageing and reception processes of scientific literature. Journal of Information Science, 21(1): 37-53.
Hagstrom, W.O. (1965). The Scientific Community. New York, NY: Basic Books.
Law, J. & Williams, R.J. (1982). Putting facts together: A study in scientific persuasion. Social
Studies of Science, 12: 535-558.
MacRoberts, M.H. & MacRoberts, B.R. (1996). Problems of citation analysis. Scientometrics, 36: 435-444.
Merton, R.K. (1979). Foreword. In: Garfield, E. (ed.), Citation Indexing: Its Theory and
Application in Science, Technology and Humanities. New York, NY: Wiley: vii-xi.
Moed, H.F. (2005). Citation analysis of scientific journals and journal impact measures. Current
Science, 89(12): 1990-1996.
Moed, H.F., Van Leeuwen, T.N. & Reedijk, J.A. (1996). A critical analysis of the journal impact factors of Angewandte Chemie and the Journal of the American Chemical Society:
Inaccuracies in published impact factors based on overall citations only. Scientometrics, 37(5): 105-116.
Moed H.F., Burger, W.J.M., Frankfort, J.G. & van Raan, A.F.J. (1983). On the Measurement of
Research Performance: The Use of Bibliometric Indicators. Leiden: Leiden University.
Nicolaisen, J. (2002). The scholarliness of published peer reviews: A bibliometric study of book reviews in selected social science fields. Research Evaluation, 11(3): 129-140.
Pinski, G. & Narin, F. (1976). Citation influence for journal aggregates of scientific publications: Theory, with applications to the literature of physics. Information Processing and
Management, 12(5): 297-312.
Price, D.J. de Solla (1981). The analysis of square matrices of scientometric transactions.
Scientometrics, 3(1): 55-63.
Rousseau, R. (2002). Journal evaluation: Technical and practical issues. Library Trends, 50(3): 418-439.
Seglen, P.O. (1997). Why the impact factor of journals should not be used for evaluating research.
British Medical Journal, 314: 498-502.
Smith, L.C. (1981). Citation analysis. Library Trends, 30(1): 83-106.
Toutkoushian, R. (1994). Using citations to measure sex discrimination in faculty salaries. Review
of Higher Education, 18(1): 61-82.
Yanovsky, V.I. (1981). Citation analysis significance of scientific journals. Scientometrics, 3(3): 223-233.