HAL Id: tel-02400947
https://pastel.archives-ouvertes.fr/tel-02400947
Submitted on 9 Dec 2019HAL is a multi-disciplinary open access archive for the deposit and dissemination of sci-entific research documents, whether they are pub-lished or not. The documents may come from teaching and research institutions in France or abroad, or from public or private research centers.
L’archive ouverte pluridisciplinaire HAL, est destinée au dépôt et à la diffusion de documents scientifiques de niveau recherche, publiés ou non, émanant des établissements d’enseignement et de recherche français ou étrangers, des laboratoires publics ou privés.
Experimental characterization and modeling of airflow
and heat transfer in a closed refrigerated display cabinet
Nattawut Chaomuang
To cite this version:
Nattawut Chaomuang. Experimental characterization and modeling of airflow and heat transfer in a closed refrigerated display cabinet. Chemical and Process Engineering. Institut agronomique, vétéri-naire et forestier de France, 2019. English. �NNT : 2019IAVF0017�. �tel-02400947�
NNT: 2019IAVF0017
THÈSE DE DOCTORAT
préparée à l’Institut des sciences et industries du vivant et de l’environnement
(AgroParisTech)
pour obtenir le grade de
Docteur de l’Institut agronomique, vétérinaire et forestier
de France
Spécialité : Génie des procédés
École doctorale n°581
Agriculture, alimentation, biologie, environnement et santé (ABIES)
par
Nattawut CHAOMUANG
Caractérisation expérimentale et modélisation des
écoulements d’air et transferts thermiques dans un meuble
frigorifique fermé
Directrice de thèse : Onrawee LAGUERRE Codirecteur de la thèse : Denis FLICK
Thèse présentée et soutenue à Paris, le 16 septembre 2019 Composition du jury:
M. Jocelyn BONJOUR, Professeur, INSA de Lyon, France Président
M. Giovanni CORTELLA, Professeur, University of Udine, Italie Rapporteur
M. Pedro Dinis GASPAR, Professeur associé, University of Beira Interior, Portugal Rapporteur
Mme Onrawee LAGUERRE, Directrice de recherche, Irstea, France Directrice de thèse
M. Denis FLICK, Professeur, AgroParisTech, France Codirecteur de thèse
M. Alexandre MISKIZAK,Responsable R&D, EPTA, France Membre invitée
UR FRISE - IRSTEA
1 rue Pierre-Gilles de Gennes CS 10030 92761 Antony cedex
NNT: 2019IAVF0017
DOCTORAL THESIS
submitted to Paris Institute of Technology for Life, Food and Environmental Sciences (AgroParisTech)
in fulfilment of the requirements for the degree ofDoctor of Philosophy in
Institute of Agricultural, Veterinary and Forestry of France
Specialty: Process EngineeringDoctoral school No. 581:
Agriculture, Food, Biology, Environment and Health (ABIES)
By
Nattawut CHAOMUANG
Experimental characterization and modeling of airflow and
heat transfer in a closed refrigerated display cabinet
Thesis director: Onrawee LAGUERRE Thesis co-director: Denis FLICK
Thesis presented in Paris, September 16, 2019 Thesis committee
Mr. Jocelyn BONJOUR, Professor, INSA de Lyon, France Chairman
Mr. Giovanni CORTELLA, Professor, University of Udine, Italy Reviewer
Mr. Pedro Dinis GASPAR, Assistant professor, University of Beira Interior, Portugal Reviewer
Mrs. Onrawee LAGUERRE, Senior researcher, Irstea, France Thesis director
Mr. Denis FLICK, Professor, AgroParisTech, France Thesis codirector
Mr. Alexandre MISKIZAK, R&D Manager, EPTA, France Invited member
UR FRISE - IRSTEA
1 rue Pierre-Gilles de Gennes CS 10030 92761 Antony cedex
v
Acknowledgement
Firstly, I gratefully acknowledge the financial support provided by the King Mongkut’s Institute of Technology Ladkrabang (KMITL, Thailand), the National Research Institute of Science and Technology for Environment and Agriculture (Irstea, France) and the Embassy of France in Thailand through the Franco-Thai scholarship program. The completion of my PhD would not have been possible without this support.
I would like to express my deep and sincere gratitude to both of my thesis directors, Dr. Onrawee Laguerre and Prof. Dr. Denis Flick, for their advice and guidance throughout this research. They have been supportive both academically and morally. Their profound scientific knowledge, expertise and excellent practical abilities have inspired me to do my utmost to finish this project. It has truly been a privilege to be supervised by them. In the future, I wish to continue our collaborations and create mutual research projects together. Likewise, I would like to express my heartfelt gratitude to Asst. Prof. Dr. Maradee Phongpipatpong. Without her, I would not have had the opportunity to pursue my PhD in the first place.
I would like to express my great appreciation to my thesis defense committee, Prof. Dr. Jocelyn Bonjour, Prof. Dr. Giovanni Cortella, Asst. Prof. Dr. Pedro Dinis Gaspar and Mr. Alexandre Miskizak, for sacrificing their valuable time to review and assess the thesis. I would also like to thank all members of my thesis committee as a whole for keeping my research progress on schedule. I genuinely appreciate their honest and insightful feedback on the research.
I also recognized the support and friendships of my colleagues. It has been a great pleasure to be a part of the team at Refrigeration Process Engineering Research Unit of Irstea. Special thank is given to Dr. Steven Duret for always sharing many useful ideas concerning simulation works. I also acknowledge the help offered by the technicians for their help in handling of the experiments. Administrative assistance provided by the unit’s secretary was also greatly appreciated.
vi
I am also indebted to Dr. Judith Vatteville for her advice concerning Particle Image Velocimetry system. Likewise, I am immensely grateful for the staffs of EPTA (France) for both their valuable insights on retail refrigeration industry and for allowing me to visit their factory.
I would like to express my deepest gratitude to my parents for their constant supports. I also would like to thank my girlfriend for her love, patience and understanding. Regards are also given to my relatives and friends for their encouragement and friendships. This thesis is dedicated to them all.
Above all, praise be to the God and Father of the Lord Jesus Christ… (1 Peter 3) for making these past three years in France an incredible and memorable experience.
vii
Contents
Acknowledgement ... v
Contents ... vii
List of Figures ... xii
List of Tables ... xvii
Chapter I General introduction ... 1
Background ... 2
Research interests ... 5
Aim and scope ... 6
Structure of the thesis ... 7
List of publications ... 12
Chapter II Literature review ... 14
Abstract ... 15
Introduction ... 16
Open display cabinets ... 17
2.2.1. Field investigation ... 17
2.2.2. Experimental study conducted in a laboratory ... 20
2.2.3. The effect of ambient conditions ... 21
2.2.4. The effect of design parameters and operating conditions ... 23
2.2.5. Development of numerical models ... 25
Closed display cabinets ... 35
2.3.1. Field and laboratory investigations ... 36
2.3.2. Development of numerical models ... 38
Conclusions... 39
Chapter III Heat transfer analysis and airflow characterization using a hot-wire anemometer ... 41
Abstract ... 42
viii
Introduction ... 43
Material and methods ... 45
3.2.1. Description of the closed refrigerated display cabinet ... 45
3.2.2. Determination of the overall thermal transmission ... 47
3.2.3. Air temperature measurement ... 48
3.2.4. Air velocity measurement ... 49
2.5
3.
.
Airflow rate in the vertical rear duct ... 50Results and discussion ... 53
3.3.1. Overall thermal transmission of the display cabinet ... 53
3.3.2. Temperature profiles ... 54
3.3.3. Air velocity profile ... 65
3.3.4. Airflow rate in the vertical rear duct ... 67
Conclusions... 70
Chapter IV Influence of operating conditions on the thermal performance . 72 Abstract ... 73
Nomenclature ... 74
Introduction ... 74
Material and methods ... 76
4.2.1. Closed refrigerated display cabinet ... 76
4.2.2. Temperature measurement ... 78
4.2.3. Door-opening regime ... 78
4.2.4. Variations in operating conditions ... 80
Results and discussion ... 82
4.3.1. Evolution of air and product temperatures ... 82
4.3.2. Effect of door-opening frequency ... 87
4.3.3. Effect of ambient temperature ... 89
ix
Conclusions... 92
Chapter V Airflow characterization using PIV and CFD techniques ... 94
Abstract ... 95
Nomenclature ... 96
Introduction ... 97
Materials and methods ... 99
5.2.1. Refrigerated display cabinet ... 99
5.2.2. PIV measurements ... 101
Experimental results ... 103
5.3.1. Closed display cabinet ... 103
5.3.2. Comparison between closed and open display cabinets ... 106
CFD modeling ... 109
5.4.1. Geometry and mesh details ... 109
5.4.2. Mathematical description ... 111
5.4.3. Boundary conditions ... 112
Numerical results ... 114
5.5.1. Air velocity profile ... 114
5.5.2. Air and product temperature distributions ... 116
Conclusions... 117
Chapter VI Simplified heat transfer modeling in steady state ... 119
Abstract ... 120 Nomenclature ... 121 Introduction ... 122 Experimental study ... 125 Model development ... 129 6.3.1. Model conceptualization ... 129 6.3.2. Zone definition ... 130
x
6.3.4. Estimation of model input parameters ... 141
Static model validation ... 148
Discussions ... 152
6.5.1. Effect of air infiltration through the door gaps ... 152
6.5.2. Effect of ambient air humidity ... 152
6.5.3. Generalization of the model for other closed display cabinets ... 154
6.5.4. Air infiltration during door openings ... 155
Conclusions... 155
Chapter VII Simplified heat transfer modeling in unsteady state ... 157
Abstract ... 158
Nomenclature ... 159
Introduction ... 160
Model development ... 162
7.2.1. Model description ... 164
7.2.2. Dynamic model development ... 165
7.2.3. Temperature variation of the air after the heat exchanger ... 170
Estimation of the equivalent depth in which temperature fluctuations occur in the product ... 172
7.3.1. Development of temperature fluctuation model in a solid ... 174
7.3.2. Case study ... 176
Results and discussion ... 178
7.4.1. Air and load temperature fluctuations in a closed refrigerated display cabinet 178 7.4.2. Dynamic model validation ... 181
7.4.3. Temperature evolution during the defrost operation ... 181
Conclusions... 185
Chapter VIII General conclusions and perspectives ... 187
xi 8.1.1. Experimental study ... 188 8.1.2. Numerical modeling ... 193 Perspectives ... 196 8.2.1. Experimentation ... 196 8.2.2. Modeling ... 197 Reference ... 199 Abstract Résumé
xii
List of Figures
Figure 1.1 Comparison of energy consumption between open and closed
refrigerated display cabinets (source: Laguerre and Chaomuang, 2019). ... 5
Figure 1.2 Structure of the thesis ... 8 Figure 3.1 Location of the closed display cabinet in the climate-controlled room:
(a) perspective view (b) side view ... 46
Figure 3.2 Schematic view of the experimental setup for temperature measurement
in the closed display cabinet: (a) unloaded and (b) loaded conditions ... 49
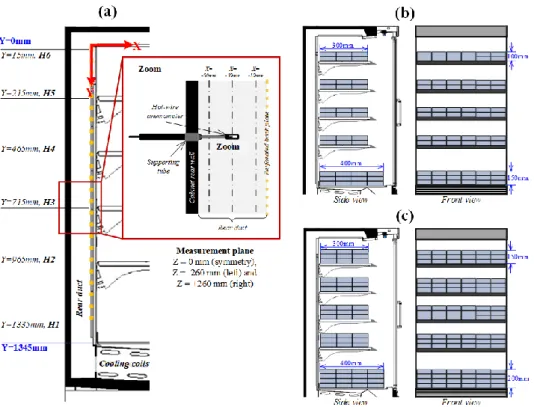
Figure 3.3 Schematic view of the experimental setup for velocity measurement: (a)
measurement positions on middle (z = 0 m) and right (z = +0.26 m) planes (b) position of a hot-wire anemometer and its support on a shelf ... 51
Figure 3.4 Velocity measurement in the vertical rear duct with three percentages
of test package-occupied volumes in the display cabinet: (a) 0% (b) 36% and (c) 52% of total storage volume ... 52
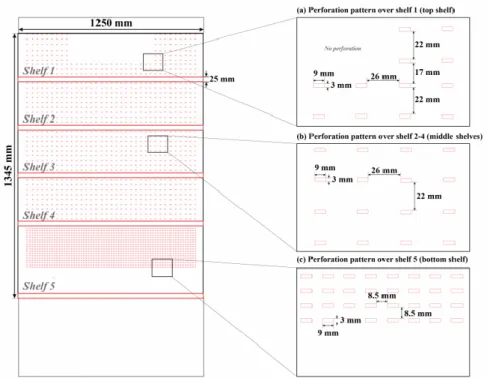
Figure 3.5 Perforation patterns on the back panel at different levels ... 53 Figure 3.6 Evolution of air temperatures (on the middle plane, z = 0 m) at various
positions in the closed display cabinet for a room temperature of 19 °C: (a) discharge air grille, (b) front of top shelf, and (c) back of the bottom shelf ... 55
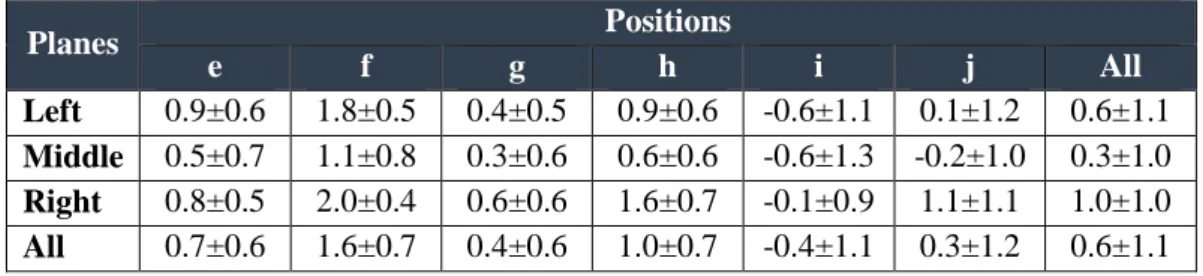
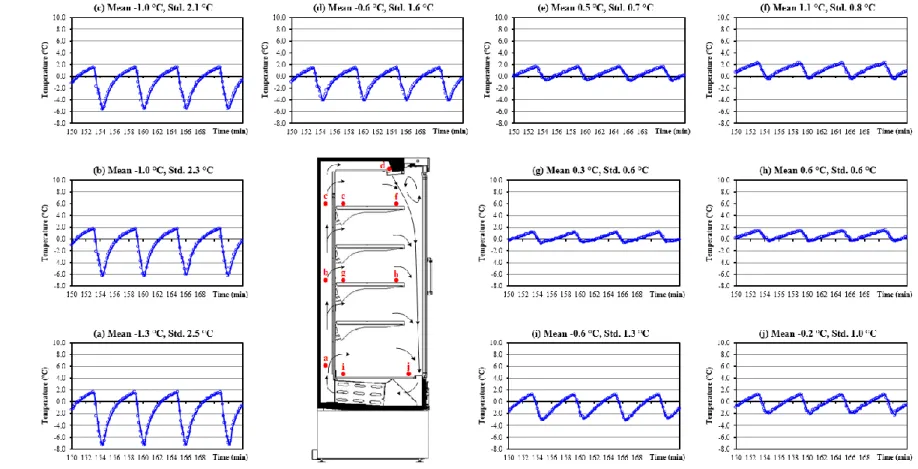
Figure 3.7 Evaluation of air temperature during quasi-steady state in various
positions (on the middle plane) in the closed display cabinet for a room temperature of 19 °C ... 59
Figure 3.8 Mean air temperature and standard deviation (°C) during quasi-steady
state (average of the measurements on the three planes: z = -0.525, 0 and +0.525 m) of the display cabinet (a) with doors and (b) without doors for a room temperature of 19 °C ... 60
Figure 3.9 Air velocity profiles in the closed display cabinet measured by a hot
wire anemometer on the middle (z = 0 m) and right (z = +0.26 m) planes: (a) vertical flow direction and (b) horizontal flow direction ... 64
Figure 3.10 Air velocity profiles in the closed display cabinet measured by a hot
wire anemometer on the middle (z = 0 m) and right (z = +0.26 m) planes: (a) vertical flow direction and (b) horizontal flow direction ... 66
Figure 3.11 Air velocity profiles on three different planes (a) left, (b) middle and
xiii
and (d) influence of percentages of product-occupied volume on the air velocity (average value of nine measurements at a given height) ... 68
Figure 3.12 Percentage of airflow distribution through the perforated back plate at
the level of each shelf for different percentages of product-occupied volume (0%, 36%, and 52%) ... 69
Figure 4.1 (a) Location of the closed refrigerated display cabinet in the
climate-controlled room (b) diagram showing the experimental setup for air and product temperature measurements inside the display cabinet ... 79
Figure 4.2 Algorithm of automatic door openings ... 80 Figure 4.3 Evolution of (a) air, and (b) product (core and surface) temperatures on
the center plane of a closed refrigerated display cabinet over 36-hour operation for an ambient temperature of 19.4 °C. ... 82
Figure 4.4 Air temperature evolution at 2 cm from the front product surface on the
center plane of the closed display cabinet during 6 door openings (10 OPH frequency) with (a) 15 s and (b) 30 s opening durations (acquisition interval of 1 s) ... 83
Figure 4.5 Time-averaged (± standard deviation in °C) air and product
temperatures in the closed refrigerated display cabinet for an ambient temperature of 19.4 °C during (a) closed door – light off, (b) open door with a frequency of 10 OPH – light on, and (c) closed door – light on conditions. Values are the average over 5 hours of quasi-steady state ... 86
Figure 4.6 Effect of door-opening frequency on the dimensionless product core
temperature (a) at the front, and (b) at the back of the five shelves ... 88
Figure 4.7 Variation of dimensionless product core temperature (𝜃𝑝) with the
difference between the average of ambient air temperature 𝑇𝑒 and of air temperature after the heat exchanger 𝑇𝑡ℎ: (a) front products (b) back products (opening frequency of 10 OPH and occupied volume of 60%) ... 90
Figure 4.8 Effect of occupied volume on the product temperature in the closed
display cabinet (opening frequency of 10 OPH and ambient temperature of 19.4 °C) ... 92
Figure 4.9 Variation in air velocity above the products on different shelves in the
closed display cabinet (1.25 m in length) for two occupied volumes: (a) 30%, (b) 60%. ... 92
xiv
Figure 5.1 Experimental setup for PIV measurement in a closed refrigerated
display cabinet: (a) perspective view; (b) front view; and (c) side view ... 100
Figure 5.2 Mean air velocity profiles (a); velocity fluctuations (b); and velocity
vector fields (c); along the air curtain of a closed display cabinet running with fans only (refrigeration system “off”). Mean air velocity profiles (d); velocity fluctuations (e); and velocity vector fields (f); along the air curtain of a closed display cabinet running with fans and the refrigeration system “on”. ... 106
Figure 5.3 Velocity profiles, velocity fluctuations and vector fields on the middle
plane of the closed (a, c and e) and open (b, d and f) display cabinets. The asterisk () represents a zone without signals (absence of particles in the external ambient air). ... 107
Figure 5.4 Example of large unsteady eddy development at three consecutive
instants (780 mm < y < 892 mm): (a) 0.10 s; (b) 0.18 s; and (c) 0.28 s. ... 108
Figure 5.5 The computational domain of the 2D-CFD model for a closed display
cabinet and the locations of boundary conditions. ... 110
Figure 5.6 Velocity profiles without (a) and with (b) energy equation and
temperature profile (c) in front of Shelf 3 for different meshes. ... 111
Figure 5.7 Air velocity profiles in a closed display cabinet (a) refrigeration system
turned “off”; and (b) refrigeration system turned “on”. ... 115
Figure 5.8 Air and product temperature distributions in a closed refrigerated display
cabinet: (a) experiment (Chaomuang et al., 2019a); and (b) numerical prediction. ... 116
Figure 6.1 Characteristics of a closed display cabinet and schematic view of
experimental setup for the temperature measurement ... 126
Figure 6.2 (a) Experimental mean air and product core temperatures and the
standard deviations during (quasi) steady state at various positions in a closed display cabinet for room temperatures of 19.5 °C (b) visualization of air flow at the front of the top shelf. ... 128
Figure 6.3 Experimental time-temperature profiles (a) air at the discharge air grille
(DAG) (b) front load (core) at the top shelf and air at 2 cm from the load surface and (c) back load (core) at the bottom shelf and air at 1 cm above the load surface ... 130
xv
Figure 6.4 Schematic view of the simplified model composed of two domains:
Domain I heat losses through the vertical rear duct and the cabinet ceiling and Domain II heat exchange in the shelves-space storage. ... 131
Figure 6.5 Heat balance in Domain I at the position after the heat exchanger in the
vertical rear duct denoted as EZ [1, 1]: (a) schematic view (b) mathematical view ... 134
Figure 6.6 Examples of heat and mass balances in Domain II: (a) Shelf 1 and (b)
Shelf 2 ... 135
Figure 6.7 Sensibility study showing the variation in load temperatures with respect
to the fitting parameters: air flow ratio (a), air distribution coefficients at Shelf 1 (b), air distribution coefficients at Shelf 2 to 5 (c), heat transfer coefficients over the back loads (d) heat transfer coefficients over the front loads (e). ... 146
Figure 6.8 Temperature variation of the air after the heat exchanger (T_th) for three
ambient temperatures. ... 148
Figure 6.9 Comparison between numerical and experimental results of air and load
temperatures (in °C) in a closed display cabinet for three ambient temperatures: (a) 14.6 °C, (b) 19.5 °C and (c) 24.4 °C. (Experimental values indicated for load temperature are the averages of the top and bottom layers) ... 150
Figure 6.10 Calculated and measured time-averaged temperatures of (a) air and (b)
load in a closed display cabinet for ambient temperatures of 14.6, 19.5 and 24.4 °C. ... 152
Figure 6.11 Numerical result showing the variation of load temperatures with air
infiltration rate through the door gaps ... 153
Figure 6.12 Input parameters required for application to another closed display
cabinet ... 154
Figure 7.1 Schematic view of the simplified model: (a) heat exchange in Domain I
at the position after the heat exchanger in the vertical rear duct denoted as EZ [1, 1], (b) heat exchanges in Domain II on Shelf 1 and (c) Shelf 2. ... 163
Figure 7.2 Experimental temperature profiles of air after the heat exchanger for
different ambient temperatures. ... 171
Figure 7.3 Illustration curves of temperature fluctuations in a solid (a) with constant
conductivity (real condition) and (b) with inconstant conductivity split at the equivalent thickness (simplified condition). ... 174
xvi
Figure 7.4 (a) Schematic of temperature measurement for the test package located
at the back row (top layer) on the bottom shelf at different depths from the surface (x=0 mm) to the core (x=25 mm) and for the air at 10 mm above. (b) Decay of temperature fluctuations in the load from the surface to the core ... 177
Figure 7.5 Experimental temperature evolutions of the air (10 mm above the load)
and of the back load on the bottom shelf at the different depths from the surface (x=0 mm) to the core (x=25 mm): (a) overall view and (b) enlarged scale on the highlighted area ... 178
Figure 7.6 Temperature evolution of the air and the load surface at different
positions inside the closed display cabinet for the ambient temperature of 19.5 °C. (a) air at the discharge air grille (DAG), (b-d) back and (e-g) front loads with the surrounding air on the top, middle and bottom shelves, respectively (the time-averaged load temperature at the front was extrapolated from the core temperatures between the back and the front loads). ... 180
Figure 7.7 Comparison between the simulation and the measurement of
temperature fluctuations of (a) air and (b) loads inside the closed refrigerated display cabinet. Data based on the external ambient temperature of 19.5 °C ... 181
Figure 7.8 Input temperature profile of the air after the heat exchanger (𝑇𝑡ℎ) .. 182 Figure 7.9 Air temperature evolution at various position in a closed refrigerated
display cabinet during the defrost operation (𝑇𝑒𝑥𝑡 = 19.5℃) ... 183
Figure 7.10 Load temperature evolution at various position in a closed refrigerated
display cabinet during the defrost operation (𝑇𝑒𝑥𝑡 = 19.5℃) ... 183
Figure 7.11 Comparison between the simulation and the measurement of
temperature increase (𝑇𝑚𝑎𝑥 − 𝑇𝑚𝑖𝑛) during defrosting period of (a) air and (b) load inside the closed refrigerated display cabinet for three external ambient temperatures. ... 184
xvii
List of Tables
Table 2.1 Field investigations on chilled food products at retail displays in various
countries ... 19
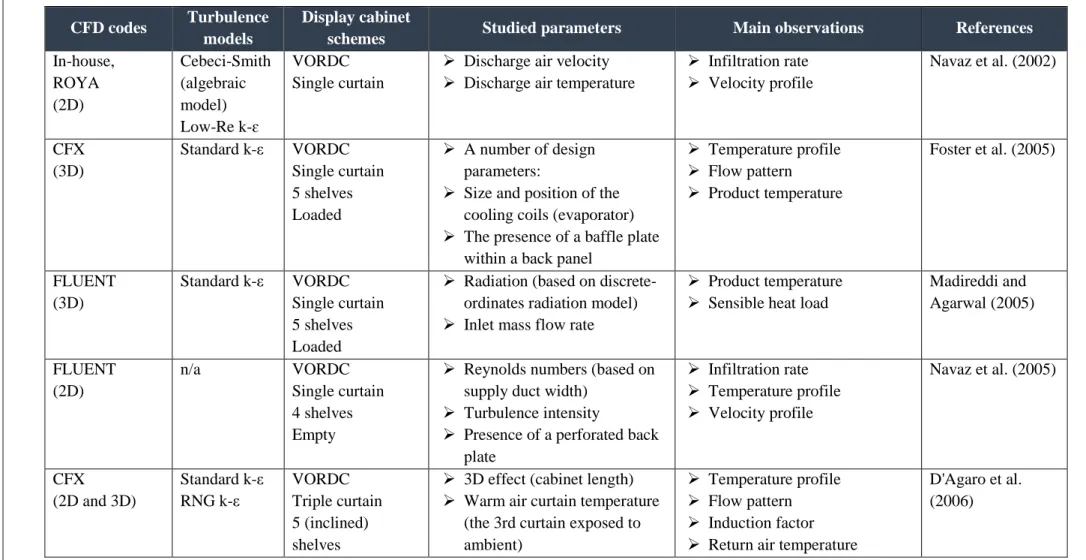
Table 2.2 Numerical studies on heat transfer and airflow in open display cabinets ... 29
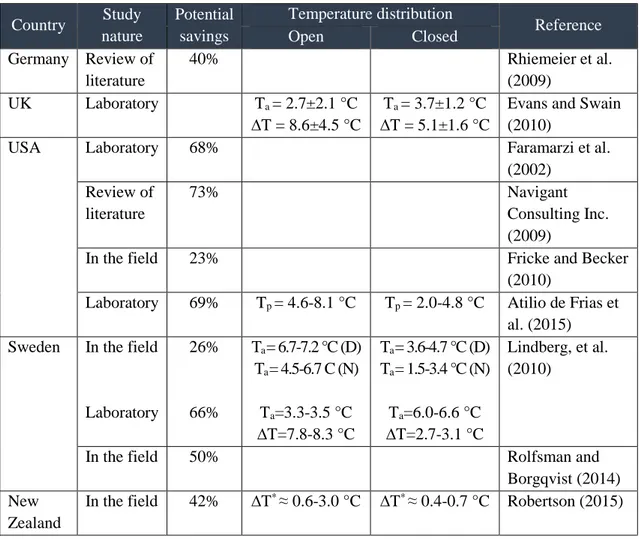
Table 2.3 Comparison of the performance of open and closed display cabinets .. 37
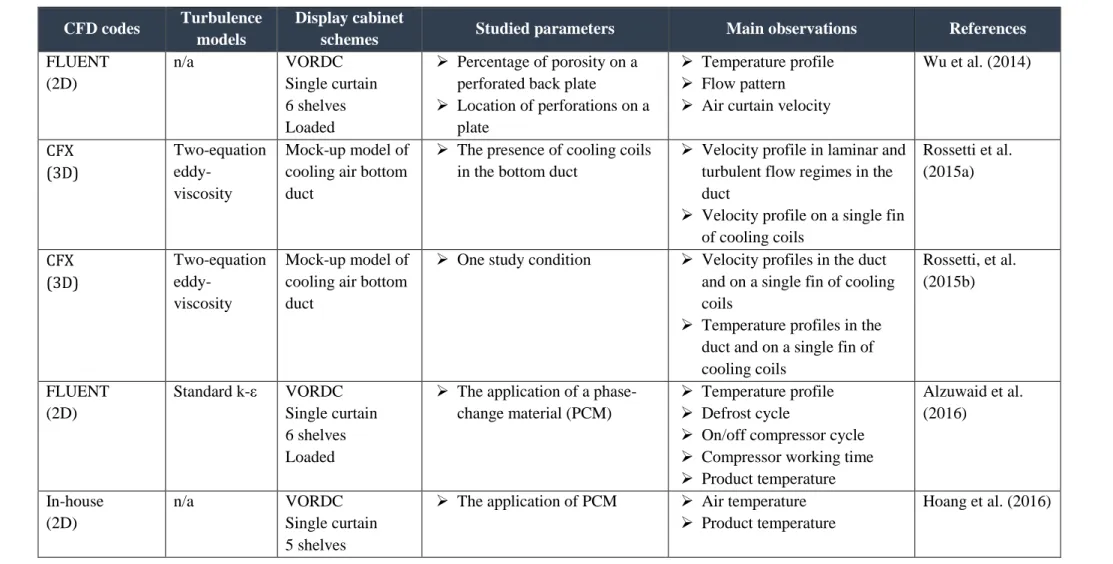
Table 2.4 Numerical studies conducted on closed display cabinets ... 40
Table 3.1 Percentage of perforated area (PPA) on different shelves ... 52
Table 3.2 Mean temperature and standard deviation (°C) during quasi-steady state at various positions within the food storage zone on the left, middle and right planes for a room temperature of 19 °C ... 57
Table 3.3 Effect of ambient temperatures on the internal air temperature of the closed display cabinet ... 62
Table 4.1 Operating conditions in a closed refrigerated display cabinet ... 81
Table 4.2 Effect of lateral glass wall on the product core temperature in the closed display cabinet ... 86
Table 4.3 Time-averaged product temperature† (in °C) at the back and front of the display cabinet with a door- opening frequency of 60 OPH and permanently open (without doors) condition for an ambient temperature of 19.4 °C and occupied volume of 60%. ... 89
Table 4.4 Effect of external ambient temperature (𝑇𝑒 ) on the product core temperature (𝑇𝑝) in the closed display cabinet. ... 91
Table 5.1 Characteristics of the closed refrigerated display cabinet used in the study ... 101
Table 5.2 General form of the governing equations(a)... 112
Table 5.3 Inlet boundary conditions ... 113
Table 6.1 Thermal properties of materials ... 141
Table 6.2 Values of input parameters used in the heat transfer model of a closed refrigerated display cabinet ... 142
Table 6.3 Values of the first top ten combinations of the input parameters with the mean absolute error (MAE) for the model fitting ... 147
Table 6.4 Effect of ambient temperature on load temperature at various positions in a closed refrigerated display cabinet ... 151
xviii
Table 6.5 Error of air and load temperatures calculated from the developed model
for different ambient temperatures compared to the measured values ... 151
Table 7.1 Weights and thermal mass of the load and the solid components of the
Chapter I
General introduction
Chapter I – General introduction 2 Background
World population is predicted to increase from 7.3 billion in 2015 to 9.7 billion in 2050 (United Nations, 2017). This population growth would drive up food demand by approximately 59% to 98% (Valin et al., 2014). Global food production therefore needs to increase to keep up with a rising demand (Hunter, 2017).
A cold chain is an essential part of production chains where several refrigeration facilities are used to keep food products, from production to consumption, at their good quality and low risk to consumer (Badia-Melis et al., 2018). Temperature is a main determining factor of the food quality deterioration (Mercier et al., 2018). A failure in temperature control at any cold chain stage can markedly compromise the quality and safety of food products (Ndraha et al., 2018). High temperature accelerates the physiological changes of food, the growth of spoilage/pathogenic microorganisms, and eventually shortens the product shelf life (Nunes et al., 2009; Rediers et al., 2009). Therefore, effective temperature control along the cold chain is of paramount importance.
Governments and/or public authorities in various countries have established legislation and regulations regarding temperature control in the cold chain (Carson and East, 2018; Mercier et al., 2018). In practice, product temperature is well controlled at the early stages e.g. production, storage, distribution and transport (Baldera Zubeldia et al., 2016). However, with the exception of household practices, the temperature control at retail display appears to be problematic (Evans, 2010; Derens-Bertheau et al., 2015; Derens et al., 2006). In addition, food waste at supermarkets can be as high as 55% due to poor temperature conditions (Nunes et al., 2009).
Open refrigerated display cabinets are widely used by retailers and account for almost half of the refrigerating equipment use in a typical supermarket (ASHRAE, 2010). The open display cabinets prove to be popular among retailers as they provide customers with almost unrestricted access to products (Evans, 2014), whilst maintaining good product attractiveness (Alzuwaid et al., 2015). Nevertheless, their major limitations concern the thermal performance.
Chapter I – General introduction 3 In open display cabinets, an air curtain creates a non-physical barrier between the cold air inside and the warm air outside. However, the air curtain cannot completely prevent the warm and humid ambient air infiltration (Foster et al., 2005), which leads to the increase of temperature and energy consumption (Amin et al., 2008; Evans, 2014; Laguerre et al, 2012b). Several studies indicated that the ambient air infiltration has contributed approximately to 66-77% of total heat load of the open refrigerated display cabinets (Faramarzi, 1999; Gaspar et al., 2011; Tassou et al., 2011). It also causes internal temperature heterogeneity (Laguerre et al, 2012b). Temperature differences of more than 5 °C was observed on cabinet shelves (Willocx et al., 1994), with the higher temperature commonly located at the front of the cabinets, and the lower temperature at the back (Evans et al., 2007).
Due to an increasing concern for energy efficiency and food safety, the issues of ambient air infiltration in open display cabinets have been subjects of attention. Numerous experimental investigations and numerical simulations have been carried out with the attempt to maximize the air curtain efficiency, thereby improving the overall performance of open display cabinets (Chen, 2009; Chen and Yuan, 2005; Cortella et al., 2001; D'Agaro et al., 2006; Foster et al., 2005; Gaspar et al., 2012; Hadawey et al., 2012; Jouhara et al., 2017; Laguerre et al., 2012; Marinetti et al., 2012; Moureh and Yataghene, 2016; Navaz et al., 2005; Wu et al., 2015; Yu et al., 2008). Hammond et al. (2016) proposed a novel short air curtain design, instead of a conventional single long air curtain, to improve temperature homogeneity and energy efficiency. In this study, despite multiple short air curtains were created to provide enclosure at the front of every shelf, they cannot eliminate the air infiltration.
Installation of doors on open-front display cabinets has become an alternative design to address the air infiltration issue. It has been proven that the closed display cabinets show several favorable outcomes including potential energy savings (Faramarzi, 1999; Fricke and Becker, 2010; Kauffeld, 2015; Navigant Consulting Inc., 2009), reductions in internal temperature heterogeneity (Evans and Swain, 2010; Lindberg et al., 2010), and improved food quality (Atilio de Frias et al., 2015). Additionally, doors can also provide better thermal comfort in retail stores due to less cold air spillage from the display cabinet (Lindberg et al., 2017). In view of these benefits, some major retailers in Europe have made closed display cabinets
Chapter I – General introduction 4 a default specification for their new and renovated stores (EIA, 2017). This trend is especially notable in France where the authorities and the supermarket stakeholders have signed an agreement to replace open display cabinets with closed ones. The country aims to increase the installation of closed display cabinets to 75% by 2020 (RPF, 2016).
Energy savings of closed display cabinets demonstrated in various studies (Figure
1.1) could be explained by a reduction in the entrainment of warm and moist
ambient air into the cabinets. However, a wide variation of energy saving percentages among studies, ranging from 23-73% could be attributable to the difference of cabinet configurations and test conditions used in each study. This difference can be, for example, door integrity (retrofitted/factory-built), door type (hinged/sliding), door material (single/double/triple glazing windows with/without low emissivity coating), use of anti-sweat heaters, LED lightings, night covers, frequency and duration of door openings (Evans, 2014). The last one (frequency of door openings) is pointed out as one of the main factors contributing to an increased energy consumption due to the air entrainment (Li et al., 2007). The energy consumption of closed display cabinet during stable night condition was approximately 10% lower than that operating under periodical door openings (Vallée, 2015). Lindberg et al. (2010) showed that the heat extraction rate of the evaporator increased by 16% when the opening frequency increased from 10 to 30 openings per hour. Door openings appeared to be the largest contributor to the total heat load of closed display cabinet when the frequency reached 60 openings per hour (Orlandi et al., 2013).
Unlike energy consumption, the temperature performance of closed refrigerated display cabinets is less studied, only the internal temperature and its heterogeneity were reported. Lindberg et al. (2010) observed that an overall air temperature reduction of at least 2 °C was achieved in the cabinet retrofitted with doors. Atilio de Frias et al. (2015) reported that the temperature difference within the closed cabinet was 6 °C lower than that within the open one.
Chapter I – General introduction 5 Figure 1.1 Comparison of energy consumption between open and closed
refrigerated display cabinets (source: Laguerre and Chaomuang, 2019).
Research interests
The growing trend of closed refrigerated display cabinet use has contributed to the necessity to expand research in this field. However, to the author’s knowledge, current literature only addresses the benefits of closed display cabinets over open ones. Studies on the mechanism of heat transfer and airflow within closed display cabinets are still limited. In fact, the airflow pattern influences the heat exchange between air and product, thus, product temperature. Faramarzi et al (2002) found that installing doors caused a reversal variation in product temperatures – product temperature at the front upper shelf became warmer than that at the bottom shelf. To accommodate door openings, doors fitted to display cabinets often have gaps at the edges; however, these gaps allow ambient air infiltration (Evans, 2014). The advanced techniques of air velocity measurements, such as Particle Image Velocimetry (PIV), Laser Doppler Velocimetry (LDV), together with Computational Fluid Dynamics (CFD) simulations would provide an insight into the transport phenomena in closed refrigerated display cabinets.
Complex phenomena take place when door is open during which the disrupted air curtain causes the entrainment of warm and humid ambient air. A further investigation into the effects of frequency and duration of door openings on food temperature increase and energy consumption is therefore important.
Chapter I – General introduction 6 A simplified heat transfer model based on a zonal approach should also be developed to obtain complementary knowledge of the mechanisms of heat transfer in a closed display cabinet. This model would be linked with the other well-established models for processing plant (Lecoq et al., 2016), refrigerated vehicle (Hoang et al., 2012), cold room (Laguerre et al., 2015), open refrigerated display cabinets (Laguerre et al., 2012a) and household refrigerator (Laguerre & Flick, 2004). These models allow the prediction of product temperature in each equipment in short calculation time compared to CFD simulation. The closed display cabinets will soon be an additional component of the series of refrigeration equipment in the food cold chain. In conjunction with other equipment models, the closed display cabinet model would enable the prediction of time-temperature history of food products of the entire cold chain. Accordingly, the evaluation tool of consumer risk exposition can be constituted by integrating the proposed models with predictive microbial and/or quality models (Duret et al., 2015).
Aim and scope
Following the previous reasoning, the present thesis was conducted with the two main objectives.
Firstly, it aims to develop an experimental methodology to identify the thermal transport phenomena in a closed refrigerated display cabinet. Evolutions of spatial and temporal air/product temperatures and air velocity are the main parameters taken into investigations. The influence of different operating conditions on these parameters was then studied. These conditions include ambient air temperature, product-occupied volume, door-opening frequency and duration. Internal airflow pattern was characterized by both a hot-wire anemometer and PIV technique. The results obtained from these experiments were further used for the estimation of model input parameters and for the model validation purposes.
Secondly, it aims to develop numerical tools by both CFD simulation and simplified heat transfer model base on a zonal approach.
The CFD simulation allows the better understanding of airflow and heat transfer phenomena in the closed display cabinet, which cannot be observed by the experiments. However, the main objective is not to represent precisely all the flow
Chapter I – General introduction 7 and transfers details. Instead, the aim is to examine the capability of a 2D-CFD k-ε model to reproduce the main phenomena and to predict the product temperatures in the cabinet with acceptable accuracy. Although it is not in the scope of the thesis, after its validation with the experimental data, the model could be used to study the influence of unexplored operating conditions and design parameters.
The simplified model in both static and dynamic regimes permits, respectively, the predictions of both time-averaged air and product temperatures and the temperature fluctuations according to the on/off working cycles of the compressor regulation. The model in the dynamic regime was solved with a spectral approach, thus the influence of different parameters on the damping of the temperature fluctuations can be identified with quick calculation.
Structure of the thesis
The structure of manuscript presented in Figure 1.2 includes 8 chapters, which are described briefly below:
Chapter I General introduction describes the background, research interests,
aim/scope and structure of the thesis as well as list of publications.
Chapter II Literature review provides the state of the art of the investigations
involving experimental (carried out in fields and in laboratories) and numerical research studies on open and closed retail refrigerated display cabinets. The current usage situation of display cabinets and the problem of temperature control at retail display based on field investigations were presented. Studies aiming to improve the performance of the display cabinets were explored and the influencing factors were then analyzed in terms of temperature distribution and energy consumption. The growing trend of closed refrigerated display cabinet use in Europe was also highlighted. More detail is presented in Article 1 (published).
Chapter I – General introduction 8 Figure 1.2 Structure of the thesis
Chapter III Heat transfer analysis and airflow characterization using a hot-wire anemometer. In spite of the potential of energy savings of closed display
cabinets, the literature review (Chapter II) shows the lack of knowledge on heat transfer and airflow compared to the open ones. This chapter presents the experimental investigations of heat transfer and airflow in a closed refrigerated display cabinet (an integral type equipped with a single band air curtain and two double-glazing doors) under closed-door condition in a controlled-temperature test room. First, the overall thermal transmission coefficient of the studied closed display cabinet was determined by measuring heat loss through all cabinet doors/walls. The heat loss contribution of different components (walls, doors, door gaps and thermal bridges) was then estimated. Second, the air temperature was measured in the unloaded closed display cabinet using calibrated T-type thermocouples (40 thermocouples). The result made it possible to gain an insight into the temperature fluctuation and the mean temperature at different positions in the cabinet, thus, the warm and cold positions were identified. Effect of room temperature (15, 19 and 24 °C) on the internal air temperature distribution was also examined. The result revealed that the room temperature had an almost linear
Chapter I – General introduction 9 influence on the internal air temperature, and it had a significant effect on the compressor working cycles. Third, the influence of loading was studied by putting test packages made of methylcellulose on the shelves (60% occupied volume). Additional thermocouples (40 thermocouples) were inserted/attached to the core/surface of the test packages. It was observed that the trend of temperature distribution in the unloaded and loaded cabinet was the same (the highest temperature position at the front-top shelf and the lowest temperature position at the rear-bottom shelf). Finally, the benefit of door installation was studied by doing experiment using the unloaded cabinet with doors completely removed. Without doors, the mean air temperatures in the storage compartment were higher at all positions (minimum increase 0.4 °C and maximum increase 3.1 °C) compared to the case without doors. In addition to the temperature measurements, the air velocity was measured at the front of the closed-door and unloaded display cabinet for different heights from the discharge to return air grilles using a hot-wire anemometer. The shape of the air velocity in the curtain was presented (the air curtain was deviated towards the doors due to a Coanda effect with maximum air velocity of about 0.6 m·s-1 near the discharge grille). In the storage compartment, the air velocity was low, varying from 0.01 to 0.2 m·s-1. The air velocity measurement in the rear duct was also carried out and the airflow distribution over the perforated back panel of different shelves was then quantified. More detail is presented in Article 2 (published). Because the precision of the velocity measurement using the hot-wire anemometer was limited, particularly for low velocity application (< 0.5 m·s-1), Particle Image Velocimetry (PIV) technique was used and presented in Chapter V.
Chapter IV Influence of operating conditions on the thermal performance. The
thermal performance of the closed refrigerated display cabinet was presented under permanently closed-door condition in Chapter III (heat transfer analysis and airflow characterization using a hot-wire anemometer). This chapter continues to present the temperature performance under periodic door openings. An automatic door opening system developed and used in experiments enabled the investigation of effects of different door Opening frequencies Per Hour (OPH) on the air and product temperature variations. The studied frequencies were 0 (permanently closed), 10, 20, 40, 60 OPH, and ∞ (permanently open – doors completely removed)
Chapter I – General introduction 10 and the studied opening duration was 15 s and 30 s. The frequency of 10 OPH with 15 s duration and 90° opening angle was programed with respect to the one prescribed in the standard test (EN ISO 23953-2, 2015), and this opening procedure was set to a baseline. Based on data available in the literature (Fricke and Becker, 2010) and information provided by a display cabinet manufacturer, the opening frequency in supermarkets is averagely 6.3 OPH (12 s duration) and 12.1 OPH (13 s duration), respectively. Effects of ambient air temperature (14.6, 19.4, 24.3 and 29.2 °C) and product-occupied volume (half-loaded and full-loaded) on the air and product temperature distribution were experimentally investigated. It was observed that the product located at the front of mid-height of display cabinet was more influenced by the door opening frequency. However, the air and product temperatures in the cabinet with doors (whatever the frequency of door openings) remained lower, compared to the case without doors. More detail is presented in Article 3 (published).
Chapter V Airflow characterization using PIV and CFD techniques. Due to the
precision limitation of the hot-wire anemometer for low velocity applications, the PIV technique was used to characterize the airflow pattern in the closed display cabinet. A Computational Fluid Dynamics (CFD) simulation was also developed in parallel due to the difficulties to implement the PIV technique experimentally at some areas in the cabinet. This chapter presents the air velocity measurement using a 2D-PIV system in a display cabinet with two configurations: closed and open doors (doors were open with 90° angle). In the closed configuration, experiments were conducted under two conditions: refrigeration system turned “off” or “on” so that its influence on the airflow pattern is highlighted. A zone of air recirculation was identified where ambient air infiltration was also observed through the door gaps, leading to an increase in the air curtain temperature). Because of the technical constraints, only the experiment with the refrigeration system turned “off” was carried out in the open configuration. The air curtain characteristics (mean velocity and velocity fluctuations) of the closed and open configurations were then compared and the implications on the internal temperature distribution was addressed. A cabinet with doors yields better thermal performance because the air curtain is more stable compared to the case without. Without doors, large unsteady eddies developed in the mixing layers, thereby promoting greater external air
Chapter I – General introduction 11 infiltration. Finally, a 2D-CFD model was developed to investigate the airflow and its influence on the temperature distribution in the closed display cabinet. The model showed the ability to reproduce the main flow phenomena observed in the experiment and allowed the prediction of product temperatures with acceptable accuracy. The experimental data of Chapter III (Heat transfer analysis and airflow characterization using a hot-wire anemometer) were used for the model input and validation. More detail is presented in Article 4 (under review, first submission).
Chapter VI Simplified heat transfer modeling in steady state. Because of the
calculation time-consuming using the CFD simulation, this chapter presents the development of a simplified heat transfer model in steady state based on the zonal approach. The model allows the prediction of time-averaged air and load temperatures at various positions in the closed display cabinet. Details of overall model conceptualization, static model development, determination of model input parameters as well as model validation by comparing with experimental data were described. In addition, the model was further used to estimate the frost formation on the evaporator surface due to the air infiltration through the door gaps. Suggestions were also provided to generalize the model for other closed display cabinets and to take into account the air infiltration due to door openings in simple or more realistic manners. Like Chapter V (Airflow characterization using PIV and CFD techniques), some experimental data of Chapter III (Heat transfer analysis and airflow characterization using a hot-wire anemometer) were used for the model input and the model validation which showed a good agreement. More detail is presented in Article 5 (under review, second submission). Moreover, all input parameters determined in this chapter were further used in Chapter VII.
Chapter VII Simplified heat transfer modeling in unsteady state. This chapter
presents the development of the simplified heat transfer model in transient state, which allows the prediction of the air and load temperature fluctuations according to the on/off working cycles of the compressor operation and the defrosting operation during which the compressor is “off”. This dynamic model was solved with a spectral method by using Fourier transform and transfer functions. With this solving method, the model showed the influence of different parameters on the damping of the temperature fluctuations with quick calculation time. The estimation of the equivalent load thickness at which the temperature fluctuation was the same
Chapter I – General introduction 12 order as at the surface was also proposed. Some experimental data of Chapter III (Heat transfer analysis and airflow characterization using a hot-wire anemometer) were used for the model input and the model validation which showed a good agreement. More detail is presented in Article 6 (under review, second submission). Finally, the conclusions and perspectives are provided in Chapter VIII
Conclusions and perspectives.
A list of literature cited throughout the thesis is summarized in Reference.
List of publications In peer-reviewed journals
※ Chaomuang, N., Flick, D., & Laguerre, O. (2017). Experimental and
numerical investigation of the performance of retail refrigerated display cabinets. Trends in food science & technology, 70, 95-104. (Article 1)
※ Chaomuang, N., Flick, D., Denis, A., & Laguerre, O. (2019). Experimental
analysis of heat transfer and airflow in a closed refrigerated display cabinet. Journal of Food Engineering, 244, 101-114. (Article 2)
※ Chaomuang, N., Flick, D., Denis, A., & Laguerre, O. (2019). Influence of
operating conditions on the temperature performance of a closed refrigerated display cabinet. International Journal of Refrigeration, 103, 32-41. (Article 3) ※ Chaomuang, N., Flick, D., Denis, A., & Laguerre, O. (n.d.). Characterization
of airflow in a closed refrigerated display cabinet using PIV and CFD techniques. Journal of Food Engineering (submitted). (Article 4)
※ Chaomuang, N., Laguerre, O., & Flick, D. (n.d.). Simplified heat transfer
modelling of a closed refrigerated display cabinet: Part I - Static model development and validation. Applied Thermal Engineering (submitted). (Article 5)
※ Chaomuang, N., Laguerre, O., & Flick, D. (n.d.). Simplified heat transfer
modelling of a closed refrigerated display cabinet: Part II - Dynamic model development and application. Applied Thermal Engineering (submitted). (Article 6)
Chapter I – General introduction 13 In book chapter
※ Laguerre, O., & Chaomuang, N. (2019). Close refrigerated display cabinet: Is it worth it for food quality? In P. D. Gaspar & P. D. Silva (Eds.), Handbook of Research on Technologies and Systems for Food Preservation. IGI Global (In-press). (Article 7)
Technical paper under preparation
※ Denis, A., Chaomuang, N., Flick, D., & Laguerre, O. (n.d.). Caractérisation expérimentale des champs de vitesse d'air dans un meuble frigorifique fermé par la Vélocimétrie Imagerie des Particules. Revue Générale du Froid. (Article 8) In conference paper
※ Chaomuang, N., Laguerre, O., & Flick, D. (2019, August 24-30). A simplified heat transfer model of a closed refrigerated display cabinet. Paper presented at the 25th IIR International congress of refrigeration (ICR2019), Montreal, Canada. (Article 9)
Chapter II
Literature review
Chapter II – Literature review 15
Experimental and numerical investigation of
the performance of retail refrigerated display
cabinets
Nattawut Chaomuang, Denis Flick and Onrawee Laguerre
Published in Trends in Food Science & Technology (2017), 70 (Supplement C), pages 95-104
Abstract
Refrigerated display cabinets are widely used to preserve chilled and frozen food products in retail food stores. Storage temperatures must be efficiently controlled to ensure that the product temperature is maintained below the recommended value. Numerous surveys have demonstrated that refrigerated display cabinets, seem to be a weak link in the food cold chain, and household practices also constitute weak links. A great deal of effort has been devoted to the investigation and improvement of the performance of cabinets in terms of both temperature homogeneity and energy efficiency.
In this review article, an investigation of refrigerated display cabinet performance, from basic experimental field and laboratory studies to advanced numerical simulation, is presented. Field investigation enables knowledge of real-use conditions to be acquired and identifies problems encountered during food storage. However, such investigation is usually costly and time-consuming. The Computational Fluid Dynamics (CFD) approach is becoming a promising alternative used to study the influence of various design parameters and operating conditions on the cabinet performance.
Ambient air infiltration across air curtains is the most significant factor indicating the performance of open display cabinets. This issue is still problematic in many research and development contexts. The application of closed doors becomes an alternative solution which has been proven that it can provide several advantages. As little research involving this type of refrigeration equipment is available, thus further investigation is required in order to obtain additional data.
Chapter II – Literature review 16
Keywords: Refrigerated display cabinets, retail food stores, storage temperatures,
energy consumption, Computational Fluid Dynamics (CFD)
Introduction
About a half of food products in retail food stores are presented in refrigerated display cabinets (Bertrand, 1993). Typically, for chilled products, vertical multi-deck display cabinets are often preferred because the limited space available in the stores can be utilized effectively. Food quality and consumer safety strongly depend on temperature control. Even though a great deal of legislation and regulations are extensively imposed, several surveys show that food products presented in retail cabinets encounter temperature abuse: this problem has been demonstrated in the UK (Evans et al., 2007), and in France (Derens et al., 2006). Around 360 million tons of food are lost annually worldwide because of the insufficient use of refrigeration (IIR, 2009).
Open-front refrigerated display cabinets are the most commonly used equipment, since they allow customers to access the products without any barriers. Despite good design of the air curtain, warm and humid air infiltration inevitably leads to temperature heterogeneity within the cabinets. This heterogeneity can cause food quality deterioration and high electrical energy consumption. In order to address these issues, numerous wide-ranging studies have been carried out with a view to improve the performance of display cabinets, particularly in terms of air curtain design, using both experimentation and numerical simulation. Nevertheless, infiltration can be limited using display cabinets with doors. Due to a possible reduction in product sales, customer interviews were carried out in supermarkets in England, and these interviews showed that half of the customers surveyed would prefer to purchase products from cabinets without doors (Grocery Trader, 2013). On the contrary, Fricke and Becker (2010) indicated that the utilization of closed display cabinets had no effects on product sales in the USA. As it is difficult to reach a clear conclusion regarding the influence of the presence of doors in terms of sales volume, and given the large amount of energy that can be saved, the use of closed refrigerated display cabinets is becoming more and more widespread, and closed cabinets will account for 75% of all display cabinets in retail stores by the end of 2020 in France (RPF, 2016).
Chapter II – Literature review 17 This review article is divided into two main sections based on the type of refrigerated display cabinets: open or closed. Each section aims to present the state of the art of the investigations involving both field and laboratory studies on the air temperature evolution in the display cabinets and the food products inside the cabinets. These investigations were carried out by experimental and numerical approaches in order to study the heat and mass transfer, the airflow and the energy consumption of the cabinets. The objective of this review is to provide information on the current usage situation and to examine attempts to improve the performance of the display cabinets in terms of both temperature distribution and efficient energy consumption. Future trends in the field of refrigerated display cabinets are also highlighted.
Open display cabinets
Since energy saving has become a major concern worldwide during the past two decades, the performance of retail refrigeration systems must be optimized. Several experimental and numerical investigations have been carried out to determine the factors which have the greatest effects on system performance. These factors can be design parameters, operating conditions or ambient conditions. The knowledge acquired makes it possible to control the food temperature, to reduce temperature fluctuations and to achieve energy savings in refrigerated display cabinets.
2.2.1. Field investigation
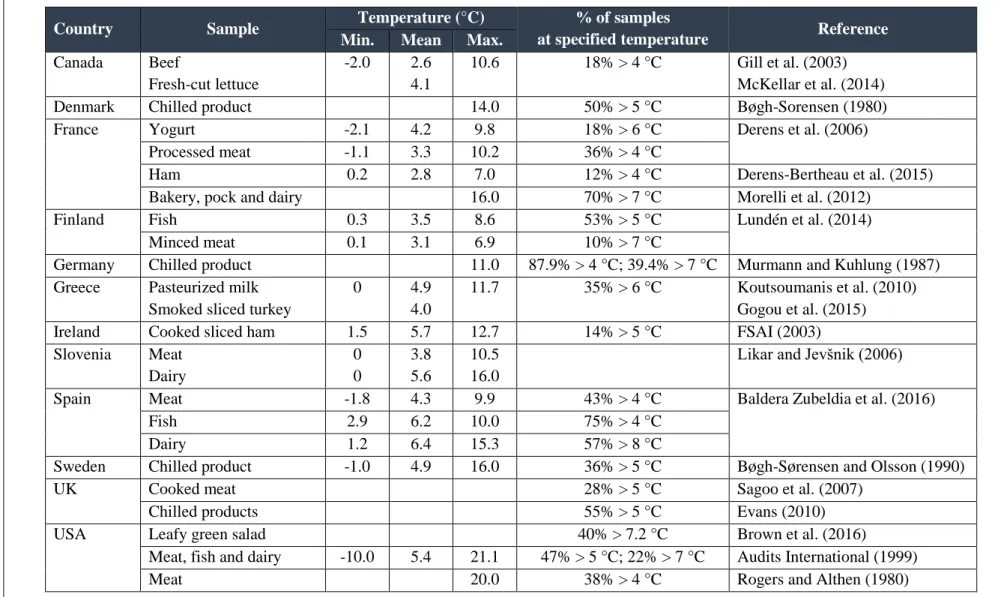
A retail display cabinet constitutes the last stage in the food cold chain prior to purchase of food products by consumers. Effective temperature control is needed, as the quality of the products on the shelves can be adversely affected by inappropriate control and inadequate temperature levels (Mariquele, 2012). Field surveys have been carried out in various countries in order to investigate and identify the ongoing situation of cabinet operation. Most surveys produced the same results: chilled food products available in retail stores are subjected to temperature abuse as shown in Table 2.1.
A field study was carried out in France. The temperatures of three types of food products (dairy, prepared and packed meat products, with a total of 307 samples) throughout the entire food cold chain were monitored (Derens et al., 2006). The results showed that around 30% of the products were stored at temperatures that
Chapter II – Literature review 18 were at least 2 °C higher than the recommended values. Almost a decade later, a similar study within the framework of the European FRISBEE project was performed using a ham product (Derens-Bertheau et al., 2015). It was demonstrated that food preservation in display cabinets tends to take place under better temperature conditions than in the past due to a decrease in the mean product temperature and a lower percentage of products in which the temperature is higher than the specified temperature. However, the authors noted that the results should be interpreted carefully, given that only a small number of samples (83 samples) was considered in this study.
The position in which food products are placed inside the cabinet is also important. Temperature differences of more than 5 °C were observed on the cabinet shelves by Willocx et al. (1994). When examining the effect of operating duration, they found that the temperature at one position increased by 4 °C towards the end of the day and by almost 7 °C towards the end of the week due to an increase in the store temperature. They also noticed that the top shelf had the highest temperature and that the opposite was true for the bottom shelf. This is quite different from Gill et al. (2003) who monitored the temperatures of beef products stored in open display cabinets in ten Canadian retail stores. The packages on the top and bottom shelves were similar and warmer than the packages on the middle shelves, while the packages at the front were warmer than the packages at the back. The results also showed that the maximum temperature of the selected product packages (5389 samples) from all stores was above 4 °C. Further investigation of this issue was performed in detail in a laboratory by Evans et al. (2007). Table 2.1 summarizes the field studies conducted in several countries.
C hapt er I I – L iter at ur e r evi ew 19
Table 2.1 Field investigations on chilled food products at retail displays in various countries
Country Sample Temperature (°C) % of samples
at specified temperature Reference
Min. Mean Max.
Canada Beef Fresh-cut lettuce -2.0 2.6 4.1 10.6 18% > 4 °C Gill et al. (2003) McKellar et al. (2014)
Denmark Chilled product 14.0 50% > 5 °C Bøgh-Sorensen (1980)
France Yogurt -2.1 4.2 9.8 18% > 6 °C Derens et al. (2006)
Processed meat -1.1 3.3 10.2 36% > 4 °C
Ham 0.2 2.8 7.0 12% > 4 °C Derens-Bertheau et al. (2015)
Bakery, pock and dairy 16.0 70% > 7 °C Morelli et al. (2012)
Finland Fish 0.3 3.5 8.6 53% > 5 °C Lundén et al. (2014)
Minced meat 0.1 3.1 6.9 10% > 7 °C
Germany Chilled product 11.0 87.9% > 4 °C; 39.4% > 7 °C Murmann and Kuhlung (1987) Greece Pasteurized milk
Smoked sliced turkey
0 4.9
4.0
11.7 35% > 6 °C Koutsoumanis et al. (2010) Gogou et al. (2015)
Ireland Cooked sliced ham 1.5 5.7 12.7 14% > 5 °C FSAI (2003)
Slovenia Meat Dairy 0 0 3.8 5.6 10.5 16.0
Likar and Jevšnik (2006)
Spain Meat -1.8 4.3 9.9 43% > 4 °C Baldera Zubeldia et al. (2016)
Fish 2.9 6.2 10.0 75% > 4 °C
Dairy 1.2 6.4 15.3 57% > 8 °C
Sweden Chilled product -1.0 4.9 16.0 36% > 5 °C Bøgh-Sørensen and Olsson (1990)
UK Cooked meat 28% > 5 °C Sagoo et al. (2007)
Chilled products 55% > 5 °C Evans (2010)
USA Leafy green salad 40% > 7.2 °C Brown et al. (2016)
Meat, fish and dairy -10.0 5.4 21.1 47% > 5 °C; 22% > 7 °C Audits International (1999)
Chapter II – Literature review 20 2.2.2. Experimental study conducted in a laboratory
Evans et al. (2007) and Evans and Swain (2010) performed extensive studies on the performance of different types of refrigerated display cabinets in terms of both temperature performance and energy consumption. These cabinets included well freezers, chest freezers, frozen and chilled door cabinets (solid or glass door) and open-front (chilled) display cabinets. The performance was analyzed under EN 441 test standard conditions (or more recent EN ISO 23953). For all cabinet types, the maximum temperatures of the test packages were generally in the areas the most exposed to ambient, whereas the minimum temperatures were located in the least exposed packages. For 135 open-front display cabinets, these authors observed that most of the packages at the maximum temperature (97% of observed display cabinets) were at the front, and 60% of them were at the cabinet front base or on the bottom shelf. Meanwhile, most of the packages at the minimum temperature (98%) were located at the back of the cabinets. These findings match those obtained in a study conducted by Bøgh-Sørensen and Olsson (1990).
To gain an insight into the evolution of air and product temperatures in an open refrigerated display cabinet under unsteady conditions, Laguerre et al. (2012b) performed an experimental study. The air and product temperature fields in the cabinet and the temperature and velocity profiles of its air curtain were mapped using the Particle Image Velocimetry (PIV) technique. The results showed that the on/off compressor cycle promoted variations in the temperature of the air stream. The air temperature varied readily, but the product temperature varied only slightly because of the thermal inertia of the products. The air temperature increased about 2.8 °C when the air flowed upwards along the back of the cabinet because of heat conduction through the wall. A temperature of 3.9 °C was observed at the supply air duct and the air temperature rose to 11.8 °C when the air reached the return air duct. As observed by Evans et al. (2007), the product position in the cabinet is a determining factor of its temperature. For this reason, the products located at the front of the cabinet had higher temperatures than those at the back of the cabinet. The product with the highest temperature was located at the front base of the cabinet and had a mean surface temperature of 9.5 °C, whereas at the back of this level, the lowest product temperature (0.9 °C) was observed. Based on the velocity profile mapped by PIV, the temperature fluctuations in the air curtain were affected by the
Chapter II – Literature review 21 introduction of ambient air via transient vortices which accelerate the infiltration rate. To determine the influence of operating conditions on the cabinet performance, a simplified heat transfer model was developed in a later study (Laguerre et al., 2012a), and these experimental results were used for the model validation.
2.2.3. The effect of ambient conditions
Howell et al. (1999a) monitored the relative humidity in eight supermarkets in the Tampa, Florida, area throughout the year (November 1997 to October 1998). This study aimed to evaluate the existing levels of relative humidity in a retail store. Overall, an annual average store relative humidity of 45% was observed: the lowest average relative humidity of 37% occurred in March and the highest average value of 57% was recorded in September. Howell et al. (1999b) demonstrated the influence of store relative humidity on display cabinet performance. These authors indicated that the performance based on energy requirements in the three components (cabinet refrigeration, defrost system and anti-sweat heaters) was strongly affected by the ambient relative humidity. Based on the results, the total energy demand of display cabinets was reduced by 10% when the store relative humidity was reduced by 5%, and consequently a 5% reduction in the total energy consumption of the entire store could be achieved. This can be explained by less frost formation on evaporator coils and less anti-sweat heat operation, and thus a lower latent heat load requirement. This observation is in agreement with that reported by Tassou et al. (2001).
Axell and Lindberg (2005) conducted field measurement of temperature variations in refrigerated display cabinets in three supermarkets in Sweden. They found that the outdoor climatic conditions influenced the indoor conditions of the supermarkets, given that the total electrical power consumed by chilled display cabinets increased 55% during summer. This variation was mainly caused by variations in the ambient humidity. In the supermarkets, the mean air temperature in the cabinets during daytime operation was 4.1 °C in summer and 1.9 °C in winter. The mean air temperature difference between the top and the bottom of the cabinets was 3.3 °C in winter and 6.7 °C in summer. A difference of more than 2 °C could be observed between daytime and night operation when a night cover was applied. Regarding this observation, the authors pointed out that night covers should be placed on display cabinets during closing hours because 50% energy savings can
Chapter II – Literature review 22 be achieved. Moreover, the authors concluded that the vicinity of open display cabinets has provided poor thermal comfort to supermarket customers due to cold air spillage from the cabinets (a so-called cold leg effect). The recent study confirmed this finding by comparing the ambient temperature measurement with supermarket customers/staffs responses to the questionnaires (Lindberg et al., 2017).
An experimental study was carried out in a laboratory by Chen and Yuan (2005). These authors found that room temperature and humidity caused an increase in the air temperature and heat gain in the cabinet refrigeration system. The temperature increase in the cabinet is mainly due to the increase in the room temperature, but this increase is also to some extent due to the humidity. However, higher humidity exerts effects on the latent heat gain, which in turn leads to higher energy demand. The effect of Reynolds (Re) numbers (based on the supplied air velocity and the width of the air curtain) on the air temperature distribution and total heat gain was also shown. When the Re increased from 4100 to 5000, the temperature inside the cabinet decreased 1.0-1.5 °C approximately. When the Re increased from 5000 to 5700, the temperature changed only slightly. The authors proposed the thermal entrainment factor to characterize the air curtain performance; this factor is correlated to the Reynolds and Richardson (Ri) numbers. This study also showed the benefits of the application of night covers, which enable more homogeneous inside air temperatures to be achieved. It should be borne in mind that the Reynolds number characterizes flow regimes for forced convection (laminar or turbulent flow) and the Richardson number characterizes the importance of natural convection relative to forced convection.
In accordance with the results obtained by Gaspar et al. (2011), the ambient climate exerts a great impact on the total heat transfer rate and infiltration rate. The latent heat transfer rate component increased 42% when the humidity rose from 35% to 60%. The heat transfer rate due to air infiltration was the individual component with the greatest increase (from 67% to 77%). As humidity has an immediate impact on the latent heat transfer rate, the authors emphasized that the influence of humidity should be taken into account when calculating the thermal entrainment factor. Heidinger et al. (2013) studied the influence of ambient conditions on the performance of the evaporators of refrigerated display cabinets. The climate classes