HAL Id: sic_00828615
https://archivesic.ccsd.cnrs.fr/sic_00828615
Submitted on 31 May 2013HAL is a multi-disciplinary open access
archive for the deposit and dissemination of sci-entific research documents, whether they are pub-lished or not. The documents may come from teaching and research institutions in France or abroad, or from public or private research centers.
L’archive ouverte pluridisciplinaire HAL, est destinée au dépôt et à la diffusion de documents scientifiques de niveau recherche, publiés ou non, émanant des établissements d’enseignement et de recherche français ou étrangers, des laboratoires publics ou privés.
A measuring instrument of the audience of a web site :
the network analysis
Eric Boutin, Jean-Marc Ferrandi, Philippe Dumas
To cite this version:
Eric Boutin, Jean-Marc Ferrandi, Philippe Dumas. A measuring instrument of the audience of a web site : the network analysis. The 15th IMP Conference, Dublin, Sep 1999, Dublin, Ireland. pp.1-21. �sic_00828615�
A Measuring Instrument Of The Audience Of A Web Site : The
Network Analysis.
Eric Boutin, Universite de Toulon el du Var fi'T, Toulon, France 1 Jean Marc Ferrandi, Universite de Dijon lut, Auxerre, France Philippe Dumas, Universite de Toulon et du Var, Toulon, France
Abstract
Marketing on the Internet upsets the traditional commercial techniques. To optimize the audience of its site, even its sales on this channel, a company needs relevant statistical data. The aim of our research is to renew the approach of Log files analyzers currently available, by showing the contributions of network analysis
Introduction
On the Internet, companies, universities or organizations have the possibility of providing their communities information pages on the Internet using the HTML format. These pages are related to one another by hypertext links. The aim is to constitute a showcase of its activities, to be present on a new communication channel, to meet a strategy of image or prestige and to support a networking strategy.
The communication process on the Web differs from traditional communication methods. Contrarily to the conventional media, the Internet allows clients to initiate the communication. Moreover, the visitor is active during the communication, rather than passive as with televised communication. The visitor's research starts with a voluntary step: seeking information on a particular topic, the visit's duration will depend on the quality of the answer provided. Therefore, it is necessary to apply to the confrontation between information supply and demand one of the elementary marketing rules: the supply must adapt to the demand.
If one is interested in Internet sales, one has to notice that to navigate in a commercial site is similar to visiting a traditional store. In a virtual store, the company needs to know the products with the highest demand, in order to improve product arrangement on-line to be able to optimize its sales. On a site, the site-owner needs to know which are the most consulted pages and the most frequently used links. Once this analysis is carried out, the owner can map its site or virtual store according its clients' expectations. Web audience measurement also meets another commercial need; Certain sites survive solely by using advertising banners (Onnein-Bonnefoy, 1997). It is therefore important to be able to justify the price paid by the advertiser for its banner - based on the banner's location. Equally important is to know how to place the banner, so that commercial optimization of the site can be achieved.
Thus, it is essential for the site owner to have captors in its environment which enable him to collect information related to the visits of the site, and to be able to process this data, to render it intelligible and useful.
1 Eric Boutin, IUT TC Universite de Toulon et du Var BP 132 83957 I.a Garde C'edex Hranee Tel : 00 33 4 94 14 22 16 Fax :00 33 4 94 14 25 37 email :boutin^'umv-tln.fr
/'/» McLoughlin, Damien. and C. Horan (eds.), Proceedings oj The 151'1 Annual IMP Conference, University College, Dublin 1999
We are interested here in an incomplete, but always-available source of information: the Logjile 1 , which records connections by the various users. Its analysis, over a given period, makes it possible to measure the site's audience, while drawing constants and answering the following questions:
What are the visitor's compulsory passage points, when establishing a connection to the website?
What is the path of a standard visitor through the site?
During a visit, how do the various themes and components of the site fit together?
On the site, are there obsolete pages that are visited an insignificant number of times?
In terms of the visitor's path, what are the homepages'.' From which pages the visitors tend to leave the site?
The statistical elements provide invaluable indications on site's use and make it possible for the company to adapt to the clients' needs. The "Centre d'Etudes des Supports Publicitaires"(Center of Study of the Advertising Media) retains four indicators of a Web site audience: the number of pages seen by each visitor, the number of visits over a given period, the geographical origin of connections and duration of consultation, per visit.
Our research aims to renew the approach of Log files analyzers and tools currently available, by showing the contributions of network analysis. This new step, used within other research frameworks in marketing (lacobucci, 1996; Boutin, Ferrandi, Valette- Florence, 1997) and in sociology (Degenne and Forse, 1994; Wasserman and Faust, 1994), is presented while being based on the audit of the CRRM (Retrospective Research center of Marseilles) laboratory server, carried out in December 1996. The study focuses on the analysis of 2869 connections recorded. These correspond to the consultation of 10 259 pages.
This server exposes the orientations of laboratory research (presented in appendix 1) and allows postgraduate students to house their html pages. The topics of these homepages are free and do not inevitably deal with the students" fields of research
It would be useful to detail the data gathering, processing and analysis steps. However, it is impossible to take such a step. Indeed, the network analysis encompasses many microanalyses that complement one another to give an overall picture of the phenomenon to be analyzed. The same complex phenomenon can arise under several facets, and each one of these refers to a part of reality. To carry out a sequential cutting would have led us to a great confusion, insofar as all these microanalyses would need to be presented, as well as all the resulting networks. We preferred to present each one of these microanalyses by showing which part of the question each answers. The data- gathering part, which is common to the whole of the network microanalyses, will be the only subject receiving a general presentation. The treatment and the exploitation of the resulting networks will be presented subsequently. Finally, We will carry out the overall evaluation of the method and show its contributions.
I The Log File And Its Treatment
We will expose the various forms that Log files can take and their inherent limits. The evaluation of the various Log files analyzing software will enable us to demonstrate the appropriateness of the network analysis
in McLoughlin, Damien. and C. Horan (eds.), Proceedings oj The 15"' Annual IMP Conference, University College, Dublin 1999
L The Log files.
The Log files, save on a text file the various actions carried out by Web server's visitors. Their analysis makes it possible to measure a site's audience. There are four types of Log files:
the transfer Log records the requests received by the server. There are three principal formats: the Common Log Format2 , format studied within the framework of this research, the Extended Common Log Format and Havest.
the error Log keeps the trace of the errors, which have occurred at the time of the remote loading of a page by the visitor.
the Referencial Log indicates the origin of the user and the origin of that user's connection.
the agent Log informs about the type of navigator (Nescape, Explorer, etc.) used by the site visitors.
To illustrate the massive character of information collected, we will depict three of 2869 connections. The resulting file, figure 1, is presented in the form of a succession of lines or hits. These three users respectively visited 5, 2 and 1 pages of the server of CRRM.
19451 254 3 --[OI/Dec/1996 01:36:46-0100] "GET /cgi-bm/Couni cgi°tr=N&dd=C|dt=polar dat HTTP/I 0" 200 907
194 51 254 3 - - [OI/Dec/1996-OI 37 55 -0100] "GET/entertainment/polar/polarweb/pwtete htm HTTP'1 0" 200 2440 | a Conn 194.51.254.3 - - [OI/Dec/1996 01.38:28 -0100] "GET/entertamment/polar/potarweb/album.htm HTTP/1.0" 200 2344
194.51.254.3 - - [0I/Dec/1996:01:42:09 -0100] "GET/entertainment/polar/polarweb/pwcritik.htm HTTP/1.0" 200 9407 194.51 254.3 -- [01/Dec/1996:OI:45:28 -0100] "GET /entertainment/polar/polarweb/pwlinks.htm HTTP/1.0" 200 1497 202 131 029--[01/Dec/1996 12 12 12-0100] "GET/vl/vlis html HTTP/1 0" 200 1876^ A visited page 202 131 0 29 - - [01 /Dec/1996 12 12 20 -0100] "GET /vl/metncts html HTTP/1.0" 200 9841
crrm.univ-mrs.tr--[OI/Dec/1996:12 12.12-0100] "GET/vl/vlis.html HTTP/1.0" 200 1876
ection
Figure 1: Example of Log file.
The Log file would only be presented in this form when one user at a time can be connected on the analyzed site. In general, the various lines are not classified by visitor, but rather in the order of their arrival on the server. To see the data as presented in figure
1; the collected data has to be sorted according to the connection date and time. 2.Limits of the information contained in the Log files and the solutions provided. The information contained in the Log files must be interpreted with precaution, due to the user identification and file construction methods.
In fact, each user is not identified in a unique way within the Log file. If two visitors having the same server name connect themselves to the same moment, their distinction will be impossible. This therefore introduces a risk of potential confusion. Moreover, the server address will never make it possible to know the user's name and his electronic address.
Furthermore, the file does not accurately trace the various pages visited by the user. When a user wishes to revisit a page that, his request is not always passed on the main site, but charged from the navigator's proxy3 or cache memory. Following the entire path of a visitor by using a Log file is therefore impossible.
The Log file records all new pages visited by site clients. Recording this information has two effects. The two subsequent pages in the file do not mean that these have a direct hypertext link connecting them. Moreover, the differential of time between two lines,
in McLoughlin, Damien. and C. Horan (eds.), Proceedings of The 15"' Annual IMP Conference,
during the same connection, should not be understood as the time spent only on a given page, but more like the time spent before visiting a new page.
There are two ways to manage the problem of the non-recording by the Log files of the entirety of the hits visited by the user.
Firstly, introducing on each page, a small dynamic image that will force the server vuth reconnect on the site server each time to refresh the image. All new display leads then to the displayed page being recorded on the Log file. An accurate file is thus obtained except if the visitor does not wish to see the images. However, applying this method would result in slowing down navigation on the Internet and in discouraging the visitor. Secondly, reconstructing from the Log file, the strategy followed by the site user. Assuming that the visitor uses the shortest route, we will consider when a link between two pages does not correspond to a real link, we will seek the shortest way allowing to pass from that page to the other. This shortest route, in graph theory, is called geodetic. Its determination supposes that the analyst has beside the Log file, for the period taken into account, information relative to all the geodetic ways between each pair of pages. It would be necessary, with this intention, to consider one time period when the site architecture was not modified. We did not take into account this type of analysis in this research.
3. Treatment of the Log files.
Initially, we will set out the results obtained by using the Log analyzers proposed on the market, to show the appropriateness of network analysis This anal) sis \\ ill be deepened.
A- The market Log file analysers.
The analyzers present in the market are located downstream from the Log file and often synthesize information in the form of statistical tables. We will successively expose three analyzer families , according to the degree of increasing complexity of the analyses they propose.
Analog" 2.115 (1998) is a black box-type software. It automatically generates a synthesized standard file, presenting the results in the form of statistical tables. These tables dissect information relative to the connection date (breakdown by month, by day, per hour), the visitor's address and the pages viewed by each visitor.
Webtracker6 (1998) presents three fundamental differences compared to Analog. It illustrates a family of the toolbox-type. The tables created are of the "cross sorting "and "flat sorting" types. This software makes it possible to cross the information contained in the temporal variable of its choice (date, week, month, year, hour, day of the week, month or year) with another variable (addresses, country of origin, visited pages, a number of transferred bytes). Lastly, each result can be expressed according to the occurrence in the corpus or the number of downloaded bytes.
Hitlist7 (1998) integrates a non-existent concept in the two preceding families: the session 8 concept. In the preceding families, the site audience was apprehended through the number of requests. From now on, it is also apprehended through the visit9 concept. However, in the Log files, the visits are not identified as such. It is necessary to reconstitute, on the basis of recorded succession of the pages, the pages visited by each user. In Hitlist, one supposes that when a visitor waits more than fifteen minutes on a page before launching another page, he starts a new session.
in IMcLoughlin, Damien. and C. Horan (eds.), Proceedings of The 75"' Annual IMP Conference, University College, Dublin 1999
The type of tables, which this software proposes provide a first idea of the activity, associated with a site and the various component pages However, this tool does not go sufficiently exploit of the visit concept: it contents itself with exploiting only the starting page of the visitor and the departure page, without truly being interested visitor's route through the site
B / a new fashion of treatment of the Log files: the network analysis .
Compared to these three tools, the network approach provides additional information. When a client connects himself on a site, the visited pages carry meaning. We can also be interested in viewing order of these pages. This order takes into account the links retained by the client. The commercial analyzers do not consider the sequential dimension of the consultation: they present the various informations gathered independently, without relating the various data to one another. On the contrary, the network analysis enriches this static information by the meaning that is given to the links, thus reconstituting the step of the user's steps.
The consultation of a page by a great number of clients can be due to two elements in interaction: the intrinsic quality of the page and/or its position compared to the other pages. The traditional statistical analysis will not make it possible to judge this second criterion. On the contrary, a representation in the network format will make it possible to view this page in its context and to characterize it by a certain level of centrality. To be able to implement the network analysis , preliminary data processing is necessary. The purpose here is to structure information in a format that will authorize the exploitation of the data by the Dataview (Rostaing, 1993) automatic treatment tools and the network analysis software Matrisme (Boutin, 1999).
The great difference between the initial and the formatted file, is that the latter research to reconstitute, starting from a whole of hits each positioned on a line, the connection carried out by a user on the site. As the same visitor can connect himself on several occasions to the site, if one wish to isolate each work sequence, we should considered that after a certain lapse of time, a new connection started. We have estimated that a period time of more than ten minutes would corresponded to a ne\\ session of work. This variable is skeletal.
The manual treatment of the thousands of lines of the Lug file being impossible and as these files have a homogeneous structure, the data formatting was automated by using a data-processing routine (Webmap). Webmaps make the creation of five additional indicators by using a combination of the three basic indicators (client-server name, connection date and names of visited pages)
_____ ^/ The form separator is a ________________
Adresse:194.5l.2£i.3 protbndeur: 4
heuce:Q 1/12 01:42:09
relam9ns:/entertainment/polar/polar\veb/album.htm </'/entertuinmcMit/polar/polar\veb/p\\cntik him
somtps^ T^ ^* a reference
tps:4
last:non , T ,_. <•• , , -, ,•
This field contains 2 forms
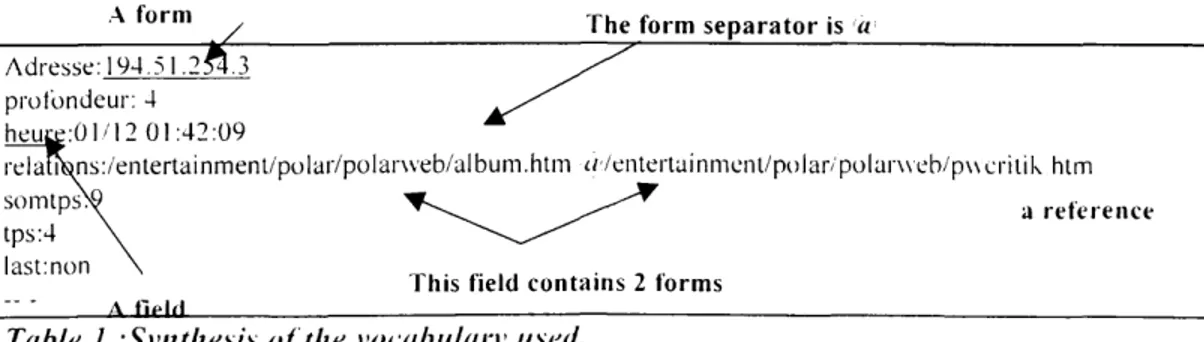
Table I -.Synthesis of the vocabulary used.
An example of the formatted information structure stalling from the first fi\c lines of the figure 1 file is exposed in the table 1, which presents a synthesis of the vocabulary used.
in McLoughlin, Damien. and C. Horan (eds.), Proceedings oj The 15'1' Annual IMP Conference,
Seven fields indicated by one or more methods are defined. This information is richer than the initially available information: five additional pieces of information appear.
1. The level of depth : it corresponds to the number of successive pages viewed by the visitor before revealing the active page. Thus, a depth of 1 corresponds to the page by which the user arrives on the server. The higher the depth, the longer the visitor has been on the site.
2. Two last visited pages : When the user charges a page, the "relations " heading indicates the last two pages viewed (the forms pair). This section energizes the static information contained in the initial file. For a depth level of 1, the relation field is indicated by the mention "ND "(Non-Definite), since the visitor has just connected himself.
3. The time spent by a client between two pa^es: For a given connection, it is given by making the difference between the dates taken two to two. This information contained under the heading "tps "is expressed in minutes. The higher its value:
the more the time spent on the page is great. The time spent on a page depends on the interest of this page for the user.
and/or
The longer the transfer time from one page to the next is high. This time is an increasing function of the number of images that the page must charge, of the degree of network saturation per hour of connection, of the number of intermediate pages to visualize before arriving on a new page.
It can thus be difficult to interpret as in indicator of page relevance.
4. The total time spent by the client on the site : it is obtained by adding the time spent on each page. This information contained in the "somtps "section is expressed in minutes.
5. The last page viewed by a customer : it is identified when the field "last "is 'yes 1 These few indicators make it possible to answer the following questions: What is the entrance point of the site? What is the breaking point of the connection 9 What are the most viewed pages? To which themes do they correspond? What is the average time spent on the site by a visitor9 What are the links between each theme and each page viewed by the visitor9
Other indicators could be defined according to the study's aims: day of the connection, country of origin of the client, when is this information available. However, we did not retain these parameters.
The data formatting process is accompanied by elimination of two types of non-relevant data for the analysis. The first corresponds to the connections established on the in- house site. Insofar as the goal is to make the server audit, it appears more judicious to analyze separately the connections from other servers. This is why the first were withdrawn. In addition, when a page is loaded, each image that is associated to it has been the subject of an additional line in the file. If the goal is to follow the actions realized by the visitor, taking into account of these automatic loading is useless. This is why the pages, where an extension "gif" or jpg" appeared announcing the presence of an image, were removed.
By formatting our raw information, we have achieved the first step in creating work of an added value
II The Measurement Of The Audience Of The Site Of The C'rrm.
in McLoughlin, Damien. and C. Horan (eds.), Proceedings oj The 15"' Annual IMP Conference,
University ( olleye, Dublin 1999
Our approach is based on the construction of a graph called network. The graph's peaks represent the various pages of the CRRM site pages. An arc between two peaks means that the visitor went at least from one page to the other. The network interpretation can be done in a very intuitive way. Visual observation of the graph, and using synthesis indicators make it possible to rationalize the analysis by extracting a certain number of peaks that have particular properties.
We will consider successively two complementary approaches to the problem. Initially, we will reason on the whole network, which shows all realized connections, whatever their duration or their depth. Then, we will improve our comprehension of visitor behavior by examining a few particular networks.
1.Analysis of the overall network.
The network which represents the path of 2869 visitors to the site over the period investigated is represented in a highly complex graph : the network describes only the reality with as little deformation as possible. The more complex the reality, the more complex the network.
Several analyses that use the filtering technique can be carried out to obtain useful information from this network. Filtering will consist, according to the case, in removing from the whole network certain peaks or certain links or both. We identified three possible types of filters: the filtering of "pairs'" 1, that of "forms" and that of "connectivities"
The filters can be implemented manually or automatically. When filtering manually, the criteria between selected and non-selected pages is determined by the analyst according to his experience. When filtering automatically, the information selection is given directly by the Matrisme software. However, the automatic filter can only be implemented if the elements of the field considered, ranked to their decreasing frequency produce a zipf curve representation.(Zipf, 1949) illustrated in figure 2.
Tague and Nicholls (1987) define the Zipf curve by the function g v = — where gx represents the number of modalities appearing x time exactly, a the number of elements appearing only once
b the frequency modalities dispersion.
This curve illustrates the fact that on the CRRM site, a few pages are very frequently visited, a great number of pages are visited a small number of times and a certain number of pages are visited an average number of times.
The site pages, which are the least visited, are interpreted in two ways: they are either pages recenly introduced into the site, or pages that can be analyzed in terms of "statistical noise ". Indeed, these peaks would be likely to disturb the network's readibility if they were preserved. Symmetrically, the pages which appear frequently, correspond to commonplace "information" meaning that being too generic, they do not make it possible to discriminate between bodies of information the information.
Lhen and Al (1995) showed that the Zipf curve can break up into three parts considering the concept of entropy of Renyi.
1
The entropy of A order is defined by: H a = x logY (p,) , such as *
1-a t?
a is different from 1
n represents the number of distinct modalities on the whole corpus, p, probability or appearance frequency of the modality I in the corpus.
in McLoughlin, Damien. and C . Horan (eds.). Proceedings of The 15'1' Annual IMP Conference, University College, Dublin 1999
These authors showed that the entropy of order 2 (\\ith a-2) makes it possible to determine the threshold separating trivial information from interesting and that the entropy of order '/<> (with a=l/2) makes it possible to separate interesting information from the noise.
Frequency Trivial Information
mteresting information
Statistical noise
Modalities
Figure 2: Cutting of the Zipf curve in three parts by using the entropy
A- pairs filtering
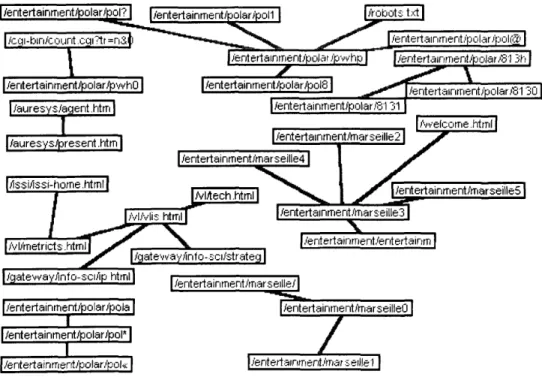
The starting point of this analysis consists in noticing that the initial network i^ rendered unreadable by the excessive number of links that appear within it. However, these links do not all have the same weight. The strongest, which corresponds to the thickest arcs, are associated with sequences of pages more employed than others. If we are interested in the links between the most often used pages, we will apply a filter that will eliminate the weaker links. The frequency of linkage lower than 6 corresponds to the statistical noise previously defined, and were removed from the network figure 3.
In each box the page name appears followed by the number of visitors who visited it. This network emphasizes two types of activities on the server: a leisure activity represented on the left part of the network and a research activity.
The importance of the leisure activity which seems paradoxical on a site devoted to research, is explained by the existence of two types of page structure on the server. The leasure activity is organized in a linear structure. When the visitor surfes through such a page, he has two alternatives: to continue or to go back. The research activity of this web site is illustrated in a star shaped structure. In this case, each page refers to many potential pages so that the user has a great number of possibilities on each level. It is possible to extract from this network various topics that are the subject of specific frequentations. The visitor often connects himself to a very limited space of the site inevitably without widening his investigation on related activities developed with the CRRM. The relative separation between the research and leisure types of activities can be understood. However, we find this same phenomenon within the site's research components. It would undoubtedly be convenient to create adequate bridges between the various topics structuring the research type.
It is possible to extract from this network various topics that are the subject of specific frequentations. The visitor often connects himself to a very limited space of the site inevitably without widening his investigation on related activities developed with the CRRM. The relative separation between the research and leisure types of activities can
i/i McLoughlin, Damien. and C. Horan (eds.), Proceedings of The 75"' Annual IMP Conference, University College, Dublin 1999
be understood. However, we find this same phenomenon within the site's research components. It would undoubtedly be convenient to create adequate bridges between the various topics structuring the research type.
itertainmentfoolar/pol| ^/entertainment/polar/polO ^/entertainment/polar/pol! 29] l/gateway/info-sd/strateg 47 |
| /entertairiment/polar/pol{ 781 l/entertainment/poter/pol? 21 html 119
/oateuia y/lnto- *(. i/inf o
l/entertainment/polarvlreeh 76 1 ome htm 16 [____
iteftainment/pol3r/pol£ 76] —— I /entertainment/polar/pol &<
•^ ' — '
--[7g3t*M.i3 V rinTo-ici/ip html 40 '-f/vl/metriots html 138 | J _J/i.-.-i/lfsi-home html 5' \/ t/^Mjnf html 24 [ l/entertainment/polar/pal^ 124] | /entertainmerit/polar/pol ° 9C htm 27 l/entertainment/polar/pola 231 n————;———--7——T7- l/auresys/preserit htm 90 | fentertainment^olarypolS 77]—— iteftainment/polar/polS 24 [ Ttertainmentfoolar/polfl 2T] | /entertainment ypol3r/^ol425| l/entertainmentfoolar/piiuhO 43] htm 27 | l/auresysfoereo/iridex.htm 341 |/vrs_frv1ivres/pdp.htm 22 | l/entertainmentTpolarypolS 261 |A/rsJ nfrecherchdabo.htm 221 l/vrejr/livresrtiibliome.h 2Q |
l/vrsjr/garde.htm 52 | | /entertainment/polar/poie 22~| [/entertainment/polarfooU 50] [Auelcome.html 97]
[/vrsJr/livresAitreihtm 24] | tentertainn-i&nt/polar/8 132 271 , „, I f/Vrs frvlivres/sommaire h 24 ^ 371 '——=———-r————————' polar/8 13h 62 | \ olar/8130 50 |
^•^\.
0 |/entertai ___ ________„_______ [yVrs_fr/livre;/livres htm 23] 'entertainment.'Vnarseillel 116 [4^r|t^rtainmerit/h-i3rseille4 65]—————————————— —————^————————=L n "l/orps/divers/drri/rappQrt 22 | /errtertainment/marseilleS 71 l/errtertainment/rriarseilleO 751 /enteftainment/^olar/sni 5 /commercial/software/data IS /entertainment/polar 13/ 25 |/orps/ofps-home.html 76 | |/ofp s/imst/inigt-bib.htm /entertainment/polar/pol^ ;'21 |/sd/sori97htm 201 [fed/sonO htm 2S | /errtertainment/marseille 1 27 [/antertairiment/polar/poli 451 i .htm 24 [/urs_tr/forTTia/ti:irlLi htm 47 file-rouije/prog htm 49 ni htm 16 I l^ritertainment/polar.'li.^ IS | l/eritertainm^nt/polaMruD 24 | l'il*-rou.r ':e.''ctr htm I I'D
[/entertairimentfoolar/liu ^ 20
| /errteftainment/polarjli v 2 171 |/enteitainmenty>olaMi..1 161
Figure 3: Network obtained by retaining pairs higher or equal to 6.
B / the forms filtering.
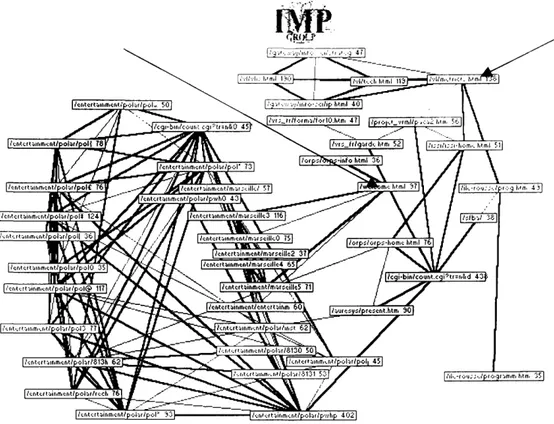
The starting point of this analysis is the existence of pages that are visited more than others. To increase the graph lisibility, we will retain only the most consulted pages. This corresponds to a form filtering. The network, figure 4, corresponds to the initial network for which only the 35 times or more viewed pages were retained. We eliminated the frequency pairs equal to 1. The characteristic of this filtering is to give more importance to the peaks than to the links.
This network confirms the idea of a segmentation between research and entertainment parts. The bond between these two components is carried out via the "Welcome html" page, which was consulted only 97 times at the time of 2869 connections, fhis page is a network outpoint. It indicates a graph peak ; Us suppression \\ould make it possible to enhance the number of strongly related components on the network Similarly, the graph emphasizes the completely central role of the "vl, metrics.hunT page which appears in the north of the network.
in McLoughlin, Damien. and t. Horan (eels.). Proceedings oj The 15'1' Annual IMP Con)erenn\
Figure 4: The Network Pages viewed more than 35 times.
The site visitors use this page as a guiding point, insofar as it makes it possible to go to other pages. It is undoubtedly a model to be followed.
C / the connectivity filtering.
A. third filter can be applied to account for the visit of the CRRM site. It is based on the fact that the great network complexity is often due to a few peaks that have a great number of relations with many others. We call this connectivity associated with a peak X, the number of arcs originating from this peak.
Two distinct networks can be generated from this concept. The first consists in eliminating the peaks from which the most links originate, and thus in putting forward the emerging structure. Contrarily to the previous filter, the second consists in retaining only the pages most related to one another, making it possible to clear the network metastructure. Such an approach is able to determine the most central peaks in the degree of centrality 1 '
This is what we did in figure 5. This network shows pages that link with at least 9 others. This set has the property to be a 9-core. It is composed of 14 pages. If only one of these 14 pages is deleted, then at least one of the remaining 13 pages will have no more than 8 links with the others.
Among the 2869 connections analyzed, it is not possible to identify a k-core' : , with K being higher than 9. This 9-core was obtained by an iterative process until the connectivities filter stopped. If we had sought a 10-core, no network could have been represented. The 9-core thus defines a group of peaks that maintains dense relations with one another. All these peaks can return to ludic pages.
in McLoughlin, Damien. and C. Horan (eds.), Proceedings of The 15th Annual IMP Conference, University College, Dublin 1999
J/cL)i-bin/count c g i ?tr= n&D 45 f l/entertainment/polar/pok "50 [ /e nt e rt a i n rn e nt7p o I ar/p ul{ 78| [7entertainment/pola't/pol£ 7G !l/ent e rt ai n me nt/p o I a r/i n st 62 /entertainment/polar/poli 45 |/entertainment/polar/rech 76 |————|/entertainment/polar/pwhp 402 Figure 5: 9-core
2. Towards a better understanding of the behavior sequential site visitors.
It is possible to build particular networks which make it possible to answer to the three following questions:
How far must we go in this analysis? Each analysis can be brought to the overall level of the visited pages, from a group of corresponding pages of a particular theme or from a specific page.
Which part of the connection interests us? We can pay attention to the anchoring point of the visitor, the connection breaking point, to a specific page or to the whole of the pages visited during the connection.
What category of visitors interests us? We can study all the site visitors or certain categories, on the basis of the time spent on the site or any other criterion. If the time spent on the site is an indicator of the degree of interest expressed by the visitor, we can be interested in all the clients, those who were connected for a long time, or those who had a fast path through the site, which can indicate that their needs were not met.
A- The beginning and end connections
Two privileged moments can be object of analysis. The first focuses on the first page the visitor viewed. The second deals with the page from where the visitor will leave the site. Rather than to present the links successively, which would bring us to study 'flat- sorting' 13 tables, we will be interested in the first and the last links carried out by the user. In both cases, for clearness reasons, only frequency pairs higher or equal to three were retained. As we already mentioned, this would over-valorize the ludic parts.
One thousand five hundred and nine visitors clicked at least once on a hypertext link on the CRRM server The network, figure 6, thus restores approximate!) 53 "<, of initial information.
The other half of the CRMM site visitors viewed only one. Is this low depth of the visits specific to the CRMM server or general to research servers 9
in McLoughlin, Damien. and C. Horan (eds.), Proceedings oj The 15"' Annual IMP Conference, University College, Dublin 1999
This network makes it possible to gather the various pages in eight strongly related components. The ludic part, most represented on this network, is subdivided in several tight components. The two principal ones are formed from the two roots "entertainment\polar "and " entertainment\marseille. "
I /enterlainment/taolar^oPl |/entertainment^olar/pol11 I/entertainment/polar J813h | | /entertainment/polar/polaj | /entertainmerit/polar/pol*] I l/entertainment/polar/pok | [/entertainment/marseilleO \ | /entertainment/marseillel]
Figure 6: Nefrvork constructed from the first link of each visitor.
The welcome page of the CRMM site, "welcome.html, "only used six times as such by the visitors, that is to say 0.2% of connections, appears completely peripheral on the network. Yet the site is structured around this page which has a double function: to be used as guiding point and to respect a teaching step of presentation. The disinterest observed for the preset welcome page by the developers leads to reflections relating the causes of this phenomenon and more fundamentally to its implications.
Two reasons can be put forward to account for the weak attention paid to the welcome page. Firstly the CRMM site visitors often do not arrive on this site for the first time. They then could connect to these pages in a repertory of addresses and thus have direct access to it. The second reason is to the fact that the pages, whose frequency is relatively strong, often correspond to direct cross-reference from research engines or other sites. The "vlis.htm" page is for example a cross-reference of the CERN virtual library. Thus an informal structure emerges which draws its legitimate form its use, coexists with the official site structure designed by the CRRM's team. Its existence and its weak overlapping with the formal structure leads to raise some legitimate questions.
Can the CRRM site developers continue to structure their server around a pivot page whereas it does not have any real legitimacy?
How is it possible to manage the fact that there is not one, but several welcome pages? Can the site structure be adapted so that a user who arrives on a page that is not the official welcome page can connect to the other parts of the site each?
Do users whose site exploration strategy does not conform to the site developers' intended structure lose something?
//; iMcLoughlin, Damien. and C. Horan (eds.), Proceedings oj The 15'1' Annual IMP Conjure/ice, University College, Dublin 1999
Do the hypertext links, however simple to go from one concept lo the other, escape the site developers, meaning that information can be read in any direction 9
The answer to some of these questions is certainly in the creation of interlinks, of horizontal links between the various topics developed on the site.
If we were interested in the last link carried out by the visitor, one would confirm and complete the following conclusions: the research part is a minority in the site leaving pages, the ludic and research parts are disjoined and structured around strong groups. It is however difficult to go much further in the interpretation of these types of results, because of the reasons that motivate the disconnection, can be the satisfaction to have found the required information or on the contrary the spite not to have found anything.
B / degree to which the analysis is refined
Until now, we retained in the analysis all the pages of the CRRM site without restriction of topic. We now propose to study specifically the behavior of visitors who spent time during their visit on the "vlis.html" page, which belongs to the research part of the site. The network, figure 7, shows the interest of such an analysis. It represents all the pages viewed by the visitors who entered directly on this page and who clicked at least twice on a hypertext ink (threshold determined by the entropy of order '/:>). These visitors correspond, on the one hand to those that we had identified as the people sent by the server of the CERN, and on the other hand to those who had put this page in their bookmarks. The network shows all the links and pages seen at the time of 65 connections without any restriction.
Figure 7: Path visualization of the 65 users of the vl/vlis.htlm "page "
These visitors differentiate themselves from others because no ludic page appears in their exploration. Their behavior is a little scattered and the network manages to give a clear account of their navigation. These 65 people looked at only 27 distinct pages.
in McLoughlin, Da mien, and C. Horan (eds.)i Proceedings of The 15<h Annual IMP Conference,
In spite of their interest for the technological survey, the 65 visitors did not exploit all CRMM site information. Certain sections of the research part that relate to the "Auresys" or "orps" robots are missing from their consultation. Undoubtedly, a clearer highlighting of the link towards the welcome page would attract these captive visitors towards the other laboratory resources.
Moreover, the low number of links on the whole shows that the navigation of these visitors was confined in some pages. This low link depth is due to the fact that the two boxes containing the term "gateway" lead to other sites. Fourty-seven of the 65 connected people came out of the site via these footbridges which seem to function as an escape system.
The visitor, who consults the "vlis" server branch, enters a very particular strategy, where the CRMM will play the part of switchman towards the other Internet resources.
C/Specific analysis of certain visitors.
We will study the CRMM site visitors according to the duration of their connection. We chose to privilege the 169 visitors who connected themselves more than ten minutes. These visitors, determined by the calculation of the order !/2 entropy, correspond to the previously defined noise. This specific analysis type is justified that one can think that the longest connected people are those who express the most interest in the site. They merit priority in our interest..
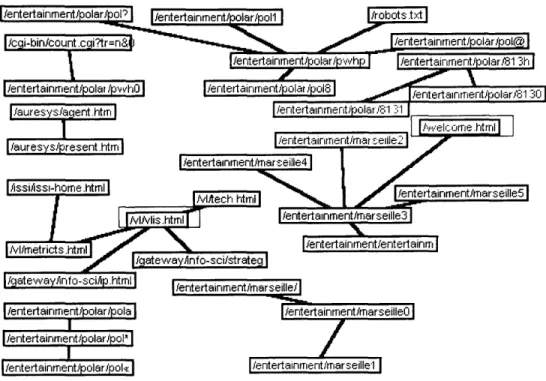
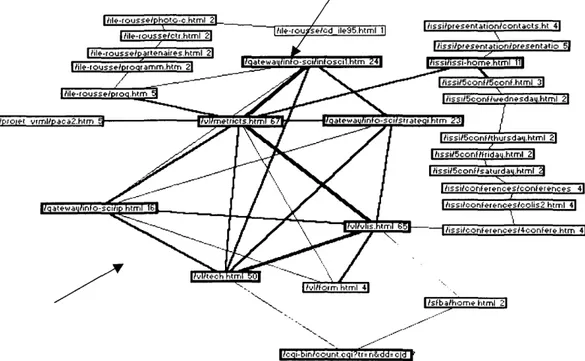
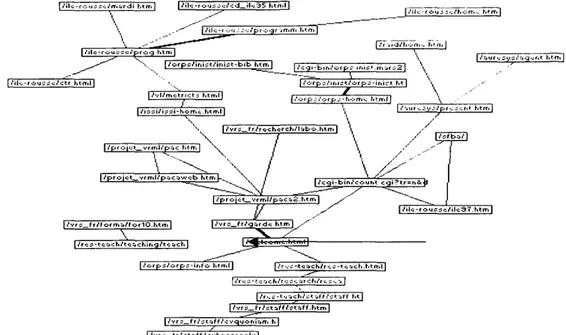
Two successive networks apprehended their analysis. The first, figure 8, visualizes the pairs frequencies higher than four. The second, figure 9, are interested in the pages devoted to research viewed nine times or more at the time of these 169 visits.
I /entertainment»olar^ol?1 |/entertainment/polar/poll [/cgi-bin/count .cgi?tr =n&(i
| /robots txt| I/enter I | /entertainment/polar Sp whp | i/entertainment/pQlar^SI 3h | | /entertainment/polar/pwho] 1/auresys/agent.htiTil l/auresysferesent.htmj l/entertainment/polar/frolS | [7entertainment/polar/S1 31 r/entertainment/marseille21 |/Welcome .html | l/entertainmerit/marseilleTI j /entertainmentATiarseille3 1 1 /entertainment/marseilleSl | /gateway /info-sci/strateg] l/entertainment/entertainm) | /entertainment/ma^ii [/entertainment/polar/polal I l/entertainment/polar/pol* | | /entertainrrier[t/polar/pol«| l/entertainment^Ttafseillel
Figure 8: Network of the users who remained more than ten minutes on the CRRM site by retaining the pairs frequencies higher than 4.
in McLoughlin, Damien. and C. Horan (eds.). Proceedings of The 15"' Annual IMP Conference, University College, Dublin 1999
The Figure 8 confirms the preceding intuitions. The ludic pages' presence is strong for the visitors who connect themselves more than ten minutes. In this ludic component, the "entertainment\polar" part occupies an essential place. This privileged position corresponds to a site devoted to detective novels strongly approved by the visitors, therefore certainly extremely relevant. The part devoted to research is minor on this network, but the zoom, figure 9,makes it possible to comment on the more consulted site research orientation. We note a strong interrelationship between these various orientations structured in a quasi arborescent way around the welcome pages.
The share devoted to research is minor on this network, but the zoom, figure 9, make it possible to comment on the research orientations of the site the most consulted. One notes a strong interrelationship between these various axes structured in a quasi arborescent way around the banner page.
This network shows that the visitors, who connected themselves during more than ten minutes and which are interested in research, have a systematic research approach oriented towards the in-depth exploration of the CRMM site.
nV-j.d/hom.. hVn .| X l/»fps'inis</inist-b'b_j>t™l I ,'c.JI -b l r.,'c.rp^ .ms'.maf sS [/iU-roussc^trhdT.11 l/vl/fnetncts htrr.l| / \ f77^-F7 \ ' ~ |/proiot_vrrr,l,' p;1 c httr.l \ ~yp= —— ? ——— / ———— " —— j— 1 , , ,,.,,,\ / \ / i^f>a/ i
/
\
/ ,-^i
T'lFigure 9: Network of the pages devoted to research viewed nine times or more by visitors connected more than ten minutes.
Ill Contributions Ot The Network Analysis .
The network analysis made it possible to exceed the information provided b\ the commercial Log files analyzers and would offer to the companies nc\\ means to measure their Internet site audience.
/. The network analysis contributions compared to the commercial log analyzers.
Through this research, we could determine the compulsory passage points of the visitor. When he is connected to the CRRM site, the path of the standard user, the articulation between the various themes of the site, the obsolete pages, the welcome and exit pages.
in McLoughlin, Damien. and C. Horan (eds.), Proceedings oj The 75"' Annual IMP Conference, University College, Dublin 1999
Compared to commercial analyzers, the network analysis reconstitutes the step by which the user approaches and leaves the site. It takes into account the sequential dimension of the consultation. Adequate to create links between available information, it gives a direction to the user's visit. It makes the visualization of a page in its context possible, being characterized by a certain level of centrality.
Moreover, the approach network energizes available information It determines the topics being subject to a particular frequentation. It specifies the pages strongly connected to one another and thus of the server's metastructure.
Lastly, we could define a certain number of networks according to the degree of the depth analysis desired. The connection part that interested us and characterizes the server's clients on the basis of time spent on the site.
2. The marketing contributions of the network analysis .
On the Internet, marketing is based on the primordial initiative left to the client in the search of information, even of purchases and on the company reaction to the requests and demand. The client communicates, the company listens and tries to satisfy his needs. The problem is to permanently have means to create "more "for its visitors by introducing useful information, reliable with each stage of the decision-making purchase process.
To attain these goals, it needs an attractive site in terms of information contents, conviviality, user-friendliness, navigation easy and even of interactivity. The log files network analysis is able to bring answers on the company choices relevant to the first three criteria.
This analysis made it possible to better apprehend the visitors' behavior with regards to site navigation. It could be the same for their manner of buying, if we had analyzed a commercial site. Such a tool, with the knowledge it offers, must help the company to increase the shopping basket on its site by showing the strength and the weaknesses of the interface.
Moreover, it is possible to differentiate the visitors according their site use, to segment for example the purchasers and the non-purchasers on a commercial site. We can determine the path of each visitor on the site, the pages and services of interest to him. As this approach makes it possible to construct networks from a particular page, a measurement of the promotional offers of virtual shelf heads is realizable.
In short, thanks to filterings carried out, the network analysis indicates the level of relevance of pages on an Internet site. Whatever the level of analysis, the depth degree, the part of the connection or the visitor's category that interest us, these filterings are necessary.
A page will be relevant if
during a pairs filter, there are strong links between this page and the others, during a forms filtering, the page is seen a great number of times,
during a connectivities filter, the page has a great number of links with other pages. For example, when the company wonders about the page on which it should put a publicity, the connectivities filtering seems particularly interesting. Indeed, obtaining a network K-core makes it possible to know the pages that maintain the dense interrelations and the topic with which they deal A publicity on this topic v\ill have more impact if it is placed on one of these pages because of the audience which it \\ ill be ensured to have: any visitor viewing an unspecified page of the K-core will pass
in McLoughlin, Damien. and C. Horan (eds.), Proceedings of The 15"' Annual IMP Conference, University College, Dublin 1999
systematically on the page where publicity is. This will enable the announcer to refine its targeting and to reduce its useful contact cost: compared to the page most viewed on this topic, pages for which one does not have a precise idea on the reasons of the user's frequentation, the company is sure to reach the people particularly sensitive to this topic. Two future ways of research arise.
1. We have within the framework of this research improved comprehension of the serial user's behavior on an Internet site. However, it is not possible for us to apprehend the bases for these behaviors. It thus seems important to set up experimental plans in laboratory to improve knowledge of the user's operating mode in front of a commercial site and to understand the reasons of his behavior.
2. The zipfienne distribution, which enables us to break up available information into three parts, corresponds to a stable dynamic system. At one time T, a corpus is composed of an active continuum of emergent modalities with weak frequency with ripe modalities for which the appearance frequency is stronger. At the moment t+1, a translation of the curve occurs to the peak while new emergent modalities appear. In time, owing to this dynamic system, we should be able to evaluate the site visit modifications and thus to measure the effectiveness of the promotional actions or transformations realized.
In this type of study, we have voluntarily chosen to apply the network approach method to a field of study with extremely high competition. According to the economic importance of the web audience measurment, this type of application should develop quickly, and a great number of business corporations already position themselves on this segment. The study of competition did not enable us to yet identify tools that are positioned on the network analysis gap. For the moment, it thus is an isolated gap with great potential for development.
Notes:
1. The reader wishing to look further into these concepts will be able to refer to the work of Stout (1997).
2. An example of line in Common Log Format is:
194.51.254.3 [ 01/Dec/1996:01:37:55 -0100 ] " GET
entertainment/polar/polarweb/pwtete.htm HTTP/1.0 " 200 2440 where: 194.51.254.3 indicates the machine name of the site visitor
[0 I/Dec/1996:01:37:55 -0100] the hour of connection
" GET / entertainment/polar/polarweb/pwtete.htm HTTP/1.0 " the name of the page viewed by the visitor
200: this value indicates if the file were correctly found (code 2xx) 2440 indicates the number of transferred bytes.
3. A proxy indicates a computer which is intercalated between a private network and Internet to act as a mask and which records the Web pages transferred by the users to deliver them without it being necessary to be connected on the initial server.
4. The Eog analyzers, which we tested, were downloaded in demo versions from Internet
5.Analog is a software created by Stephen R.E. TURNER of "Statistical Laboratory, University of Cambridge, " sreilurcam.ac iik. Downloadable software with the following address: http://www.statslab.cam.uk;-sret 1 analog
in IMcLoughlin, Damien. and C. Horan (eds.), Proceedings oj The 15"' Annual IMP Conference, University C ollege, Dublin 1999
6.Websracker 21.42 is a software created by the company "Cambridge Quality Management "me 1639, 9th Avenue, San Francisco, California 94122 USED. A demo version of this software is available to the following address: http://www.QMInc.com / V.Hitlist is a software created by the company " Marketwave Corporation "1415 Western Which occurred, continuation 488, Seattle WA USED 98101. A demo version can be downloaded @: http:///www. marketwave.com /
8. A session indicates the whole of the pages scanned by a visitor at the time of a site visit
9. A visit can be defined as the whole of the requests carried out by a visitor at the time of a connection
10. "/ cgi-bin/count.cgi?tr=n&d "are not pages but meters which are incremented when the page where they are located is launched. For this reason, we neglected these network cells.
1 1 .Regarding the degree of centrality, a peak I is more central than a peak J if it has more peaks which are adjacent for him than the peak J mathematically, the centrality of degree associated with peak 1 is obtained b> the following formula: cd' I "-or w/ MJ indicates
i
a binary value equal to 1 if there is an arc between peaks 1 and J and U in the contrary case.
12. A K-core gathers a whole of peaks such as each peak is connected directly to at least a number K of other peaks of the same group.
13. These tables were carried out and we will refer sometimes in the text to their contents. We did not expose them in our development, because we wish only to concentrate us on the contributions of the network analysis
Appendix 1: : Research orientations present on the site of the CRRM.
/ vl/metricts.html : Virtual bookshop in information sciences animated by Luc Quoniam
/ issi/issi-home.html : The International Society for Scientometrics and Informetrics organizes the biennial ones. Next A place in Jerusalem in June 1997. The CRRM is present at each one of these conferences.
/ orps/orps-home.html : The Regional Observatory of the Scientific Production Provence-Alp-Coast-d'Azure is carried out by the CRRM with the collaboration of a certain number of Institutions and people It must allow a better legibility of the whole of the scientific productions of the various regional actors.
/ island-rousse/prog.htm : This Conference is organized by the French Company of bibliometry applied (SFBA). It is held every two years in Corsica around the following sets of themes: Bibliometry, Linguistics, Strategic Information, Technological Survey, Economic Intelligence.
This site includes/understands the interactive presentation of the conference and the SFBA, the complete texts of the communications, the photographs of the conference and the participants.
/ auresys/present.htm : The design of an automatic research robots is the object of a report of DEA Scientific and Technical Information carried out with the CRRM by Bruno Mannina. AURESYS makes it possible to remotely create questionable Databases by several users. Information is recovered from the NET, then treated to be stored in these databases. Each Base of Data answers a personalized request of a user. Thanks to the Databases created, AURESYS gives the means to a user of in McLoughlin, Damien. and C. Horan (eds.), Proceedings of The 15"' Annual IMP Conference,
University College, Dublin 1999
having a maximum of information referring to a given subject. Constitution ol an analyzable corpus directly by tools bibliometric.
/ projet_vrml/paca2.htm : This project of the CRRM is the subject of two axes of investigation:
the first developed by Pascal Faucompre makes it possible to establish a link Sciences, Technologies.
Indeed the base, resulting from the base PASCAL (INIST), ©contains primarily scientific references and it appeared interesting to us to bind these references with an aspect technology and patent rights,
the second allows questioning of the base on purely statistical criteria. It was possible to manufacture a representation using virtual reality making it possible to apprehend the analysis with a graphic interface.
Bibliography.
AHO A., HOPCRAFT J. et ULLMAN J. (1987), Structure des donnees et algorithmes, Intereditions.
BOURGNE P (1997), Etat de 1'ulilisation de la notion de reseau en marketing, Actes de I'Association Francaise de Marketing, Bordeaux, 14, 437-456.
BOUTIN E. (1997), Analyse du Log de la technopole de I 'Arhois, Papier de Recherche^, Laboratoire Le Pont, Mars.
BOUTIN E. (1999), Le traitement d'une information massive par I'analyse reseau methode, outils et applications, These de Doctoral en Sciences de 1'information, soutenance prevue janvier.
BOUTIN E. et FERRANDI J.M. (1996), La construction automatique de reseaux sociaux : Etude exploratoire, Actes du Colloque National de Recherche en IUT en Mathematiques, Statistiques, Informatique et leurs applications, Clermont-Ferrand. BOUTIN E., FERRANDI J.M. el VALETTE-FLORENCE P (1996), Les reseaux comme outil d'analyse des chainages cognilifs : une illustration experimental, Papier de recherche, 96-06, public au Cenlre d'Eludes el de Recherches Appliquees a la Geslion (CERAG), Universile Pierre Mendes France, Ecole Superieure des Affaires
BOUTIN E., FERRANDI J.M. el VALETTE-FLORENCH P (1997), [/analyse des chainages cognilifs el la conslruclion aulomalique de reseau comme oulil de veille commerciale, International Journal oj Inlonnaium Suencc /<>/ DCUMOII Making. 0. 19-34.
BOUTIN E., QUONIAM L., ROSTAING H. el DOU H. (1995), A new approach to display real co-aulhorship and co-lopicship ihrough nelwork mapping, Actes du « Fifth International Conference on Scientometrics and Infometrics », Chicago, 7-10 Juin 1995. COSTES Y (1998), La mesure d'audience sur Inlernet, Decisions Marketing, 14, 63-71. DEGENNE A. et FORSE M. (1994), Les reseaux sociaux: une analyse structurale en sociologie, Editions Armand Colin.
in McLoughlin, Damien. and C. Horan (eds.), Proceedings of The 15"' Annual IMP Conference,
IACOBUCCI D. (1996), Networks in Marketing, Sage Publications.
LHEN J., LAFOUGE T., ELSKENS Y., QUONIAM L. et DOU H. (1995), La statistique des lois de Zipf, Actes du Colloque, Les systemes d'informations elabores, He Rousse, ONNEIN-BONNEFOY C. (1997), Les bandeaux publicitaires sur Internet: mesures d'efficacite, Decisions Marketing, 11, 87-92.
REBOUL P. et XARDEL D. (1997), Le commerce electronique, Editions Eyrolles. ROSTAING H. (1993), Veille technologique et bibliometrie concepts outils et applications, These de Doctoral en Sciences de F Information, Universite des Sciences et des Techniques d'Aix- Marseille III.
SCOTT J. (1991), Social Network Analysis, Newbury Park CA, Sage.
STOUT (1997), Web Site Stats Tracking Hits and Analysing Traffic, Osborne McGraw- Hill.
TAGUE ET NICHOLLS (1987), The Maximal Value of a Zipf Size Variable : Sampling Properties and Relationship to Other Parameters, Information Processing and Management, 23, 3, 155-170.
WASSERMAN S. et FAUST K. (1994), Social Network Analysis, Cambridge, Cambridge University Press.
ZIPF G.K. (1949), Hitman Behavior and the Principles of Least Effort, Addison Wesley.
I'M McLoughlin, Damien. and C. Horan (eds.), Proceedings oj The 15"' Annual IMP Conference, University College, Dublin 1999