HAL Id: dumas-01387576
https://dumas.ccsd.cnrs.fr/dumas-01387576
Submitted on 25 Oct 2016
HAL is a multi-disciplinary open access
archive for the deposit and dissemination of sci-entific research documents, whether they are pub-lished or not. The documents may come from teaching and research institutions in France or abroad, or from public or private research centers.
L’archive ouverte pluridisciplinaire HAL, est destinée au dépôt et à la diffusion de documents scientifiques de niveau recherche, publiés ou non, émanant des établissements d’enseignement et de recherche français ou étrangers, des laboratoires publics ou privés.
Association between texture analysis parameters and
biomarkers (EGFR, KRAS, ALK) in pulmonary
adenocarcinoma
Tristan Schwab
To cite this version:
Tristan Schwab. Association between texture analysis parameters and biomarkers (EGFR, KRAS, ALK) in pulmonary adenocarcinoma. Human health and pathology. 2016. �dumas-01387576�
AVERTISSEMENT
Ce document est le fruit d'un long travail approuvé par le
jury de soutenance et mis à disposition de l'ensemble de la
communauté universitaire élargie.
Il n’a pas été réévalué depuis la date de soutenance.
Il est soumis à la propriété intellectuelle de l'auteur. Ceci
implique une obligation de citation et de référencement
lors de l’utilisation de ce document.
D’autre part, toute contrefaçon, plagiat, reproduction illicite
encourt une poursuite pénale.
Contact au SID de Grenoble :
[email protected]
LIENS
LIENS
Code de la Propriété Intellectuelle. articles L 122. 4
Code de la Propriété Intellectuelle. articles L 335.2- L 335.10
http://www.cfcopies.com/juridique/droit-auteurUNIVERSITE GRENOBLE ALPES FACULTE DE MEDECINE DE GRENOBLE
Année 2016 N°
ASSOCIATION ENTRE HETEROGENEITE TUMORALE MESUREE EN SCANNER ET BIOMARQUEURS (KRAS, EGFR, ALK) DANS LES ADENOCARCINOMES
PULMONAIRES
THESE
PRESENTEE POUR L’OBTENTION DU DOCTORAT EN MEDECINE DIPLÔME D’ETAT
SOUTENUE PUBLIQUEMENT A LA FACULTE DE MEDECINE DE GRENOBLE*
le 21 octobre 2016
par SCHWAB Tristan,
DEVANT LE JURY COMPOSE DE Président du jury :
M. le Professeur FERRETTI Gilbert Raymond, PU-PH Membres :
Mme. Le Professeur LANTUEJOUL Sylvie, PU-PH Mme. le Docteur MC LEER Anne, MCU-PH
M. le Professeur MOREAU-SIBILOT Denis, PU-PH
*La Facultéde Médecine de Grenoble n’entend donner aucune approbation ni improbation aux opinions émises dans les thèses ; ces opinions sont considérées comme propres àleurs auteurs.
REMERCIMENTS
Monsieur le Professeur Gilbert FERRETTI, vous m’avez fait l’honneur d’avoir accepté de présider cette thèse et de m’avoir fait confiance. Veuillez trouver ici l’expression de ma sincère gratitude.
Mme le Docteur MC LEER Anne, vous m’avez fait l’honneur d’avoir acceptéde juger cette thèse et votre aide a été précieuse, j’aimerais vous exprimer mes plus sincères remerciements.
Mme. le Professeur LANTUEJOUL Sylvie, M. le Professeur MOREAU-SIBILOT Denis, vous m’avez fait l’honneur d’avoir acceptéde juger cette thèse. Veuillez trouver ici l’expression de mon profond respect.
A ceux qui m’ont aidédans ce travail, Julien COHEN ton concours fut considérable, tout comme est déjàta science. Maud MEDICI pour votre travail indispensable.
A ma famille, àma sainte mère Marguerite, àmon bien-aimé père Pierre, vous m’avez toujours fait confiance, je ne serai jamais capable de vous dire toute mon affection.
A Héloïse, ma sœurette chérie, quelle merveille de neveux tu m’as fait! Merci àlui pour la joie qu’il nous apporte et àson père François.
A Gaëtan mon talentueux et adoréfrère, tu pourras toujours compter sur moi. A Frédéric, ta curiositéest une richesse qui m’a toujours inspiré.
A Elise, modèle de sobriété que l’humanité devrait suivre. A Odette, ma grand-mère, pour son amour infaillible. A Georges, Madeleine et André, que je n’oublie pas.
A mes fidèles amis niçois.
A mes amis grenoblois, qui se reconnaitront.
TABLE DES MATIERES RESUME………..……….…8 ARTICLE………..………9 Introduction………..9 Méthode………..………10 Résultat.………..…………..………..13 Discussion……….……..14 Conclusion………..16 Bibliographie………..………..……..17 Annexes……….………..21 CONCLUSION………30 SERMENT D’HIPPOCRATE………31
ABSTRACT
Purpose: To determine if texture parameters derived from unenhanced computed tomography
(CT) images of primary lung adenocarcinomas were related to mutational characteristics of these tumors.
Methods: One hundred and thirty-two consecutive patients who underwent transthoracic lung
core biopsy showing primary lung adenocarcinoma were included in this monocentric retrospective study. EGFR mutations, KRAS mutations and ALK rearrangements were systematically tested. Tumor texture analysis was performed on non-enhanced CT.
Heterogeneity analysis relative to pixel distribution was performed using six parameters: mean attenuation (average brightness), standard-deviation (variation from the mean i.e. width of the histogram), entropy (global irregularity), skewness (asymmetry of the curve) and kurtosis (peakedness of the curve). Pixel distribution histograms were derived using 6 spatial scale filter (SSF) values: i.e., without-filtration (SSF 0), using fine (SSF 2); medium-coarse (SSF 3, 4); and coarse (SSF 5, 6) texture scales. Correlations between texture parameters and EGFR, KRAS, and
ALK mutational status were studied. Statistical analysis comprised univariate and multivariate
analyses.
Results: 40/132 (30%) patients showed KRAS mutations, 9/132 (6.8%) EGFR mutations, and
5/132 (3.8%) ALK rearrangements. Significant parameters for each mutation were: for KRAS mutations, mean attenuation using medium-coarse texture (SSF 4) (AUC=0.64, Sensitivity (Se),82%); for EGFR mutations, MPP with medium texture (SSF3) (AUC=0.71, Se=81%); for
ALK rearrangements, standard deviation using fine textures (AUC=0.84, se=100%).
Conclusion: CT texture parameters obtained from unenhanced CT are significantly associated
with primary lung adenocarcinoma mutations.
Abbreviations:
NSCLC, Non Small Cell Lung Carcinoma; ADC: Adenocarcinoma; EGFR, Epidermal Growth Factor Receptor; ALK, Anaplastic Lymphoma Kinase; KRAS, Kirsten Rat Sarcoma; TTNB,
Transthoracic core Needle Biopsy; CTTA, Computerized Tomography Texture Analysis; SD,
Standard Deviation; FISH, Fluorescent In Situ Hybridization; PLS-DA, Partial Least Squares - Discriminant Analysis; AUC Area Under the Curve;
1. Introduction
Lung cancer is the first cause of cancer death worldwide with 1.8 million people diagnosed every year and 1.6 million deaths in 2012 [1]. Its prognosis remains poor, as approximately 75% of non-small-cell lung cancer (NSCLC) patients have unresectable disease at the time of diagnosis. Radiation and chemotherapy with cytotoxic agents are the conventional treatment for primary lung cancers. However, better understanding of oncogenic mutations in pulmonary
adenocarcinomas (ADC) recently enabled to improve prognosis for higher stage tumors by proposing mutation-specific targeted therapies, such as erlotinib, gefitinib for EGFR mutations and crizotinib for ALK rearrangements [2] [3] [4] [5] [6]. For the time being, determination of these molecular subtypes mostly depends on invasive procedures, including CT-guided transthoracic core needle biopsy (TTNB) [7], which reduces morbi-mortality compared to a surgical approach. However, a better understanding of the relationship between radiological features and tumor genomic alterations could play an important role in patients’ management. Radiogenomic is a recent trend to non-invasively characterize adenocarcinomas molecular subtypes using CT morphological criteria. Recently, Rizzo et al [8] showed that EGFR mutations were significantly linked to air bronchogram, pleural retraction, small lesion size and absence of fibrosis, while KRAS mutated adenocarcinomas were associated with round lesion shape and nodules in non-tumor lobes. Yamamoto et al [9] found an association between ALK
rearrangements and central tumor location, absence of pleural tail, and large pleural effusion while Rizzo et al reported pleural effusion and younger age. However, morphological characterization has limitations [8].
CT texture analysis (CTTA), which is evaluated by assessing the distribution and relationship of pixel or gray levels in the CT image [10], is a known feature of malignancy in tumors, and represents regional changes in cell density, necrosis, and hemorrhage [11]. CTTA has been correlated with KRAS mutation status in colorectal cancer [12] and more recently Weiss et al [13] found a statistical correlation between KRAS mutations in lung ADC and CTTA parameters. Since mutations or rearrangements of genes expressed by tumors are correlated with response to therapy and overall survival, CTTA may serve as a molecular surrogate that could contribute to the diagnosis, prognosis, and gene-expression-associated treatment response of various forms of human cancer [14].
Few studies investigating the role of CT texture analysis in lung ADC have been published so far. The purpose of this study was to determine if CT texture parameters of primary lung adenocarcinomas are associated with mutational characteristics of theses tumors assessed on TTNB.
2. Methods:
2.1.Ethics statement
This single institution study comprised a retrospective evaluation of image data from patients undergoing CT guided trans-thoracic core-needle lung biopsy between January 2009 and September 2014. Study ethics approval was obtained (CECIC Rhône-Alpes-Auvergne, Clermont-Ferrand, IRB 5891). Given the retrospective nature of the analysis, the institutional review board waived patients’ written consent. Anonymity was ensured for all patient data.
2.2.Patient population
All patients included in this study had undergone a TTNB under CT guidance without any contrast media opacification. The targeted nodule or mass was either a peripheral pulmonary lesion suspected of lung cancer or a known primary adenocarcinoma without knowledge of the mutational status. We included patients with primary lung adenocarcinoma at pathological examination and molecular analysis of the biopsy specimen for EGFR, KRAS, and ALK mutations/rearrangements. We excluded patients with negative biopsy, biopsy showing other diagnosis than adenocarcinoma, biopsy containing fewer than 20% malignant cells. Additional data were collected through medical charts for all patients. Regarding smoking history, a non-smoker was defined as a never-non-smoker with no significant secondhand exposure or a non-smoker of less than five pack-years with no documented cigarette smoking for at least 20 years.
2.3.Biopsy procedure
Decision of TTNB was taken following a multidisciplinary discussion. Prior to each procedure, the risks and benefits of TTNB were discussed, and signed informed consent was obtained from each patient. For all patients, the TTNB was performed under CT scan guidance (Brillance 64, Philips Medical Systems, Eindhoven, The Netherlands). At the time of biopsy, selected images were obtained in the area of interest with 2 mm-thick contiguous non enhanced CT sections, 120 KVp and intensity varied between 150 and 200 mAs. Patient position was chosen according to the location of the target in the thorax so as to ensure the easiest access route to the lesion and avoid damageable structures. We used a coaxial biopsy system consisting of a 17-gauge outer needle (Angiotech co-axial introducer needle; Medical Device Technolo-gies Inc., Gainesville, FL, USA) and an 18-gauge core biopsy needle (Angiotech BioPinceTMfull core biopsy
instrument) which allows 13-mm or 23-mm or 33-mm long core tissue biopsies. Once the biopsy was completed, a whole thoracic CT was performed to check for acute complications such as pneumothorax or bleeding. A chest radiograph was performed 3 hours after the procedure. Clinical follow up was ensured by pneumologists for the rest of the day.
2.4.Pathological evaluation
Hematoxylin–Eosin–Saffron (HES) sections of formalin-fixed and paraffin-embedded TTNBs were analyzed histologically and classified according to the IASLC/ATS/ERS adenocarcinoma classification [15]. The lengths of the biopsies as well as the average percentage of tumor cells present on the slides were recorded. Mucin stains (Diastase PAS and Kreyberg) were only performed when a solid pattern was observed.
Immunohistochemistry with a TTF1 antibody was performed either when the primary or secondary nature of the tumor was unknown, or in combination with P63 and/or CK5-6 immunostainings in solid pattern NSCLC.
FISH was performed as previously described [16].Tumor tissue was considered ALK FISH positive (ALK rearranged) if >15% tumor cells showed split orange and green signals and/or single orange (3’) signals.
EGFR (exons 18–21) and KRAS (exon 2) mutations were determined as previously described
[17] [18]. DNA quantification was determined with a NanoDrop 2000c spectrophotometer (ThermoScientific). One hundred nanograms of DNA were amplified in duplicate for each exon and then pyrosequenced on a PyroMark IDsystem (Qiagen).
2.5.CT Texture analysis (CTTA)
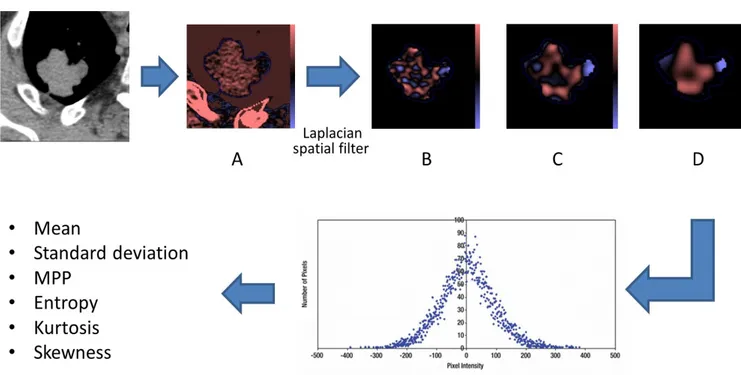
Images were processed using TexRAD software (TexRAD Ltd www.texrad.com, part of Feedback Plc, Cambridge, UK) software, [10] [19] [20]. Voxels values between -50HU and + 200 HU were automatically excluded in order to eliminate air or calcifications that could bias the analysis, similarly to previous studies [21]. For each nodule or mass, a radiologist with at least 4 years of experience manually delineated tumor borders on 3 representative slices taken at the upper, middle and lower thirds of the tumor in mediastinal window. Quantitative texture analysis consisted in an image filtration-histogram technique. Initial image filtration used a Laplacian of Gaussian spatial bandpass filter. By varying the “spatial scale filter” (SSF) values between 0 and 6, features or objects of different anatomical sizes and intensity variation were enhanced and extracted corresponding to fine-texture (SSF=2), medium-texture (SSF=3-5) and coarse-texture
(SSF=6) texture scales (Figure 1). Parameters were also quantified from the CT image without filtration (SSF0). A quantification of the filtered texture maps using histogram parameters was then obtained for each of the 3 slices: mean attenuation (quantification of the average
brightness), standard-deviation (quantification of the variation from the mean i.e. width of the histogram), entropy (quantification of the global irregularity), skewness (quantification of the asymmetry of the curve) and kurtosis (quantification of the peakedness of the curve). The median of the 3 regions of interest was calculated and used for the statistical analysis. These parameters reflect to varying degrees the number, intensity and variability of areas of high and low X-ray attenuation within the whole tumor [19].
Finally, 36 figures were obtained per case. In 15 cases, CTTAs were independently obtained by 2 radiologists in order to evaluate the interobserver reproducibility.
2.6.Statistical analysis:
For KRAS mutations, the normality of quantitative variables was tested with the Shapiro-Wilks test. If the variable was normally distributed, it was described by its mean and standard deviation and comparison between mutated and non-mutated biomarkers groups was performed using a Student test. Otherwise, and for EGFR mutations and ALK rearrangements, the variable was described by its median, first and third quartile and comparison between mutated and non-mutated biomarkers groups was performed using the Mann - Whitney – Wilcoxon test.
Qualitative variables were expressed as number and percentage and compared with Chi2 test or Fisher exact test if the numerical size was insufficient. A PLS-DA (Partial Least Square - Discriminant Analysis) was implemented on significant parameters in univariate at the 10% threshold. The ROC curves were plotted for the parameters selected by the VIP (Variable Importance in the Projection) of PLS-DA. A decision tree was performed in order to detect mutated biomarkers using the most discriminating parameters.
Inter-observer reproducibility was assessed using the intraclass coefficient (ICC). Interpretation of ICC was as follows: excellent, 0.81–1.0; good, 0.61–0.80; fair, 0.41–0.60; poor, 0.21–0.40, and none, 0–0.20. Statistical tests were conducted at an alpha significance level of 5%. Statistical analyzes were performed using the R software (version 3.1.0).
3. Results:
3.1.Population:
Between January 2009 and September 2014, 386 transthoracic biopsies under CT were
performed in our center. One hundred and thirty-two patients met the inclusion criteria (Figure 2). Fifty-five (55%) were classified into stage higher than IIIA. The study group was composed of a majority of men (91/132, 69%) (Table 1); the mean age of women was significantly lower (63.2 years ± 12.1) than that of men (67.6 years ±9.4, p = 0.04). A hundred and five out of 132 patients (80%) were smokers or had a history of smoking with an average consumption of 42 pack-years (5-150 PY). There was a significant difference between the average smoking consumption of women (20 PY [0; 30]) and men (40 PY [25; 50], p <0.001) and between the number of women with a mutated tumor (4.5 PY [0; 29.8]) and the number of men with a mutated tumor (37.5 PY [30; 50], p <0.01).
Fifty-four tumors out of 132 (41%) were mutated. No tumor carried a double mutation. Fifteen out of 27 (55%) patients with no smoking history showed a mutation, vs. 39 out of 105 (37%) in patients with a smoking history (p=0.13). Forty out of 132 (30%) patients had a KRAS mutation (Table 2); 92.5 % of those KRAS mutated patients had a smoking history. Nine out of 132 (6.8%) patients had an EGFR mutation. This group was mainly composed of women (p=0.03), with a substantially smaller proportion of smokers (11%, p<0.001) and more advanced stages of the disease (89% > IIIa, p=0.07). Five patients out of 132 (3.8%) had an ALK rearrangement and differentiated themselves by the small proportion of smokers (20%, p<0.01).
3.2.Tumor heterogeneity criteria
The inter-observer reproducibility (Table 3) was good for the variable skewness, excellent for the other variables except for kurtosis which was poor (ICC=0.59 [0.19; 0.79]).
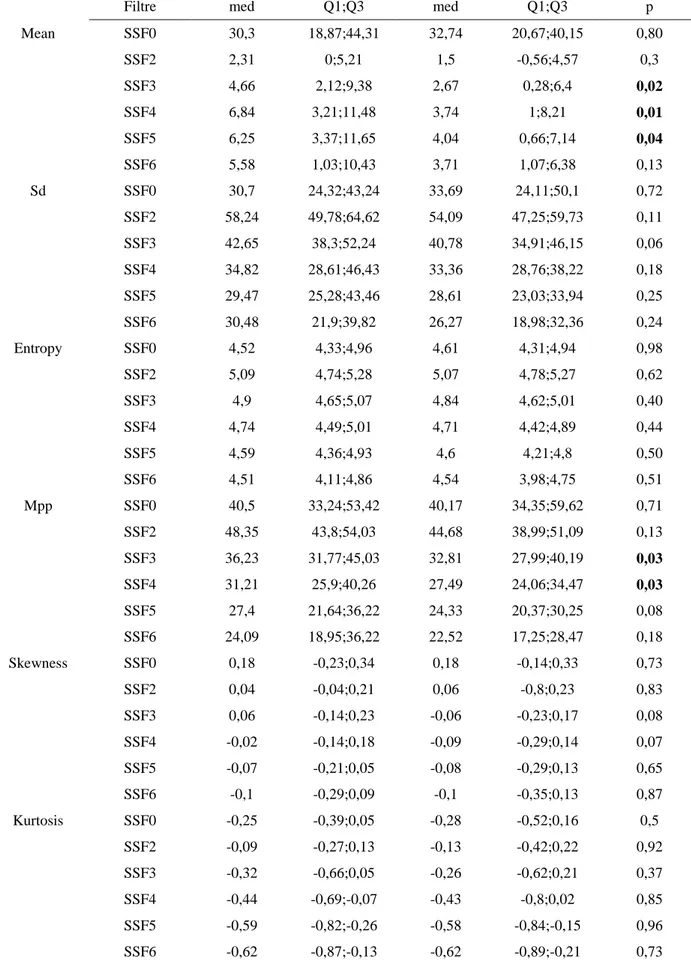
In the absence of filtration, no significant match was obtained. The use of medium-coarse textures (SSF 3) gave the largest number of significant results. Entropy was never a significant variable (p>0.1 for all mutations and filter values on the univariate analysis).
For KRAS mutations (Table 4), univariate analysis showed that the variables mean and MPP were significant for medium-coarse and coarse textures (SSF3, 4 and 5). For medium texture, Sd and skewness were significant as well as skewness for coarse texture. The PLS-DA and the ROC curve showed that mean intensity using medium coarse-textures (SSF4) with a threshold of 2.53 was the most discriminative variable in order to differentiate the mutated biomarkers (AUC=0.64
[0.53;0.74], se=82%,sp=42%) and tobacco with a threshold of 22.5 PA (AUC=0.65[0.56;0.75], se=85%, sp=47%).
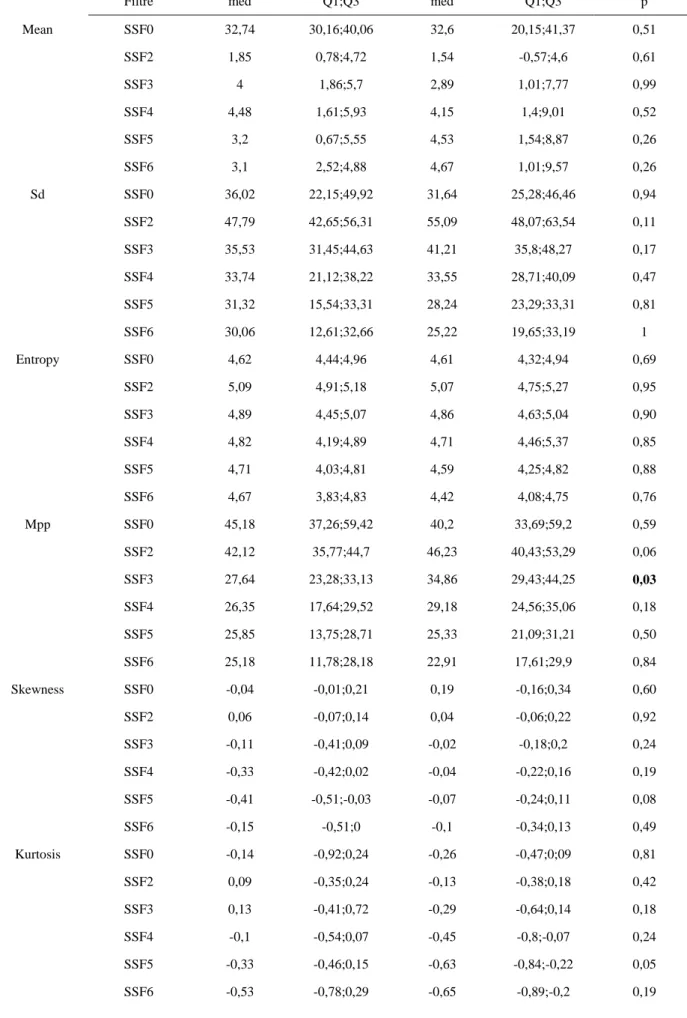
Regarding EGFR mutations (Table 5), univariate analysis showed that kurtosis and skewness using coarse textures (SSF 5), MPP using fine and medium-coarse textures (SSF 2 and 3) and tobacco were significant. The most discriminative parameter according to the ROC analysis was tobacco with a threshold of 12.5 PA (AUC=0.91 [0.87; 0.95], se=1, sp=0.8) and MPP for
medium texture (AUC=0.71 [0.54; 0.88], se=0.81, sp=0.56).
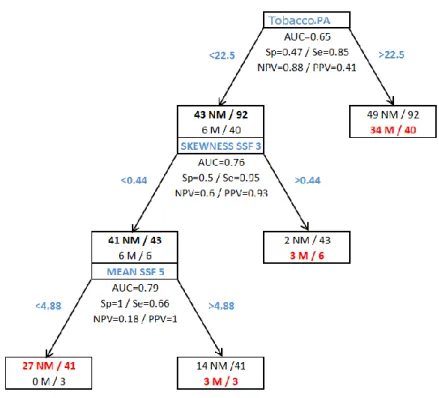
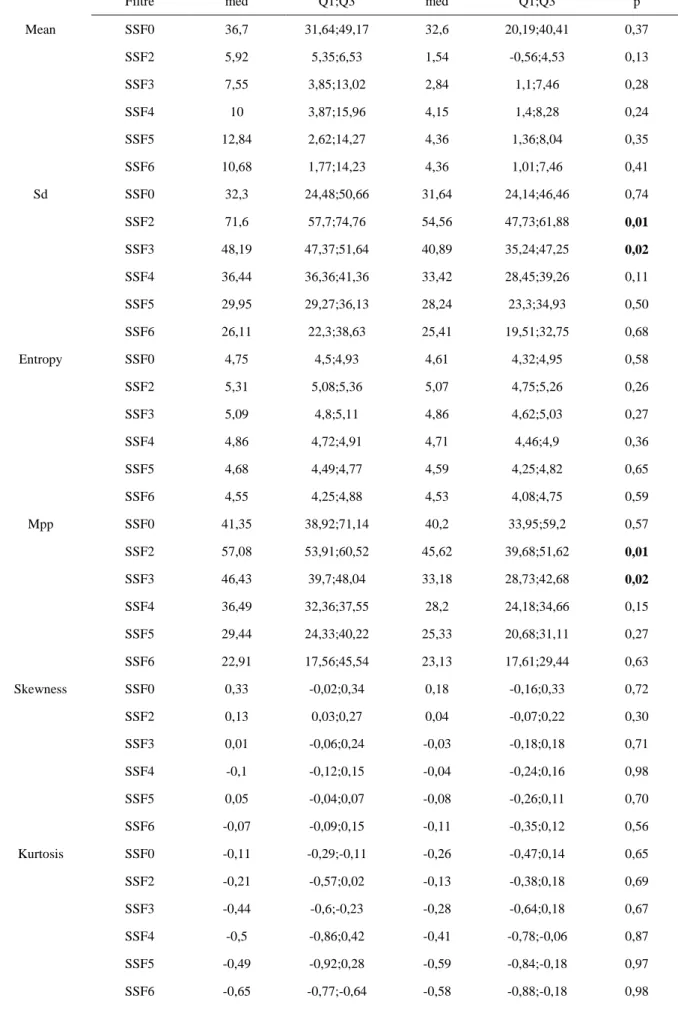
For ALK rearrangements (Table 6), SD and MPP using fine and medium-coarse textures (SSF 2 and 3) and tobacco were significant differentiators on univariate analysis (p<0.1). The most discriminative parameter according to the ROC analysis was SD using fine textures (SSF2) and tobacco. For SD the AUC was 0.84 [0.67; 1] (Fig. 5) with a threshold of 57.07 (se=100%, sp=63%) and for tobacco with a threshold of 12.5 PA (AUC=0.88[0.52; 0.95], se=0.78; sp=1). By using the decision trees which combines heterogeneity parameters and tobacco, sensitivity and then negative predictive value were 100 % at the expense of specificity (Figure 3).
4. Discussion
The presence of areas of tissue remolding within a tumor, including necrosis, hemorrhage, and myxoid change is a known feature of malignancy and is responsible for tumor heterogeneity [10]. CT texture analysis has been introduced recently as a noninvasive method to quantify such heterogeneity. In patients with NSCLC, CT heterogeneity has shown some degrees of
association with tumor glucose metabolism and oncologic stage [20], higher potential than PET scan in predicting survival [21], potential to detect hypoxia and angiogenesis [22]. As
personalized medicine shows rapid growth, we performed this study in order to define if texture parameters derived from non-enhanced CT images of primary lung adenocarcinomas relate to mutational characteristic of these tumors. This may have potential applications in non-invasive determination of the mutational status of lung adenocarcinomas.
The results of our study show a statistically significant relationship between tumor heterogeneity measured on unenhanced CTs and the presence of KRAS mutations, EGFR mutations or ALK rearrangements. By including demographic criteria in the decision tree, we obtained a sensitivity of 100 % for each biomarker and could thus exclude their presence in the biopsied tumors. Regarding the distribution of biomarkers in our population of lung adenocarcinomas, our results are comparable to published data [5] and in particular are consistent with the results of the
largest available database of biomarkers in non-small cell lung cancers [23]. As in the study of Barlesi et al [23], our study shows that non-smokers more frequently presented with mutated tumors (15/27, 55%) than smokers (39/105, 37%). Unlike this previously published French cohort [23], our tissue samples were all obtained from trans-thoracic biopsies performed in either operable patients in order to get a preoperative diagnosis or predominantly in inoperable stage IIIb or IV patients. It was important to include this population with advanced stages of lung cancer because it is for them that the targeted therapies can be indicated.
Our results concerning KRAS mutations were different from that of a previous study by Weiss et al. [13]. Indeed, in their cohort of 48 early stage NSLSCs, the authors concluded that kurtosis was the most significant criteria in identifying KRAS mutations by using CTTA. In our study, kurtosis was not statistically significant (p>0.05), and that for all values of SSF tested. On the other hand, similarly as Weiss et al, we found values of skewness more significant in tumors harboring a KRAS mutation. This difference could be due to the differences in the inclusion criteria between our two studies. Indeed, Weiss et al [13] included patients with lung adenocarcinoma (n = 33) and squamous cell carcinoma (n = 10), whereas we only included adenocarcinomas and Weiss et al. excluded stages III and IV lung cancers, which we kept for our analyses.
As already pointed out by others, several limits can be found to the use of CT texture parameters for the detection of biomarkers in pulmonary adenocarcinomas. First, in theory, tumoral
heterogeneity on pathology represents a significant risk of false negative, especially for partial samples such as TTNB with 18G needle. However, Mansuet-Lupo et al. [24] showed that
differences in the mutational status between core-needle biopsy specimen and full resection were exceptionally rare (5/149 false negative for EGFR). As confirmed by Pusztaszeri et al [25], as long as the rate of tumor cells on the sample is higher than 50%, the high sensitivity of detection technique makes this kind of sample reliable and useable in everyday practice.
In the present study, a few patients underwent chemotherapy at the time of the biopsy, either for the targeted cancer itself in the case of a biopsy for non-response to conventional scheme of chemotherapy, or for another primitive. The modifications induced by these treatments on tumor architecture are also a potential bias to consider.
Another limit is the fact that in our study EGFR mutations were considered as present or absent, when in fact among the positive cases, multiple subtypes exist [26]. As these mutations can affect different codons and exons, this could partially explain while establishing a link with
A recent work [27] decrypted the genome, proteome and transcriptome of 230 pulmonary adenocarcinomas. By integrating genetic, histopathologic and clinical data, authors of this study were able to differentiate 3 distinct transcriptional subtypes. Such types of approach combined with imaging data contribute to the current growth of radiogenomics [14], for which tumor heterogeneity parameters may clearly play an important role in the future.
5. In summary:
Our study shows that CT texture parameters determined from unenhanced CT scans acquired immediately prior to trans thoracic lung core biopsy are significantly associated with primary lung adenocarcinoma mutations. Regarding the small population in this study, larger prospective multicenter trials are needed.
REFERENCES
[1] T.-Y.D. Cheng, S.M. Cramb, P.D. Baade, D.R. Youlden, C. Nwogu, M.E. Reid, The International Epidemiology of Lung Cancer: Latest Trends, Disparities, and Tumor Characteristics, J. Thorac. Oncol. Off. Publ. Int. Assoc. Study Lung Cancer. (2016). doi:10.1016/j.jtho.2016.05.021.
[2] J.G. Paez, P.A. Jänne, J.C. Lee, S. Tracy, H. Greulich, S. Gabriel, P. Herman, F.J. Kaye, N. Lindeman, T.J. Boggon, K. Naoki, H. Sasaki, Y. Fujii, M.J. Eck, W.R. Sellers, B.E.
Johnson, M. Meyerson, EGFR mutations in lung cancer: correlation with clinical response to gefitinib therapy, Science. 304 (2004) 1497–1500. doi:10.1126/science.1099314. [3] W. Pao, V. Miller, M. Zakowski, J. Doherty, K. Politi, I. Sarkaria, B. Singh, R. Heelan, V.
Rusch, L. Fulton, E. Mardis, D. Kupfer, R. Wilson, M. Kris, H. Varmus, EGF receptor gene mutations are common in lung cancers from “never smokers” and are associated with sensitivity of tumors to gefitinib and erlotinib, Proc. Natl. Acad. Sci. U. S. A. 101 (2004) 13306–13311. doi:10.1073/pnas.0405220101.
[4] T.J. Lynch, D.W. Bell, R. Sordella, S. Gurubhagavatula, R.A. Okimoto, B.W. Brannigan, P.L. Harris, S.M. Haserlat, J.G. Supko, F.G. Haluska, D.N. Louis, D.C. Christiani, J. Settleman, D.A. Haber, Activating mutations in the epidermal growth factor receptor underlying responsiveness of non-small-cell lung cancer to gefitinib, N. Engl. J. Med. 350 (2004) 2129–2139. doi:10.1056/NEJMoa040938.
[5] S.Y. Luo, D.C. Lam, Oncogenic driver mutations in lung cancer, Transl. Respir. Med. 1 (2013) 6. doi:10.1186/2213-0802-1-6.
[6] N.I. Lindeman, P.T. Cagle, M.B. Beasley, D.A. Chitale, S. Dacic, G. Giaccone, R.B. Jenkins, D.J. Kwiatkowski, J.-S. Saldivar, J. Squire, E. Thunnissen, M. Ladanyi, null College of American Pathologists International Association for the Study of Lung Cancer and Association for Molecular Pathology, Molecular testing guideline for selection of lung cancer patients for EGFR and ALK tyrosine kinase inhibitors: guideline from the College of American Pathologists, International Association for the Study of Lung Cancer, and Association for Molecular Pathology, J. Mol. Diagn. JMD. 15 (2013) 415–453.
doi:10.1016/j.jmoldx.2013.03.001.
[7] G.R. Ferretti, B. Busser, F. de Fraipont, E. Reymond, A. McLeer-Florin, L. Mescam-Mancini, D. Moro-Sibilot, E. Brambilla, S. Lantuejoul, Adequacy of CT-guided biopsies with histomolecular subtyping of pulmonary adenocarcinomas: influence of
ATS/ERS/IASLC guidelines, Lung Cancer Amst. Neth. 82 (2013) 69–75. doi:10.1016/j.lungcan.2013.07.010.
[8] S. Rizzo, F. Petrella, V. Buscarino, F. De Maria, S. Raimondi, M. Barberis, C. Fumagalli, G. Spitaleri, C. Rampinelli, F. De Marinis, L. Spaggiari, M. Bellomi, CT Radiogenomic Characterization of EGFR, K-RAS, and ALK Mutations in Non-Small Cell Lung Cancer, Eur. Radiol. 26 (2016) 32–42. doi:10.1007/s00330-015-3814-0.
[9] S. Yamamoto, R.L. Korn, R. Oklu, C. Migdal, M.B. Gotway, G.J. Weiss, A.J. Iafrate, D.-W. Kim, M.D. Kuo, ALK molecular phenotype in non-small cell lung cancer: CT
radiogenomic characterization, Radiology. 272 (2014) 568–576. doi:10.1148/radiol.14140789.
[10] B. Ganeshan, K.A. Miles, Quantifying tumour heterogeneity with CT, Cancer Imaging Off. Publ. Int. Cancer Imaging Soc. 13 (2013) 140–149. doi:10.1102/1470-7330.2013.0015. [11] F. Ng, R. Kozarski, B. Ganeshan, V. Goh, Assessment of tumor heterogeneity by CT
texture analysis: can the largest cross-sectional area be used as an alternative to whole tumor analysis?, Eur. J. Radiol. 82 (2013) 342–348. doi:10.1016/j.ejrad.2012.10.023. [12] K.A. Miles, B. Ganeshan, M. Rodriguez-Justo, V.J. Goh, Z. Ziauddin, A. Engledow, M.
Meagher, R. Endozo, S.A. Taylor, S. Halligan, P.J. Ell, A.M. Groves, Multifunctional imaging signature for V-KI-RAS2 Kirsten rat sarcoma viral oncogene homolog (KRAS) mutations in colorectal cancer, J. Nucl. Med. Off. Publ. Soc. Nucl. Med. 55 (2014) 386– 391. doi:10.2967/jnumed.113.120485.
[13] G.J. Weiss, B. Ganeshan, K.A. Miles, D.H. Campbell, P.Y. Cheung, S. Frank, R.L. Korn, Noninvasive image texture analysis differentiates K-ras mutation from pan-wildtype
NSCLC and is prognostic, PloS One. 9 (2014) e100244. doi:10.1371/journal.pone.0100244. [14] A.M. Rutman, M.D. Kuo, Radiogenomics: creating a link between molecular diagnostics
and diagnostic imaging, Eur. J. Radiol. 70 (2009) 232–241. doi:10.1016/j.ejrad.2009.01.050.
[15] J. Zugazagoitia, A.B. Enguita, J.A. Nuñez, L. Iglesias, S. Ponce, The new
IASLC/ATS/ERS lung adenocarcinoma classification from a clinical perspective: current concepts and future prospects, J. Thorac. Dis. 6 (2014) S526-536. doi:10.3978/j.issn.2072-1439.2014.01.27.
[16] A. McLeer-Florin, D. Moro-Sibilot, A. Melis, D. Salameire, C. Lefebvre, F. Ceccaldi, F. de Fraipont, E. Brambilla, S. Lantuejoul, Dual IHC and FISH testing for ALK gene
rearrangement in lung adenocarcinomas in a routine practice: a French study, J. Thorac. Oncol. Off. Publ. Int. Assoc. Study Lung Cancer. 7 (2012) 348–354.
[17] S. Dufort, M.-J. Richard, S. Lantuejoul, F. de Fraipont, Pyrosequencing, a method approved to detect the two major EGFR mutations for anti EGFR therapy in NSCLC, J. Exp. Clin. Cancer Res. CR. 30 (2011) 57. doi:10.1186/1756-9966-30-57.
[18] S. Dufort, M.-J. Richard, F. de Fraipont, Pyrosequencing method to detect KRAS mutation in formalin-fixed and paraffin-embedded tumor tissues, Anal. Biochem. 391 (2009) 166– 168. doi:10.1016/j.ab.2009.05.027.
[19] K.A. Miles, B. Ganeshan, M.P. Hayball, CT texture analysis using the filtration-histogram method: what do the measurements mean?, Cancer Imaging Off. Publ. Int. Cancer Imaging Soc. 13 (2013) 400–406. doi:10.1102/1470-7330.2013.9045.
[20] B. Ganeshan, K. Skogen, I. Pressney, D. Coutroubis, K. Miles, Tumour heterogeneity in oesophageal cancer assessed by CT texture analysis: preliminary evidence of an association with tumour metabolism, stage, and survival, Clin. Radiol. 67 (2012) 157–164.
doi:10.1016/j.crad.2011.08.012.
[21] B. Ganeshan, E. Panayiotou, K. Burnand, S. Dizdarevic, K. Miles, Tumour heterogeneity in non-small cell lung carcinoma assessed by CT texture analysis: a potential marker of
survival, Eur. Radiol. 22 (2012) 796–802. doi:10.1007/s00330-011-2319-8.
[22] B. Ganeshan, V. Goh, H.C. Mandeville, Q.S. Ng, P.J. Hoskin, K.A. Miles, Non-small cell lung cancer: histopathologic correlates for texture parameters at CT, Radiology. 266 (2013) 326–336. doi:10.1148/radiol.12112428.
[23] Biomarkers (BM) France: Results of routine EGFR, HER2, KRAS, BRAF, PI3KCA mutations detection and EML4-ALK gene fusion assessment on the first 10,000 non-small cell lung cancer (NSCLC) patients (pts)., J. Clin. Oncol. (n.d.).
http://meetinglibrary.asco.org/content/114562-132 (accessed August 30, 2016). [24] A. Mansuet-Lupo, F. Zouiti, M. Alifano, A. Tallet, M.-C. Charpentier, V. Ducruit, F.
Devez, F. Lemaitre, P. Laurent-Puig, D. Damotte, H. Blons, Intratumoral distribution of EGFR mutations and copy number in metastatic lung cancer, what impact on the initial molecular diagnosis?, J. Transl. Med. 12 (2014) 131. doi:10.1186/1479-5876-12-131. [25] M. Pusztaszeri, J.-C. Pache, N. Mach, P.M.A. Gasche-Soccal, T.A. Mckee, Thérapies
ciblées du cancer pulmonaire: tests moléculaires à partir d’échantillons cytologiques, Rev. Médicale Suisse. 7 (2011) 1486–90.
[26] A.F. Gazdar, Activating and resistance mutations of EGFR in non-small-cell lung cancer: role in clinical response to EGFR tyrosine kinase inhibitors, Oncogene. 28 Suppl 1 (2009) S24-31. doi:10.1038/onc.2009.198.
[27] Cancer Genome Atlas Research Network, Comprehensive molecular profiling of lung adenocarcinoma, Nature. 511 (2014) 543–550. doi:10.1038/nature13385.
APPENDIX
Figures:
Figure 1: Effect of different filtration settings.
After manual delineation of nodule margins, software rendered maps of highlighted features for the desired values of SSF (A. without filtration, B. fine-texture SSF 2, C. medium-texture SSF 4, D. coarse-texture SSF6), before outputting numerical values for each parameter and each value of SSF. Red and blue areas correspond respectively to "positively" and" negatively" filtered zones (if an area is brighter or darker than its surroundings, it will get positively or negatively filtered, respectively).
Figure 2: Patient flow chart
Figure 3: Decision trees: By using the decision trees, sensitivity and then negative predictive
value were of 100 % but with a specificity of 29.35 % for KRAS (A), 87.8% for EGFR (B) and 71.4% for ALK (C).
B. EGFR
Tables:
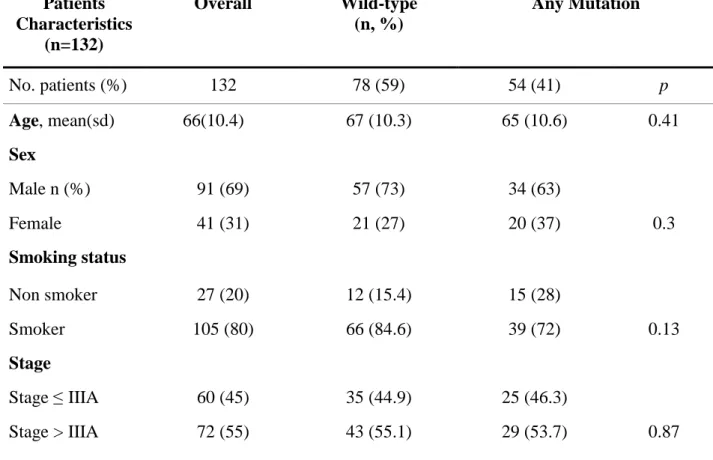
Table 1: Basic characteristics of all patients with pulmonary adenocarcinoma
Patients Characteristics (n=132) Overall Wild-type (n, %) Any Mutation No. patients (%) 132 78 (59) 54 (41) p Age, mean(sd) 66(10.4) 67 (10.3) 65 (10.6) 0.41 Sex Male n (%) 91 (69) 57 (73) 34 (63) Female 41 (31) 21 (27) 20 (37) 0.3 Smoking status Non smoker 27 (20) 12 (15.4) 15 (28) Smoker 105 (80) 66 (84.6) 39 (72) 0.13 Stage Stage ≤ IIIA 60 (45) 35 (44.9) 25 (46.3) Stage > IIIA 72 (55) 43 (55.1) 29 (53.7) 0.87
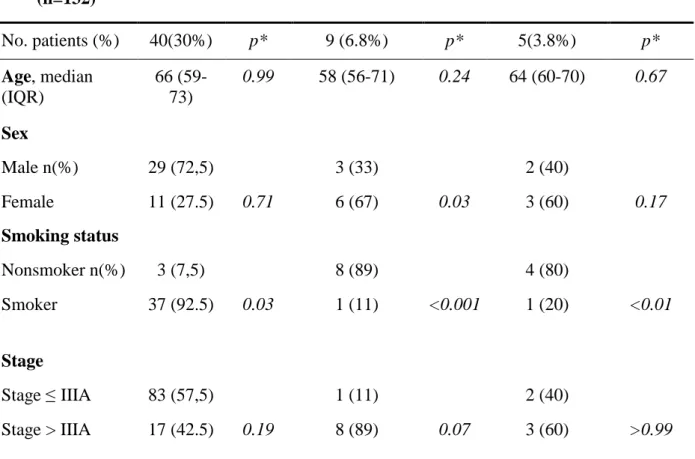
Table 2: Basic characteristics and mutation status for KRAS, EGFR, and ALK of all patients with pulmonary adenocarcinoma
Patients Characteristics
(n=132)
KRAS mutation EGFR mutation ALK mutation
No. patients (%) 40(30%) p* 9 (6.8%) p* 5(3.8%) p* Age, median (IQR) 66 (59-73) 0.99 58 (56-71) 0.24 64 (60-70) 0.67 Sex Male n(%) 29 (72,5) 3 (33) 2 (40) Female 11 (27.5) 0.71 6 (67) 0.03 3 (60) 0.17 Smoking status Nonsmoker n(%) 3 (7,5) 8 (89) 4 (80) Smoker 37 (92.5) 0.03 1 (11) <0.001 1 (20) <0.01 Stage Stage ≤ IIIA 83 (57,5) 1 (11) 2 (40) Stage > IIIA 17 (42.5) 0.19 8 (89) 0.07 3 (60) >0.99
* P value was based on a comparison between wild type as a control group IQR, interquartile range (i.e., 25th and 75th percentiles)
Table 3: Inter-observer reproducibility concerning 15 patients (2 observers)
Variables Intraclass coefficient [95% CI] n=15
Mean 0.89 [0.79 ; 0.94] Sd 0.93 [0.89 ; 0.96] Entropy 0.96 [0.93 ; 0.98] Mpp 0.92 [0.86 ; 0.96] Skewness 0.74 [0.58 ; 0.84] Kurtosis 0.59 [0.19 ; 0.79]
Table 4: Median values of heterogeneity characteristics for KRAS mutation
KRAS without KRAS
Filtre med Q1;Q3 med Q1;Q3 p
Mean SSF0 30,3 18,87;44,31 32,74 20,67;40,15 0,80 SSF2 2,31 0;5,21 1,5 -0,56;4,57 0,3 SSF3 4,66 2,12;9,38 2,67 0,28;6,4 0,02 SSF4 6,84 3,21;11,48 3,74 1;8,21 0,01 SSF5 6,25 3,37;11,65 4,04 0,66;7,14 0,04 SSF6 5,58 1,03;10,43 3,71 1,07;6,38 0,13 Sd SSF0 30,7 24,32;43,24 33,69 24,11;50,1 0,72 SSF2 58,24 49,78;64,62 54,09 47,25;59,73 0,11 SSF3 42,65 38,3;52,24 40,78 34,91;46,15 0,06 SSF4 34,82 28,61;46,43 33,36 28,76;38,22 0,18 SSF5 29,47 25,28;43,46 28,61 23,03;33,94 0,25 SSF6 30,48 21,9;39,82 26,27 18,98;32,36 0,24 Entropy SSF0 4,52 4,33;4,96 4,61 4,31;4,94 0,98 SSF2 5,09 4,74;5,28 5,07 4,78;5,27 0,62 SSF3 4,9 4,65;5,07 4,84 4,62;5,01 0,40 SSF4 4,74 4,49;5,01 4,71 4,42;4,89 0,44 SSF5 4,59 4,36;4,93 4,6 4,21;4,8 0,50 SSF6 4,51 4,11;4,86 4,54 3,98;4,75 0,51 Mpp SSF0 40,5 33,24;53,42 40,17 34,35;59,62 0,71 SSF2 48,35 43,8;54,03 44,68 38,99;51,09 0,13 SSF3 36,23 31,77;45,03 32,81 27,99;40,19 0,03 SSF4 31,21 25,9;40,26 27,49 24,06;34,47 0,03 SSF5 27,4 21,64;36,22 24,33 20,37;30,25 0,08 SSF6 24,09 18,95;36,22 22,52 17,25;28,47 0,18 Skewness SSF0 0,18 -0,23;0,34 0,18 -0,14;0,33 0,73 SSF2 0,04 -0,04;0,21 0,06 -0,8;0,23 0,83 SSF3 0,06 -0,14;0,23 -0,06 -0,23;0,17 0,08 SSF4 -0,02 -0,14;0,18 -0,09 -0,29;0,14 0,07 SSF5 -0,07 -0,21;0,05 -0,08 -0,29;0,13 0,65 SSF6 -0,1 -0,29;0,09 -0,1 -0,35;0,13 0,87 Kurtosis SSF0 -0,25 -0,39;0,05 -0,28 -0,52;0,16 0,5 SSF2 -0,09 -0,27;0,13 -0,13 -0,42;0,22 0,92 SSF3 -0,32 -0,66;0,05 -0,26 -0,62;0,21 0,37 SSF4 -0,44 -0,69;-0,07 -0,43 -0,8;0,02 0,85 SSF5 -0,59 -0,82;-0,26 -0,58 -0,84;-0,15 0,96 SSF6 -0,62 -0,87;-0,13 -0,62 -0,89;-0,21 0,73
Table 5: Median values of heterogeneity characteristics for EGFR
EGFR without EGFR
Filtre med Q1;Q3 med Q1;Q3 p
Mean SSF0 32,74 30,16;40,06 32,6 20,15;41,37 0,51 SSF2 1,85 0,78;4,72 1,54 -0,57;4,6 0,61 SSF3 4 1,86;5,7 2,89 1,01;7,77 0,99 SSF4 4,48 1,61;5,93 4,15 1,4;9,01 0,52 SSF5 3,2 0,67;5,55 4,53 1,54;8,87 0,26 SSF6 3,1 2,52;4,88 4,67 1,01;9,57 0,26 Sd SSF0 36,02 22,15;49,92 31,64 25,28;46,46 0,94 SSF2 47,79 42,65;56,31 55,09 48,07;63,54 0,11 SSF3 35,53 31,45;44,63 41,21 35,8;48,27 0,17 SSF4 33,74 21,12;38,22 33,55 28,71;40,09 0,47 SSF5 31,32 15,54;33,31 28,24 23,29;33,31 0,81 SSF6 30,06 12,61;32,66 25,22 19,65;33,19 1 Entropy SSF0 4,62 4,44;4,96 4,61 4,32;4,94 0,69 SSF2 5,09 4,91;5,18 5,07 4,75;5,27 0,95 SSF3 4,89 4,45;5,07 4,86 4,63;5,04 0,90 SSF4 4,82 4,19;4,89 4,71 4,46;5,37 0,85 SSF5 4,71 4,03;4,81 4,59 4,25;4,82 0,88 SSF6 4,67 3,83;4,83 4,42 4,08;4,75 0,76 Mpp SSF0 45,18 37,26;59,42 40,2 33,69;59,2 0,59 SSF2 42,12 35,77;44,7 46,23 40,43;53,29 0,06 SSF3 27,64 23,28;33,13 34,86 29,43;44,25 0,03 SSF4 26,35 17,64;29,52 29,18 24,56;35,06 0,18 SSF5 25,85 13,75;28,71 25,33 21,09;31,21 0,50 SSF6 25,18 11,78;28,18 22,91 17,61;29,9 0,84 Skewness SSF0 -0,04 -0,01;0,21 0,19 -0,16;0,34 0,60 SSF2 0,06 -0,07;0,14 0,04 -0,06;0,22 0,92 SSF3 -0,11 -0,41;0,09 -0,02 -0,18;0,2 0,24 SSF4 -0,33 -0,42;0,02 -0,04 -0,22;0,16 0,19 SSF5 -0,41 -0,51;-0,03 -0,07 -0,24;0,11 0,08 SSF6 -0,15 -0,51;0 -0,1 -0,34;0,13 0,49 Kurtosis SSF0 -0,14 -0,92;0,24 -0,26 -0,47;0;09 0,81 SSF2 0,09 -0,35;0,24 -0,13 -0,38;0,18 0,42 SSF3 0,13 -0,41;0,72 -0,29 -0,64;0,14 0,18 SSF4 -0,1 -0,54;0,07 -0,45 -0,8;-0,07 0,24 SSF5 -0,33 -0,46;0,15 -0,63 -0,84;-0,22 0,05 SSF6 -0,53 -0,78;0,29 -0,65 -0,89;-0,2 0,19
Table 6: Median values of heterogeneity characteristics for ALK translocation
ALK without ALK
Filtre med Q1;Q3 med Q1;Q3 p
Mean SSF0 36,7 31,64;49,17 32,6 20,19;40,41 0,37 SSF2 5,92 5,35;6,53 1,54 -0,56;4,53 0,13 SSF3 7,55 3,85;13,02 2,84 1,1;7,46 0,28 SSF4 10 3,87;15,96 4,15 1,4;8,28 0,24 SSF5 12,84 2,62;14,27 4,36 1,36;8,04 0,35 SSF6 10,68 1,77;14,23 4,36 1,01;7,46 0,41 Sd SSF0 32,3 24,48;50,66 31,64 24,14;46,46 0,74 SSF2 71,6 57,7;74,76 54,56 47,73;61,88 0,01 SSF3 48,19 47,37;51,64 40,89 35,24;47,25 0,02 SSF4 36,44 36,36;41,36 33,42 28,45;39,26 0,11 SSF5 29,95 29,27;36,13 28,24 23,3;34,93 0,50 SSF6 26,11 22,3;38,63 25,41 19,51;32,75 0,68 Entropy SSF0 4,75 4,5;4,93 4,61 4,32;4,95 0,58 SSF2 5,31 5,08;5,36 5,07 4,75;5,26 0,26 SSF3 5,09 4,8;5,11 4,86 4,62;5,03 0,27 SSF4 4,86 4,72;4,91 4,71 4,46;4,9 0,36 SSF5 4,68 4,49;4,77 4,59 4,25;4,82 0,65 SSF6 4,55 4,25;4,88 4,53 4,08;4,75 0,59 Mpp SSF0 41,35 38,92;71,14 40,2 33,95;59,2 0,57 SSF2 57,08 53,91;60,52 45,62 39,68;51,62 0,01 SSF3 46,43 39,7;48,04 33,18 28,73;42,68 0,02 SSF4 36,49 32,36;37,55 28,2 24,18;34,66 0,15 SSF5 29,44 24,33;40,22 25,33 20,68;31,11 0,27 SSF6 22,91 17,56;45,54 23,13 17,61;29,44 0,63 Skewness SSF0 0,33 -0,02;0,34 0,18 -0,16;0,33 0,72 SSF2 0,13 0,03;0,27 0,04 -0,07;0,22 0,30 SSF3 0,01 -0,06;0,24 -0,03 -0,18;0,18 0,71 SSF4 -0,1 -0,12;0,15 -0,04 -0,24;0,16 0,98 SSF5 0,05 -0,04;0,07 -0,08 -0,26;0,11 0,70 SSF6 -0,07 -0,09;0,15 -0,11 -0,35;0,12 0,56 Kurtosis SSF0 -0,11 -0,29;-0,11 -0,26 -0,47;0,14 0,65 SSF2 -0,21 -0,57;0,02 -0,13 -0,38;0,18 0,69 SSF3 -0,44 -0,6;-0,23 -0,28 -0,64;0,18 0,67 SSF4 -0,5 -0,86;0,42 -0,41 -0,78;-0,06 0,87 SSF5 -0,49 -0,92;0,28 -0,59 -0,84;-0,18 0,97 SSF6 -0,65 -0,77;-0,64 -0,58 -0,88;-0,18 0,98
SERMENT D’HIPPOCRATE
En présence des Maîtres de cette Faculté, de mes chers condisciples et devant l’effigie
d’HIPPOCRATE, Je promets et je jure d’être fidèle aux lois de l’honneur et de la probité dans l’exercice de la Médecine. Je donnerai mes soins gratuitement à l’indigent et n’exigerai jamais un salaire au-dessus de mon travail. Je ne participerai à aucun partage clandestin d’honoraires. Admis dans l’intimité des maisons, mes yeux n’y verront pas ce qui s’y passe ; ma langue taira les secrets qui me seront confiés et mon état ne servira pas à corrompre les mœurs, ni à favoriser le crime. Je ne permettrai pas que des considérations de religion, de nation, de race, de parti ou de classe sociale viennent s’interposer entre mon devoir et mon patient. Je garderai le respect absolu de la vie humaine. Même sous la menace, je n’admettrai pas de faire usage de mes connaissances médicales contre les lois de l’humanité. Respectueux et reconnaissant envers mes Maîtres, je rendrai à leurs enfants l’instruction que j’ai reçue de leurs pères. Que les hommes m’accordent leur estime si je suis fidèle à mes promesses. Que je sois couvert d’opprobre et méprisé de mes confrères si j’y manque.
RESUME:
Objectif : Etude du lien entre hétérogénéité tumorale mesurée en scanner non injecté et statut
des biomarqueurs habituels dans les adénocarcinomes pulmonaires.
Méthode : Cette étude rétrospective monocentrique a inclus 132 patients qui avaient bénéficié
d’une biopsie pulmonaire trans-thoracique retrouvant un adénocarcinome pulmonaire et chez qui les mutations EGFR, KRAS et la translocation ALK avaient été recherchées. Six paramètres provenant de l’histogramme de densité des pixels des tumeurs sur des scanners non injectés caractérisaient l’hétérogénéité tumorale : l'atténuation moyenne, la déviation standard, l'entropie (degré d’organisation), la moyenne des pixels positifs (MPP), le coefficient de dissymétrie et le coefficient d’aplatissement. Ils étaient étudiés sans filtration (SSF0) puis pour cinq degrés de filtration spatiale différents, du plus fin (SSF2) au plus grossier (SSF6). Une analyse statistique univariée et multivariée a étudié le lien entre ces paramètres d’hétérogénéité et le statut des biomarqueurs.
Résultat : 40/132 (30%) patients avaient une mutation KRAS, 9/132 (6.8%) une mutation EGFR
et 5/132 (3.8%) une translocation ALK. Les paramètres significatifs étaient pour la mutation KRAS l’atténuation moyenne au filtre moyen (SSF4) (AUC=0.64, Se=82%), pour la mutation EGFR, MPP au filtre moyen (SSF3) (AUC=0.71, Se=81%) et pour la translocation ALK, la déviation standard au filtre fin (AUC=0.84, Se=100%). `
Conclusion : Il existe dans notre série un lien statistique entre caractère d’hétérogénéité
tumorale mesurée en scanner et le statut pour les biomarqueurs dans les adénocarcinomes pulmonaires.
ABSTRACT:
Purpose: To determine if texture parameters derived from unenhanced computed tomography
(CT) images of primary lung adenocarcinomas were related to mutational characteristics of these tumors.
Methods: One hundred and thirty-two consecutive patients who underwent transthoracic lung
core biopsy showing primary lung adenocarcinoma were included in this monocentric retrospective study. EGFR mutations, KRAS mutations and ALK rearrangements were systematically tested. Tumor texture analysis was performed on non-enhanced CT.
Heterogeneity analysis relative to pixel distribution was performed using six parameters: mean attenuation (average brightness), standard-deviation (variation from the mean i.e. width of the histogram), entropy (global irregularity), skewness (asymmetry of the curve) and kurtosis (peakedness of the curve). Pixel distribution histograms were derived using 6 spatial scale filter (SSF) values: i.e., without-filtration (SSF 0), using fine (SSF 2); medium-coarse (SSF 3, 4); and coarse (SSF 5, 6) texture scales. Correlations between texture parameters and EGFR, KRAS, and
ALK mutational status were studied. Statistical analysis comprised univariate and multivariate
analyses.
Results: 40/132 (30%) patients showed KRAS mutations, 9/132 (6.8%) EGFR mutations, and
5/132 (3.8%) ALK rearrangements. Significant parameters for each mutation were: for KRAS mutations, mean attenuation using medium-coarse texture (SSF 4) (AUC=0.64, Sensitivity (Se),82%); for EGFR mutations, MPP with medium texture (SSF3) (AUC=0.71, Se=81%); for
ALK rearrangements, standard deviation using fine textures (AUC=0.84, se=100%).
Conclusion: CT texture parameters obtained from unenhanced CT are significantly associated