HAL Id: hal-03115308
https://hal.inria.fr/hal-03115308
Submitted on 15 Feb 2021
HAL is a multi-disciplinary open access
archive for the deposit and dissemination of
sci-entific research documents, whether they are
pub-lished or not. The documents may come from
teaching and research institutions in France or
abroad, or from public or private research centers.
L’archive ouverte pluridisciplinaire HAL, est
destinée au dépôt et à la diffusion de documents
scientifiques de niveau recherche, publiés ou non,
émanant des établissements d’enseignement et de
recherche français ou étrangers, des laboratoires
publics ou privés.
Novelty detection on graph structured data to detect
network intrusions
Laetitia Leichtnam, Eric Totel, Nicolas Prigent, Ludovic Mé
To cite this version:
Laetitia Leichtnam, Eric Totel, Nicolas Prigent, Ludovic Mé. Novelty detection on graph structured
data to detect network intrusions. CAID 2020 - Conference on Artificial Intelligence for Defense, Dec
2020, Virtual, France. �hal-03115308�
detect network intrusions
Laetitia Leichtnam1, Eric Totel2, Nicolas Prigent3, and Ludovic M´e3
1
Centrale Sup´elec, Univ. Rennes, IRISA, France [email protected]
2
IMT Atlantique, IRISA, Rennes, France [email protected]
3
LSTI, St-Malo, France [email protected]
4 INRIA, Univ. Rennes, IRISA, France [email protected]
Abstract. It is difficult to detect new types of attacks in heterogeneous and scalable networks in time without generating too many false alarms. While supervised anomaly detection techniques are often used to that end, security experts generally do not have labeled datasets. That’s why unsupervised learning, that does not require labeled data, should be pre-ferred.
With sec2graph [4], we introduced a representation of security events in the form of a graph linking what we defined as security objects and proposed a method for anomaly detection based on auto-encoders. This representation allows a rich description of the events that are analyzed. In this paper, we apply our approach to the CICIDS2018 dataset and show that our method outperforms classical event modeling and anomaly detection approaches.
Keywords: Network Intrusion Detection System· Knowledge graph · Autoencoder
1
Introduction
Security Operational Centers (SOC) ensure the collection, correlation, and anal-ysis of security events on the perimeter of the organization they defend. A SOC must detect and analyze internal and external attacks. This mission is hard because security analysts must supervise numerous highly-distributed and het-erogeneous systems that use multiple communications protocols.
To process this very heterogeneous data, data model based on knowledge graphs, that allow semantic linking of diverse information have been proposed for example in STIX model [6]. A model built on a knowledge graph can in-deed contain different types of valuable information while allowing automatic processing of the data.
Graphs structures need however one preprocessing step, the features encod-ing, before being process automatically [3], [5]. These techniques consist in trans-forming property graphs to a vector or a set of vectors that can be handled by machine learning algorithms.
2 L. Leichtnam et al.
To detect network attacks, anomaly detection techniques have been proposed. These techniques are often built on supervised learning, that requires labeled data during the learning phase. However, security experts often do not have such labeled data sets from their own event logs and data labeling is expensive [1]. As an alternative, an unsupervised anomaly detection technique called ”novelty detection”, based on auto-encoding can be used. This technique is generally used when the amount of abnormal data available is insufficient to build explicit models for non-normal classes [8].
In this paper, we first present the model sec2graph, a unified graph repre-sentation for heterogeneous network logs. It integrates into a single graph het-erogeneous information found in the events and thus allows the construction of a rich vision of the normal situation. We then present a process to efficiently en-code this unified graph so that an auto-enen-coder can learn the normal situation and then detect abnormal activities with two different strategies. We finally use CICIDS2018 dataset [9] to evaluate the ability of the learned model to detect anomalies.
Our contributions are, therefore:
– The definition of two different strategies of detection based on the sec2graph’s novelty detector that overpass previous results
– Experimental results on the CICIDS2018 dataset showing that our approach brings a significant improvement over deep anomaly detection algorithms. In particular, this paper presents a features encoding method that is easier and computationally more efficient than the one presented in our previous paper [4]. It also presents a new anomaly computation strategy allowing to significantly increase the attack detection score.
This paper is organized as follows: our global approach, named sec2graph, is presented in Section 2. This section synthesizes the approach described in [4] and presents a detection strategy based on the auto-encoders. Anomaly detection re-sults and comparative analysis with other methods on the CICIDIS2018 dataset are discussed in Section 3. Finally, conclusions are presented in Section 4.
2
The sec2graph approach
Network event logs are used as an input for the whole sec2graph process. Sec-tion 2.1 explains how we build a graph of security objects from network events; Section 2.2 explains how we encode this graph into vectors able to be handled by an auto-encoder; Section 2.3 explains how anomalies can be detected by the auto-encoder.
2.1 Building Security Object Graphs from Network Events
A log file can be described as a sequence of events resulting from the observation of activity in the network. Each event is made of several fields and some of these fields are particularly relevant to identify links between events. For each type of event, we identify the most relevant fields and create one or several Security
Objects (SOs). A SO is a set of attributes, each attribute corresponding to a particular event field.
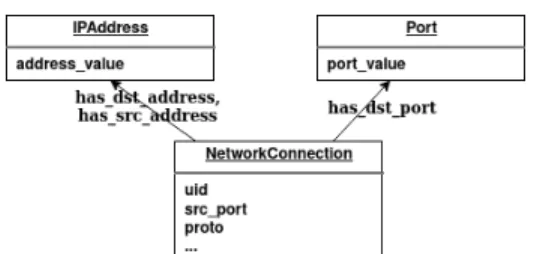
For example, a network connection event leads to four SOs: a source IP Address SO, a destination IP Address SO, a Destination Port SO and finally, the NetworkConnection SO itself that regroups attributes corresponding to the fields we identified as less important to create relations between events. For each type of event, we designed a translation into a set of linked SOs. Thus, each event is represented by a subgraph. For example, the SOs and the links created from logs extracted from the Zeek IDS tool [7] conn.log log files are illustrated in Figure 1.
conn.log ts uid id.orig hid.orig pid.resp h id.resp pproto service duration orig bytes resp bytes conn state local orig local resp missed bytes history orig pkts orig ip bytes resp pkts resp ip bytes tunnel parents
Fig. 1. Building a graph from one log event of the conn.log file
To build the complete graph, we take as an input the network events coming from various log files. From each event, and according to its type, we extract the SOs and the links between them as described before. We then take each SO of the sub-graph. If this SO already exists in the global graph (for instance, the same IPAddress was already identified in a previous event), we replace the SO in the new sub-graph with the SO that already exists in the global graph. Therefore, if an event contains an SO that was already found in a previous event, the old sub-graph will be linked to the new sub-graph through this SO.
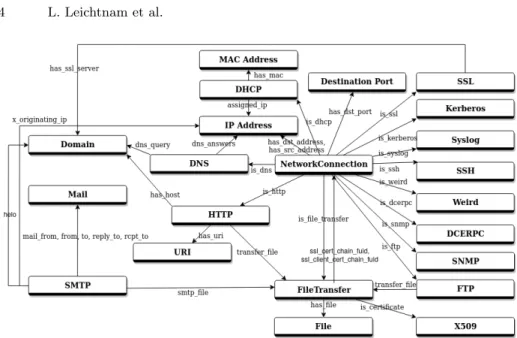
The graph model in Figure 2 shows the different types of SOs (nodes of the graphs) and their semantic links (edges of the graphs). For clarity reason, we have not represented the attributes of the SOs on this figure. Our model is suited to the pieces of information that are representative of network events. It can also evolve easily according to the needs of the analysts. More details on the building of the SO graph can be found in [4].
2.2 Encoding the graph for machine learning
The second step of sec2graph transforms the graph we computed in a structure that can be processed efficiently by a machine learning algorithm. In our case, the encoding method must encode both the structure of the graph (i.e., the links between the SOs) and the specific information associated with both the nodes (SOs) and the edges (links). Moreover, the result of the encoding should be of
4 L. Leichtnam et al.
Fig. 2. Complete Security Objects and Relations Model Representation
reasonable size while it should contain enough information to detect anomalies. First attempts with the graph representation learning technique node2vec [?] required too many computational resources to be applied on graphs containing millions of nodes and edges. Moreover, the combination of node2vec with an anomaly detection algorithm made the interpretation of the results difficult. Since there does not exist a single best method to encode our graph, we had to design one that was tailored to our specific case.
A given SO can be linked to several events, normal or abnormal. An edge, on the other hand, is only related to the event that led to its construction. Therefore, an anomaly is not carried by the node (an IP address or a port are not abnormal per se) but by the edges that link the SOs together. Consequently, we have chosen to encode our graph by encoding each of its edges. Our representation takes into account the structure of the graph, information contained in SO’s attributes, and the type of the edges. To this end, we encode an edge as a vector resulting from the concatenation of information on (a) the type of this edge, (b) the attributes of its source node, (c) the attributes of its destination node.
To encode the edge type and the attributes of the nodes, we use common machine learning techniques to transform numerical and categorical data such as the number of packets transferred or the protocol that was used (tcp, udp, or icmp) into a binary vector. The basic principle consists in determining a function which associates a category for each value of each attribute, regardless of the type considered. Then, the category is encoded in a binary vector by using the one-hot-encoding techniques. The result of this process is a fixed-dimension binary vector encoding an edge that can now be processed by an auto-encoder.
2.3 Novelty Detection with an Auto-encoder
An auto-encoder learns a representation (encoding) of a set of pieces of data, typically for dimensional reduction. To do so, it learns a function that sets the outputs of the network to be equal to its inputs. It is made of two parts : an encoder and a decoder. The encoder compresses the input data into a low-dimensional representation, and the decoder generates a representation that is as close as possible to its original input from the reduced encoding.
Anomaly detection methods based on auto-encoders use it to first learn the “normal” behavior by using a dataset with benign data. Then, it is assumed that attacks will generate “abnormal” observations that the auto-encoder has never seen. Therefore, it will not be able to reconstruct the data identically. As a consequence, by computing the difference between the input and the output, we can determine an error, called reconstruction error. If this error is above a determined threshold, an analyst is then able to detect anomalies in a dataset.
While classical approaches seek to identify anomalies linked to events, our approach seeks to identify anomalies related to the links between objects. To refer to the case of anomalies on events, we have considered two strategies called max and mean. The first one consists in considering as abnormal any event containing at least one link exceeding a detection threshold (max strategy). The second (mean strategy) consists in computing the mean of the reconstruction errors of all the links associated with an event. If this average exceeds our detection threshold, the event is considered abnormal. In other words, the first strategy supposes that the anomaly is carried by one link (one strong local anomaly), whereas the second strategy assumes that the anomaly is carried by all the links of the same event (the sum of several weak anomalies).
3
Implementation and experimental results
This section details our implementation choices and a comparison of the sec2graph approach with other approaches based on anomaly detection.
3.1 Configuration
We choose to use the CICIDS2018 dataset that is made of ten pcap encompassing millions of events. This dataset was generated at the Canadian Cybersecurity Institute and contains ten days of mixed traffic, benign and attacks such as DoS, DDoS, BruteForce, XSS, SQL injection, infiltration, and botnet activities. The CICIDS2018 dataset is the most recent one that models a complete network configuration with a wide variety of components. The data set is also labeled, allowing us to quantify the effectiveness of our method. To generate log files from the capture files, we used the Zeek IDS tool [7] (formerly Bro) that can generate network and application logs such as connections, http communications, or file transfers.
In addition to the number of true positives (TP), false positives (FP), true negatives (TN), and false negatives (FN), we evaluate our results using the
6 L. Leichtnam et al.
following standard measures: Precision, Detection Rate also known as Recall (DR), True Negative Rate (TNR) and False Positive Rate (FPR). Precision gives the ratio of true abnormal events over events reported as abnormal. DR gives the proportion of events correctly detected as abnormal out of all truly abnormal events. TNR is the proportion of normal events correctly classified among all normal events and FPR the proportion of normal events incorrectly classified among all normal events. Formally, these criteria can be defined as follows: P recision = T P T P + F P; DR = T P T P + F N; T N R = T N F P + T N; F P R = F P F P + T N
3.2 Defining an optimal threshold for detection
In this section, we present the experiments conducted to determine the threshold value to be used for the anomaly score. The analyst sets this threshold value according to his or her supervisory context, lowering the threshold value if it is more important for the analyst not to miss any attacks than to have to eliminate a large number of false positives.
We determine the value of the threshold as follows: first, we consider all the events on the first day of the CICIDS2018 dataset in time windows where there is no attack. With this data, we determine the rate of false positives according to the detection threshold. We obviously want the lowest possible false-positive rate.
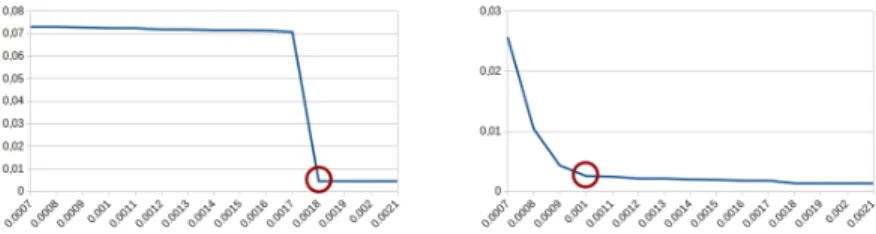
The curves in Figure 3 shows the evolution of the FPR as a function of the detection threshold for the strategies max (left) and mean (right). We computed the FPR on a sample of benign data composed of the 12 first attack-free hour-timeslot. A threshold of 0.0018 gives us an FPR of 0,46% for the max strategy while a threshold of 0.001 gives us an FPR of 0,25% for the mean strategy. For both strategies, we see in the figure that the FPR does not decrease significantly when we increase the detection threshold above 0.0018 for the max strategy and above 0.001 for the mean strategy. In addition, increasing the detection threshold too much can induce a high false-negative rate.
Fig. 3. False Positive Rate (FPR) according to the value of the detection threshold for max strategy (left) and mean strategy (right) computed on a sample of benign data.
We conclude that a threshold higher than 0.0018 for the max strategy and a thresh-old higher than 0.001 for the mean strategy should be retained.
3.3 Comparison with other anomaly detection algorithms on the same dataset
To compare our results with the state of the art, we took the results of a study on intrusion detection using deep learning methods [2] that uses the same data set as we do, the CICIDS2018 data set.
Ferrag et al. [2] compares the results of seven supervised and unsupervised classical deep learning algorithms applied to this dataset: Deep Neural Network (DNN), Recur-rent Neural Network (RNN), and Convolutional Neural Network (CNN), that are all supervised algorithms as well as Restricted Boltzmann Machine (RBM), Deep Belief Network (DBN), Deep Boltzmann Machine (DBM) and Auto-Encoder (AE) that are unsupervised.
The table 1 provides a comparison of the results obtained by Ferrag on the CI-CIDS2018 dataset with those of sec2graph using the previously determined optimal value for the detection limit for the two strategies max and mean. To compute the de-tection rate, we first train and validate our model on a sample of benign data composed of the 12 first attack-free hour-timeslot. We use a split ratio of 0.1 between the train and validation set. The TNR was computed on the whole dataset and the detection rate for each attack was computed on timeslot containing the attacks.
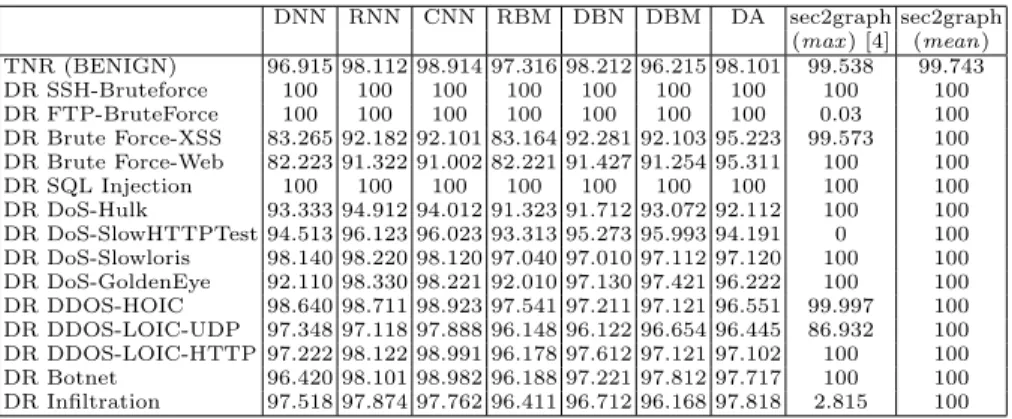
Table 1. Comparison of True Negative Rate (TNR) and Detection Rate (DR) for each type of attack and for different methods (in %).
DNN RNN CNN RBM DBN DBM DA sec2graph sec2graph (max ) [4] (mean) TNR (BENIGN) 96.915 98.112 98.914 97.316 98.212 96.215 98.101 99.538 99.743 DR SSH-Bruteforce 100 100 100 100 100 100 100 100 100 DR FTP-BruteForce 100 100 100 100 100 100 100 0.03 100 DR Brute Force-XSS 83.265 92.182 92.101 83.164 92.281 92.103 95.223 99.573 100 DR Brute Force-Web 82.223 91.322 91.002 82.221 91.427 91.254 95.311 100 100 DR SQL Injection 100 100 100 100 100 100 100 100 100 DR DoS-Hulk 93.333 94.912 94.012 91.323 91.712 93.072 92.112 100 100 DR DoS-SlowHTTPTest 94.513 96.123 96.023 93.313 95.273 95.993 94.191 0 100 DR DoS-Slowloris 98.140 98.220 98.120 97.040 97.010 97.112 97.120 100 100 DR DoS-GoldenEye 92.110 98.330 98.221 92.010 97.130 97.421 96.222 100 100 DR DDOS-HOIC 98.640 98.711 98.923 97.541 97.211 97.121 96.551 99.997 100 DR DDOS-LOIC-UDP 97.348 97.118 97.888 96.148 96.122 96.654 96.445 86.932 100 DR DDOS-LOIC-HTTP 97.222 98.122 98.991 96.178 97.612 97.121 97.102 100 100 DR Botnet 96.420 98.101 98.982 96.188 97.221 97.812 97.717 100 100 DR Infiltration 97.518 97.874 97.762 96.411 96.712 96.168 97.818 2.815 100
The values in this table show that the sec2graph approach is superior to the other approaches in terms of FPR, regardless of the strategy chosen. The sec2graph approach with the medium strategy offers a 100% detection rate for all types of attacks while having a false positive rate of only 0.25%.
However, we note that the max approach first proposed in [4] gives poor results for the detection of FTP-Bruteforce, DoS-Slow-HTTPTest, and Infiltration attacks. It gives an average score for the DDOS-LOIC-UDP attack but also high scores for all other attacks where the detection rate surpasses one of the other learning machine algorithms.
Mean strategy is more able at highlighting small novelties on several links, novelties which together constitute an anomaly than max strategy. FTP-Bruteforce, DoS-Slow-HTTPTest, and Infiltration attacks present weak anomalies on most of the links and
8 L. Leichtnam et al.
do not present big reconstruction errors. The max strategy could outperform the mean strategy only if a link with a low anomaly score compensates for the anomaly of a link with a high score. This case was not encountered in this dataset.
4
Conclusion
We proposed in this paper a graph representation of security events that underlines the relationship between them. We also proposed an unsupervised technique built on an auto-encoder to efficiently detect anomalies on this graph representation with two different strategies to compute the anomaly score. This approach can be applied to any data set without prior data labeling. Using the CICIDS2018 dataset, we showed that the use of graph structures to represent security data coupled with an auto-encoder gives results that are better than common deep anomaly detection methods (supervised and unsupervised).
To further improve our detection results, we plan to use another kind of auto-encoder (LSTM auto-auto-encoder) to take temporal links between events into account to complement to logical links that we already take into account. Another area for improvement is related to the usability and interpretability of results by a security analyst. Here, the idea is to present to the analyst a graphical view of the detected anomalies, based on the SOs graphs that we have defined. We believe that this would help the analyst eliminating false positives or reconstructing global attack scenarios.
References
1. Anagnostopoulos, C.: Weakly supervised learning: How to engineer labels for ma-chine learning in cyber-security. Data Science for Cyber-Security (2018)
2. Ferrag, M.A., Maglaras, L., Moschoyiannis, S., Janicke, H.: Deep learning for cyber security intrusion detection: Approaches, datasets, and comparative study. Journal of Information Security and Applications 50, 102419 (2020)
3. Grover, A., Leskovec, J.: node2vec: Scalable feature learning for networks. In: Pro-ceedings of the 22nd ACM SIGKDD international conference on Knowledge discov-ery and data mining. pp. 855–864 (2016)
4. Leichtnam, L., Totel, E., Prigent, N., M´e, L.: Sec2graph: Network attack detection based on novelty detection on graph structured data. In: International Conference on Detection of Intrusions and Malware, and Vulnerability Assessment. pp. 238–258. Springer (2020)
5. Narayanan, A., Chandramohan, M., Venkatesan, R., Chen, L., Liu, Y.: graph2vec: Learning distributed representations of graphs. In: International Workshop on Min-ing and LearnMin-ing with Graphs (2017)
6. OASIS: Stixv2.0, freetaxii.github.io
7. Paxson, V.: Bro: a system for detecting network intruders in real-time. Computer networks (1999)
8. Pimentel, M.A., Clifton, D.A., Clifton, L., Tarassenko, L.: A review of novelty de-tection. Signal Processing (2014)
9. Sharafaldin, I., Lashkari, A.H., Ghorbani, A.A.: Toward generating a new intrusion detection dataset and intrusion traffic characterization. In: ICISSP (2018)