HAL Id: hal-01501214
https://hal.archives-ouvertes.fr/hal-01501214
Submitted on 4 Apr 2017
HAL is a multi-disciplinary open access
archive for the deposit and dissemination of
sci-entific research documents, whether they are
pub-lished or not. The documents may come from
teaching and research institutions in France or
abroad, or from public or private research centers.
L’archive ouverte pluridisciplinaire HAL, est
destinée au dépôt et à la diffusion de documents
scientifiques de niveau recherche, publiés ou non,
émanant des établissements d’enseignement et de
recherche français ou étrangers, des laboratoires
publics ou privés.
Public Domain
Elastic parameters of intermediate soils based on
bender-extender elements pulse tests
Carol Murillo, Mohammad Sharifipour, Bernardo Caicedo, Luc Thorel,
Christophe Dano
To cite this version:
Carol Murillo, Mohammad Sharifipour, Bernardo Caicedo, Luc Thorel, Christophe Dano. Elastic
parameters of intermediate soils based on bender-extender elements pulse tests. Soils and Foundations,
Japanese Geotechnical Society, 2011, 51 (4), pp. 637-649. �10.3208/sandf.51.637�. �hal-01501214�
i) Professor, Department of Civil and Agricultural Engineering National University of Colombia, Colombia.
ii) Razi University, formerly at Research Institute in Civil and Mechanical Engineering, Ecole Centrale Nantes, University of Nantes, France. iii) Department of Civil and Environmental Engineering, University of Los Andes, Colombia (bcaicedo@uniandes.edu.co).
iv) Senior Researcher, LUNAM University, IFSTTAR, Department of Geotechnical Engineering, Environment and Risks, Physical Modelling in
Geotechnics Group, France.
v) Associate Professor, Research Institute in Civil and Mechanical Engineering, Ecole Centrale Nantes, University of Nantes, France.
ELASTIC PARAMETERS OF INTERMEDIATE SOILS BASED ON
BENDER-EXTENDER ELEMENTS PULSE TESTS
CAROLMURILLOi), MOHAMMADSHARIFIPOURii), BERNARDO CAICEDOiii),
LUC THORELiv)and CHRISTOPHE DANOv)
ABSTRACT
The elastic behaviour of compacted soils subjected to very small strains (smaller than 10-5) is essential, because the
serviceability of most geotechnical structures depends on soil elastic properties. Small-strain stiŠness of soils was stud-ied in the past years using diŠerent experimental devices (mainly resonant columns). However, the results have been relatively inconsistent. The bender elements technique, now extensively used in soil mechanics, oŠers an e‹cient non destructive alternative, since it is based on the propagation of shear waves. To enrich the common bender elements tes-ting results providing only shear modulus values, an evolution of the bender elements technique, named bender-exten-der element's is used in this paper. This device allows the simultaneous measurement of the shear and compression wave velocities. As a result, the two independent elastic constants are measured for the same sample in order to avoid indirect estimations. Also, for unconˆned sample's the GrindoSonic test is performed: this test is based on the tran-sient vibrational response of the sample to a slight shock. The present study provides new results about the elastic properties of intermediate unsaturated soils made of mixtures of sand and clay. The results for the elastic properties are presented as a function of the suction level. Finally, a model relating the elastic behaviour of these unsaturated soils is proposed.
Key words: deformation, dynamic, laboratory tests, vibration, wave propagation (IGC: D1/D7)
INTRODUCTION
The identiˆcation of elastic parameters is an essential topic in geotechnical engineering. In this paper, particu-lar emphasis is placed on the elastic behaviour of com-pacted soils subjected to the very small strains (smaller than 10-5) typical in many geotechnical structures, such
as roads or railways, embankments and earth structures. Their serviceability is clearly determined by soil elastic properties which depend on the water content and suction level.
Small-strain stiŠness of soils has been studied in the past using diŠerent experimental devices (mainly resonant columns but also local small strain devices). However, the results have been relatively inconsistent. The bender elements technique now extensively used in soil mechanics (e.g., Viggiani and Atkinson, 1995; Brig-noli et al., 1996; Fratta and Santamarina, 1996; Fam and Santamarina, 1997; Kawaguchi et al., 2001; Leong et al., 2005) oŠers an e‹cient alternative despite some short-comings relative to interpretation methods. The most common bender element device was developed by Shirley
and Hampton (1977): it allows the propagation of shear waves, with only the shear modulus G directly measura-ble. An evolution of the bender elements technique, named bender-extender elements, was developed by Lings and Greening (2001). This device allows for the simultaneous measurement of the shear and compression wave velocities. Consequently, two independent elastic constants are determined on the same sample, and in-direct estimations can be avoided.
Most of the studies involving bender elements have been performed on purely frictional sands or soft cohe-sive soils (clays). Few results concern intermediate soils made of a mixture of sand and clay (Rossato et al., 1992; Kimura et al., 1994), which are both cohesive and fric-tional. The present study provides new results about the elastic properties of intermediate unsaturated soils made of mixtures of sand and clay, identiˆed using the ben-der—extender elements testing device. More, the ex-perimental investigation has been completed with Grin-doSonic pulse tests to evaluate the elastic properties of samples in unconˆned conditions and therefore assist the user in the determination of wave travel times by the
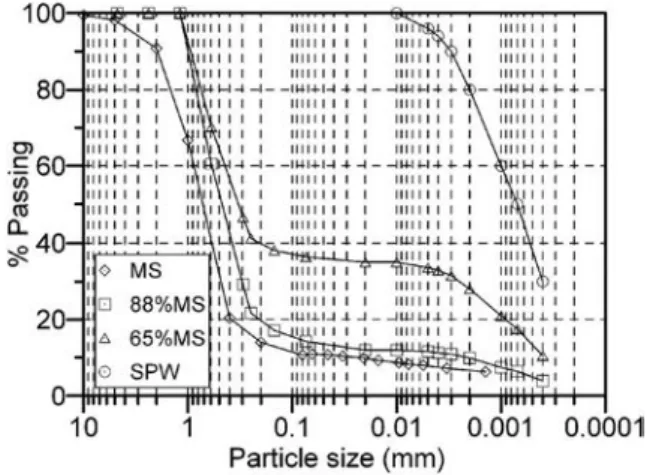
ben-Fig. 1. Particle size distribution for Speswhite Kaolin (SPW or S1), Missilac Sand (MS) and mixtures S2 and S3
Fig. 2. Proctor test results
der extender elements technique. The GrindoSonic method, more often employed in concrete characteriza-tion, is based on the transient vibrational response of a sample subjected to a slight shock. The new scope of in-vestigation, focusing on intermediate soils also requires some key points related to wave propagation, like the de-termination of the travel times, near ˆeld eŠects and in-‰uence of the shape of signal to be revisited.
The resulting values of the elastic properties of inter-mediate compacted soils are presented, with the suction level in the soil specimens taken into consideration. Fi-nally, a model describing the elastic behaviour of these unsaturated soils is proposed.
TESTED SOILS
The tested compacted soils are reconstituted in the laboratory from diŠerent mixtures, deˆned by their weight percentage of Speswhite kaolin (SPW), and Mis-sillac sand (MS). The index properties of the SPW clay are a liquid limit of 55.1z, a plastic limit of 32.3z, and a speciˆc gravity Gs of 2.62, the speciˆc gravity Gs of the sand fraction MS is 2.65. Figure 1 shows the grain size distributions of these soils. Note that the grain size
distri-bution for grains smaller than 0.2mm is measured using a laser granulometer according to the ISO 13320–1 stan-dard (1999).
Three diŠerent mixtures of soils were studied. These mixtures fall in three diŠerent categories of soils accord-ing to the French Road Soil Classiˆcation System (LCPC, 1992, 2003), which is based mainly on the grain size distribution and on the Methylene blue absorption. In this system, the soils are respectively classiˆed as A3, B6 and B31. According to the AASHTO soils classiˆca-tion system, these soils are ranked as A-7-5, A-1-a, and A-2-7, respectively. In the following paragraphs, the soils used in this study are designated as S1 for A3 or AASHTO A-7-5; S2 for B6 or AASHTO A-1; and S3 for B31 or AASHTO A-2-7. The mass percentage of MS for each of these soils is 0z (S1), 65z (S2) and 88z (S3); and the Methylene blue absorption values are 1.54, 1.21, and 1.11 g/100 g for the S1, S2, and S3, respectively.
Soil S3, which includes the smallest percentage of kao-lin, has the highest dry maximum unit weight measured following the standard Proctor test (Fig. 2) by compari-son with S2 and S1. These results agree with those ob-tained by Boussaid et al. (2003) with intermediate soils made of Fontainebleau sand and SPW.
SAMPLES CHARACTERISTICS Reconstitution
Sand is sifted in diŠerent fractions with maximum grain sizes of 1 mm, 0.5 mm, 0.2 mm and 80mm, respec-tively. Fractions lower than 1mm are then mixed in a 0.14 m3concrete mixer to reconstitute the material, and avoid
segregation. Kaolin is then added and mixed for three minutes to obtain a dry and homogeneous mixture. To obtain S1, S3 and S2 soils, 28z, 11z and 13z of water is added, respectively. The optimum Proctor water con-tents are 29.2z, 11.5z, and 14.4z respectively. Compaction
The mixture is introduced into a 30 cm large and 40 cm high cylindrical container in three successive layers of about 10 cm each. The soil mass is then subjected to a compressive vertical stress (sv) using a
pressure-con-trolled hydraulic actuator. The ˆnal vertical stress is equal to 2 MPa for S1 and 2.5 MPa for S2 and S3. The static compaction on specimens is applied for 10 minutes on each soil layer. After 10 minutes of compaction, no additional settlement is measured. The obtained density is calculated classically as the ratio of the mass and the volume of the sample. These values allow for a homogeneous material with a dry density close to the maximum Proctor density (Murillo et al., 2009a, 2009b). Four steel cores (10 cm in diameter, 20 cm long) are ˆnally placed on the top surface of the compacted soil. Using a hydraulic actuator, the steel cores are fully driven in the soil mass. Finally, each core sample is taken out from the mould.
Table 1. Soil sample properties Soil (cm)q hi (cm) (z)wi (z)wf (gr/cmrd 3) ei (z)Sri ukPaa-uw S1 9.51 7.14 27.26 28.28 1.44 0.837 90 8000 9.53 9.65 28.14 28.32 1.46 0.815 92 S2 9.51 6.99 10.79 11.74 1.84 0.484 63 1500 9.51 9.85 15.32 15.5 1.81 0.487 85 300 S3 9.53 7.44 11.21 11.13 1.94 0.374 80 60 9.51 9.85 11.28 11.29 1.93 0.384 78
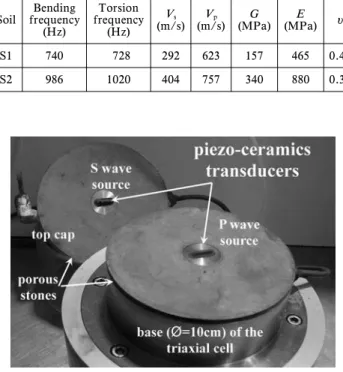
Table 2. GrindoSonic test results
Soil frequencyBending (Hz) Torsion frequency (Hz) Vs (m/s) (m/s)Vp (MPa)G (MPa)E y S1 740 728 292 623 157 465 0.45 S2 986 1020 404 757 340 880 0.3
Fig. 3. Bender extender elements
Soil Samples Properties
Table 1 summarizes the main characteristics of the samples. The diameterq is constant but the samples have been cut at two initial lengthshi(about 7 and 10 cm), for
each soil. The initial water contentwi(expected value) is
close to the ˆnal water contentwf(measured value). The
dry densityrdand the initial void ratioei are similar for
each sample of the same compacted soil showing good homogeneity from the compaction procedure. Further-more, the initial water content (or initial degree of satura-tionSri) is approximately the same for the samples of each
soil, except for S2, in order to examine the eŠect of the saturation degree. Samples of compacted soils are taken to measure their suction value using a pressure plate cell apparatus for soil S3 and a WP4-T chilled mirror appara-tus for soils S1 and S2. The mean suction values of the three diŠerent soils are presented in Table 1. The matric suction of the samples cover a broad range from 60 kPa for soil S3 with 88z sand to 8000 kPa for soil S1 with 100z of kaolin; soil S2 with 65z of sand was tested at two water contents: 11z and 15z, corresponding to 1500 kPa and 300 kPa matric suction, respectively.
EXPERIMENTAL DEVICES
Two non-destructive methods were used to indirectly identify the elastic properties of the tested soils in the small strain domain: the GrindoSonic method, for un-conˆned samples and the bender-extender elements method for conˆned samples.
GrindoSonic
For unconˆned samples, the shear (VS) and
compres-sion (VP) waves velocities were deduced from the
fun-damental resonant frequency of S1 and S2 samples using a non-destructive device, called GrindoSonic (Allison, 1988). The GrindoSonic device is used to generate and de-tect a short transient vibration propagating through a co-hesive sample resulting from a mechanical disturbance caused by a light mechanical impulse, generated by a light plastic hammer blow. Two pulse modes (torsion and bending) are required to measure the elastic parameters: they are obtained by varying the positions of both the hammer stroke and the detector.
The wave propagation is recorded using a piezoelectric detector in contact with the sample and then converted
into an electronic signal. The fundamental resonant fre-quency is automatically determined from the analysis of the signal. At least ˆve consistent measurements are re-quired to consider the statistical reliability of the result. A mathematical application (Spinner and TeŠt, 1961) is then used to identify the two independent parameters (Young's modulusE and shear modulus G) describing the isotropic-linear-elastic materials from the geometrical and physical data of the samples as well as from their fun-damental frequencies.
The results (Table 2) provide a rough estimate of the elastic properties of unconˆned samples which is useful for comparison with bender-extender measurements at zero conˆning pressure in the triaxial cell.
Bender-Extender Elements
A couple of piezo-ceramics transducers, called bender-extender elements (Fig. 3), is used to measure both com-pression (P-waves) and shear (S-waves) waves. This device is extensively described in Lings and Greening (2001). The bender-extender elements withstand a rela-tively large range of conˆning pressures, and they can be excited with diŠerent input signal frequencies and shapes. The piezo-ceramics transducers are embedded into the top cap and the base of a triaxial compression test ap-paratus. The upper element is excited by an electrical pulse which initiates a shear wave through the specimen. On the other hand, a compression wave is generated up-wards by the lower element. When each wave reaches the opposite element, the mechanical movement is then con-verted into an electric signal. Both the input and output signals are recorded.
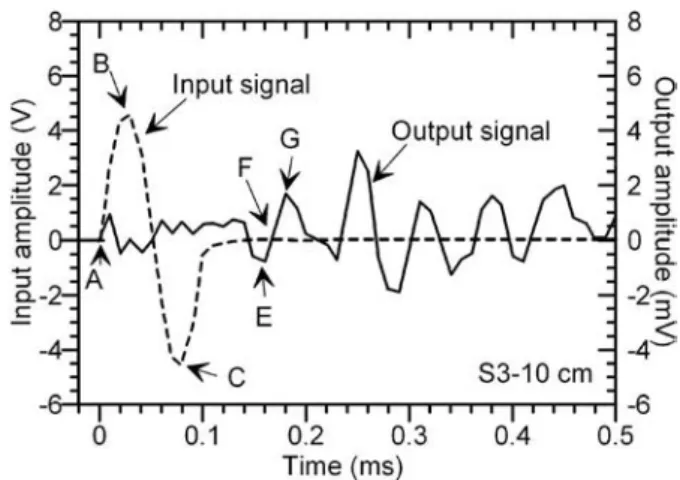
main-Fig. 4. Typical input and output signals of shear waves-characteristic points
tain perfect contact between the tested material and the transducer. The upper element is also pressed onto the sample. As a result, both elements penetrate into the sam-ple over a depth of 2.5 mm. Special attention is also given to the alignment and the position of the two elements for polarization and signals quality reasons. The cell pressure is controlled with a 2 MPa hydraulic actuator, which has a total volume of 200 cm3.
During tests, the shape (sine, square) and the frequency (5, 6.7, 8.3, and 10 kHz) of the excitation signal are im-posed by the user through the software interface. The sampling rate is 105 samples per second (100 kHz), and
the amplitude of the signal is ±5 volts. Tests were carried out on samples of 10 cm in diameter and 7 or 10 cm in height (Table 1). Records of wave propagation were per-formed for diŠerent conˆning pressures, varying from 0 (before ˆlling the cell with water) to 500 kPa along isotropic loading stress paths. The samples are protected from the conˆning ‰uid by a thin 0.5 mm thick latex membrane, adding a conˆning stress of 0.3 kPa.
Variations of the sample height under pressure are as-sessed by an external gauge. Measurement errors are un-avoidable because of the bedding eŠect and the compli-ance of the system (Scholey et al., 1995). The errors, however, remain small because of the specimen stiŠness (approximately 200 MN/m2 for the mean value of the
shear modulus). The size (diameter and height) and the mass of the specimens are initially carefully measured.
Assuming isotropy and homogeneity, the elastic parameters characterizing the linear elastic behavior (E, G ), and Poisson ratio n are related to the wave velocities in the framework of the mechanics of continuous media (e.g. Foti, 2000): G=r・V2 s (1) E=rV 2 s(3V2p-4V2s) V2 p-V2s (2) n=V 2 p-2V2s 2(V2 p-V2s) (3) whereVsis the shear wave velocity,VPis the compression
wave velocity, andr is the density of the soil. The velocity of the waves is given by:
V=L
T (4)
whereL is the eŠective tip-to-tip distance between the two bender-extender elements, corrected to take into account the shortening of the sample during the test, in compli-ance with the recommendations by Viggiani and Atkin-son (1995), Jovi ¾ci ác et al. (1996), and Brignoli et al. (1996) andT is the wave travel time relative to the compression wave,Tp, or the shear wave,Ts. Travel times result from
the analysis of the electric signals recorded during the tests.
The identiˆcation ofTP is relatively easy since it
cor-responds to the time interval between the input signal ini-tial point and the output signal ˆrst deviation, usually clear enough, even if the amplitude of the P-wave is ten
times lower than the amplitude of the shear wave. The estimation of Tsby a visual inspection of the
sig-nals has been debated since the mid-90's (Jovi ¾ci ác et al., 1996). However, this evaluation is somewhat di‹cult due to near-ˆeld eŠects. The interpretation methods reported in the literature are summarized in Table 3. The ˆrst ar-rival analysis is recommended for identiˆcation of wave velocities in rock samples (ASTM D 2845). Other charac-teristic points can be also selected in both input and out-put signals to determine travel time. In Fig. 4 points A, B and C are the ˆrst de‰ection, the positive peak and the negative peak of the input signal, respectively.
DiŠerent points can be identiˆed on the output signal (Fig. 4): point E corresponds to the ˆrst arrival inversion, point F to the ˆrst zero value observed immediately after point E, and point G is the ˆrst peak. The identiˆcation of these points is possible while the noise level on the out-put signal is less than approximately 10z of the maxi-mum amplitude.
DiŠerent methods can be used to identify the travel time of the shear wave Ts: (e.g., peak-to-peak time B-G
method, cross-correlation method).
According to Viggiani and Atkinson (1995), Lohani et al. (1999) and Kawaguchi et al. (2001), the travel time corresponding to the peak-to peak distance between the input and output signals might be globally wrong except for high frequency input signals. The di‹culty to estab-lish the peak in the output signal may generate errors mainly for square waves where no clear peak appears, particularly at low frequencies, for which the wave period is large.
The cross-correlation method (Mancuso et al., 1989; Viggiani and Atkinson, 1995; Mohsin and Airey, 2003) is a mathematical tool (Eq. (5)) that provides a reliable indi-cation on the similarity between the signals and on the degree of distortion. This method allows assessing the travel time of both shear and compression waves.
The cross-correlation function (Eq. (5)) combines the input signal (S1) with an output signal (S2) with a timet as
a delay gap. The travel timeTcc1orTcc2corresponds to the
sec-Fig. 5. Cross correlation method
Table 3. Interpretation methods reported in the literature for the determination of the shear wave travel time
Method Notation Principle Reference Inversion
(AE) Inv First inversion of theoutput signal Dyvik and Madshus(1985) First arrival
(AF) First
First zero value immediately after
inversion of signal Jovi ¾ci ác et al. (1996) Peak to peak
(BG) P-P
DiŠerence between peaks for output and input signal
Viggiani and Atkinson (1995)
Cross-correlation
CC1 Maximum value ofthe cross-correlation
Mancuso et al. (1989), Viggiani and Atkinson (1995), Mohsin and Airey (2003)
CC2 Second maximumvalue of the cross-correlation
Boulanger et al. (1998), Shariˆpour et al. (2004)
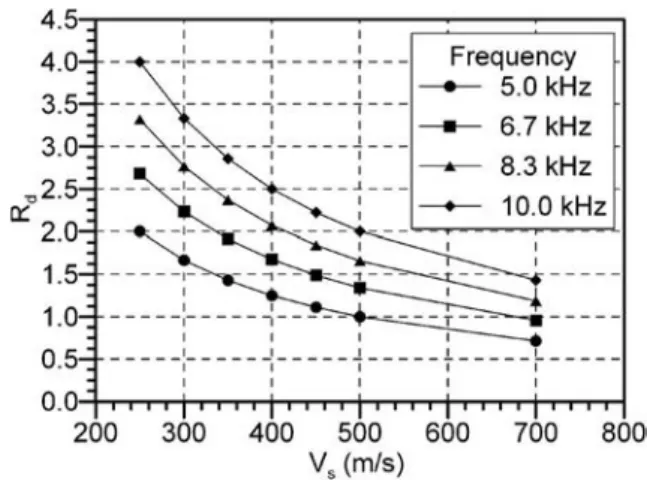
Fig. 6. EŠect of VSon Rdfor 10 cm high samples
ond maximum values (Fig. 5).
ccs1s2(t)= lim Tª/ 1 Tr
f
Tr S1(T+t)S2(T )dT (5)The GrindoSonic technique, which is rapid, non-des-tructive and reliable, can be easily carried out on cohesive and frictional unconˆned samples to estimate the elastic properties, and consequently the wave velocities in the tested soil. These measurements provide a helpful indica-tion to evaluate the reliability of each interpretaindica-tion method applied to the bender-extender technique.
INFLUENCE OF THE DIFFERENT TEST
CONDITIONS ON THE SHEAR WAVE VELOCITY A total of 768 wave velocity measurements have been carried out: 6 samples, 16 stages of conˆning pressures (between 0 and 500 kPa), 4 input frequencies (5, 6.7, 8.3 and 10 kHz), and 2 signal shapes (sine or square). Near-Field EŠects
Near-ˆeld eŠects appear as a result of a compression
wave that propagates through the sample and mask the arrival of the driven shear wave. This phenomenon oc-curs when the ratioRdbetween the length of the sample to
the signal wave length is smaller than four (Sanchez-Salinero et al., 1986; Jovi ¾ci ác et al., 1996; Brignoli et al., 1996; Lo Presti et al., 1995). In our case, bender-extender elements provide a direct measurement of the P-wave ve-locity: therefore, the outset of near-ˆeld eŠect in‰uence can be more easily identiˆed in the shear wave output sig-nals.
Initial tests were carried out on 20 cm high samples. However, after several attempts no clear response could be achieved for these specimens due to the weak energy of the wave which was limited to 10 kHz by the technology of the device. Due to this limitation, the tests were per-formed on smaller samples (7 cm and 10 cm high) even though near-ˆeld eŠect is enhanced.
The near-ˆeld eŠects are therefore systematically present during all the tests since the value ofRdis between
0.5 and 3.4 for 7 cm high samples, and 0.7 to 4 for 10 cm high samples. It is important to note that theRdvalue is
aŠected by the frequency of the input signal and the shear wave velocity, as shown in Fig. 6 for 10 cm high samples. In‰uence of the Signal Shape
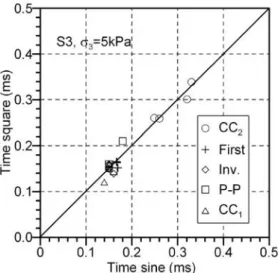
There is no signiˆcant diŠerence between the travels times obtained when the sample is excited with either pseudo sine or square waves (Fig. 7). However, each type of signal has advantages and disadvantages: (i) the iden-tiˆcation of the peak in the sine signal is easier and for this reason, the results of the sine signals, are less scat-tered than those obtained with the square signals; (ii) for square wave excitations, the quality of the output signals satisˆes all conˆning pressures and excitation frequen-cies, whereas the pseudo-sine wave excitation is eŠective when the excitation frequency is greater than 5 kHz only. This is probably due to the fact that the power spectrum for sine pulses is narrower than the power spectrum for square signals.
In‰uence of the Frequency
re-Fig. 7. Time for diŠerent shape of the input signals (sine vs square) for S3 soil and s3=5 kPa
Fig. 8. Shear wave velocities for inversion method (S1)
Fig. 9. Comparison of the diŠerent interpretation methods for the computation of shear waves velocities (S1–7 cm sample, f=10 kHz, w=28%, ua-uw=8000 kPa)
Fig. 10. Comparison of the diŠerent interpretation methods for the computation of shear waves velocities (S1–10 cm sample, f=10 kHz, w=28%, ua-uw=8000 kPa)
quires a more extensive analysis. Moreover, for granular and unsaturated soils, dispersion and attenuation phenomena appear. A frequency analysis to identify a group velocity and the phase velocities could integrate these phenomena whereas the basic analysis presented here only treats the faster wave between a source and a receiver. All the interferences, except for the near-ˆeld eŠects, are therefore ignored.
The excitation frequency has an eŠect on theRdratio
and therefore aŠects the shape of the output signal. The selection of a suitable frequency for the input pulse has received considerable attention in the literature (see for instance Arulnathan et al., 1998). Near-ˆeld eŠects may vanish, whereas the input frequency increases but interac-tions between the grains and wave (multiple scattering eŠect) may happen as a result. The range of frequencies used here is an acceptable compromise between these two antagonistic phenomena.
Consistent shear wave velocities deduced from the travel timesTinvandTFirst(corresponding to the inversion
and ˆrst arrival methods, described in Table 3) are ob-tained for all the specimens at all the excitation
frequen-cies and conˆning pressures used in the testing program (an example is given in Fig. 8 for the inversion method). These two travel times were more speciˆcally chosen be-cause of the experience noted in the literature, even though that question is still open for discussion. There is still no objective argument in favour of either time inter-val A-E or A-F.
RESULTS AND DISCUSSION
A commercial signal processing software is used to dis-play and process the input and output signal as well as the cross-correlations between the signals.
Figures 9 to 14 summarize the velocities assessed using the methods previously described, versus conˆning pres-sures at 10 kHz for soils S1, S2 and S3 and for samples of 7 cm and 10 cm length. Bender-extender element tests are performed up to 500 kPa. This stress level includes the range of interest of the subgrade layers of pavements.
Regarding the eŠect of the interpretation method, Figs. 9 to 14 show similar values of shear wave velocity when
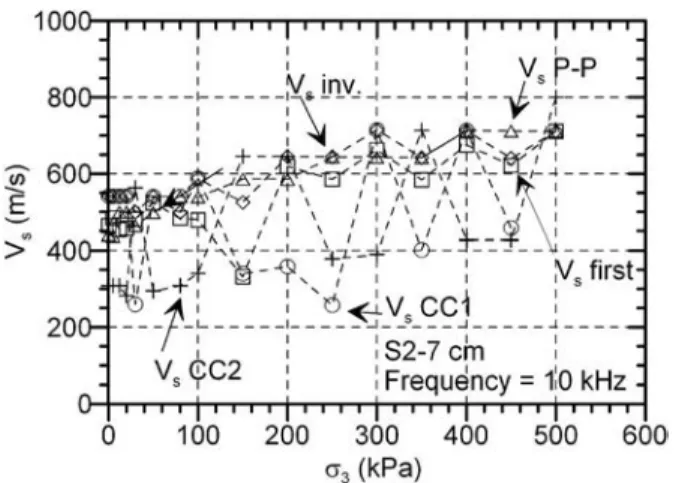
Fig. 11. Comparison of the diŠerent interpretation methods for the computation of shear waves velocities (S2–7 cm sample, f=10 kHz, w=11%, ua-uw=1500 kPa)
Fig. 12. Comparison of the diŠerent interpretation methods for the computation of shear waves velocities (S2–10 cm sample, f=10 kHz, w=15%, ua-uw=300 kPa)
Fig. 13. Comparison of the diŠerent interpretation methods for the computation of shear waves velocities (S3–7 cm sample, f=10 kHz, w=11%, ua-uw=60 kPa)
Fig. 14. Comparison of the diŠerent interpretation methods for the computation of shear waves velocities (S3–10 cm sample, f=10 kHz, w=11%, ua-uw=60 kPa)
the ˆrst arrival and peak-to-peak methods are used; however, no clear criteria can be estimated from the cross-correlation method. This discrepancy appears be-cause cross-correlation results depend mainly on the posi-tion of the maximum amplitude in the output signals; this means that if the ˆrst peak is not the maximum ampli-tude,Tccis shifted to the right, towards higher values of
time.
Without considering the cross correlation method, it is di‹cult to state which method among inversions and ˆrst de‰ections is the most appropriate. The trends of evolu-tion are similar for both methods, but the scattering of shear wave velocities depending on the interpretation methods is approximately ±50 m/s. For this reason, fur-ther analyses presented in this paper are based on the average value. By doing that, uncertainty is introduced regarding the precise value ofVs, but GrindoSonic
mea-surements aim at limiting that uncertainty.
Regarding the eŠect of the length of the sample, a com-parison of Figs. 9 and 10; 11 and 12; and 13 and 14 rev-eals that the results are more scattered when the length is
shorter. On the other hand, the length aŠects the meas-urement of the shear wave velocity in diŠerent ways: for soil S1, a higher shear wave velocity was measured on 10 cm samples although for S3 soils the higher shear wave velocity corresponded to 7 cm samples. There is no clear explanation for such variability. We found that speci-mens were relatively homogeneous and the material reconstitution was relatively repeatable. Probably this diŠerence is related to the problems of contact between the bender elements and samples (clearly it is more di‹cult to ensure a good contact in a cohesive sample than in a frictional sample), or anisotropy. Further research is needed to elucidate this point.
The velocities, determined as the mean values obtained from the inversion and the ˆrst arrival methods, are not aŠected by the frequency and the shape of the input sig-nal. Figure 15 summarizes the evolution of the shear wave velocities as a function of the conˆning pressures for diŠerent soil samples at 10 kHz.
Even if the bending and torsion frequencies obtained from GrindoSonic tests (Table 2) are lower than 10 kHz,
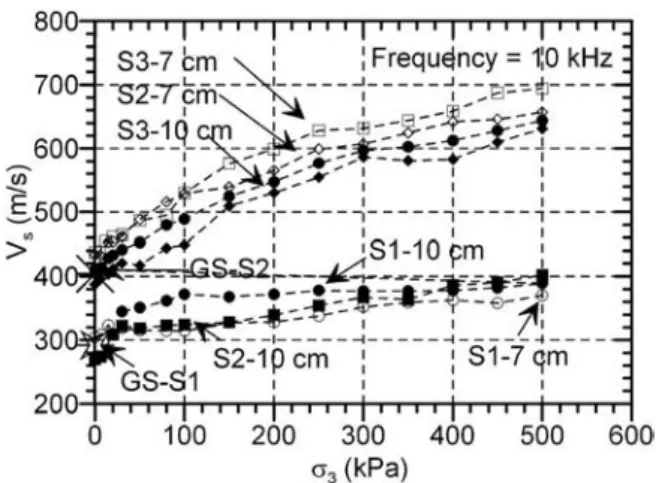
Fig. 15. Evolution of the shear wave velocities as a function of the conˆning pressures for all the soils at 10 kHz, and comparison with GrindoSonic measurements (GS)
Fig. 16. Void ratio versus conˆning pressure
Fig. 17. Saturation degree versus conˆning pressure
Fig. 18. Evolution of the compression wave velocities versus the con-ˆning pressures for all the soils at 10 kHz, and comparison with GrindoSonic measurements (GS)
consistent values of shear wave velocities were obtained for soils S1 and S2–7 cm (with a degree of saturation of 63z).
During isotropic compression, samples with a height of 7 and 10 cm for soils S1 and S3 showed similar void ratios and degrees of saturation (Figs. 15 and 16). As a result, the values of the shear wave velocities for the diŠerent heights are comparable. The range of shear wave veloci-ties for soil S1 is between 300 and 400 m/s and between 420 and 700 m/s for soil S3, depending on the conˆning pressure. On the other hand, the two S2 samples show diŠerences onVSsince these samples have been prepared
with diŠerent initial saturation degrees (63 and 85z), Fig. 17.
The two S2 samples prepared with diŠerent degrees of saturation (SRS2a=63z for the S2–7 cm and SRS2b= 85z
for S2–10 cm) show shear wave velocities that vary be-tween 280 and 400 m/s (for a water content equal to 15z and a suction pressure of 300 kPa), and between 420 and 640 m/s (for a water content equal to 11z and a suction pressure of 1500 kPa). The shear wave velocities obtained with the low saturated sample are 45z higher than the values obtained for the other sample (Fig. 15). Similar
results were also observed on granite and kaolin samples by Chun and Santamarina (2001). The measurements concerning the compression wave velocities show similar trends to the shear wave velocity (Fig. 18).
EVOLUTION OF SHEAR AND YOUNG MODULI ALONG ISOTROPIC PATHS FOR UNSATURATED INTERMEDIATE SOILS
A critical review of the literature shows that the shear and Young moduli of unbound granular materials mainly depends on the void ratioe and on the eŠective principal stressess?1ands?3. For isotropic loading stress paths, the
shear and Young moduli are expressed as a function of the void ratio and of the mean eŠective stress p? or the conˆning eŠective stresss?3such as (Hardin and Richart,
1963; Iwasaki and Tatsuoka, 1977; Biarez and Hicher, 1994; Lo Presti et al., 1997): G Gref =KG fG(e)
Ø
s?3 s?3, ref»
n (6)Table 4. Relations between G, E, e and s?3
Reference Modulus n f(e) Com-ments Hardin & Richart (1963) G 0.5
(2.17-e)2/(1+e)
Rounded grains Iwasaki & Tatsuoka (1977) G 0.4 Cuº1.8 Biarez & Hicher (1994) G, E 0.5 1/e All soils Lo Presti et al. (1997) G 0.45 1/e1.3 Sands
Fig. 19. Shear modulus vs net conˆning stress ˆtted using Eq. (8)
Fig. 20. Relationship between the modulus E0s3, G0s3, and suction E Eref =KE fE(e)
Ø
s?3 s?3, ref»
n (7) whereKE,KGand n are material constants,fG, E(e) afunc-tion of the void ratio (Table 4) andGref,Eref,s?3, ref. (1 kPa
for instance) parameters that normalizes the equations. As observed, the power n reported in literature, which characterizes the nature of grain-to-grain contacts, is close to 0.5. The deviation from the predictions of the Hertz's theory (n=1/3) can be explained by the nature of the contacts, which are not necessarily punctual (Dano and Hicher, 2002). For cohesive and frictional soils, the cementation of particles also makes the powern decrease, down to 0 if the cementation is strong.
For the intermediate unsaturated materials used in this study, the variation of Young and shear moduli as a func-tion of the conˆning stress depends on the sand fracfunc-tion (or clay content) and on the suction as follows: (i) the higher the percentage of sand, the higher the shear and compression wave velocities are (Figs. 15 and 18). Fur-thermore, sandy soils are more pressure sensitive than pure clay: indeed, when a binder like clay or cement-type materials is added to the granular skeleton, the contact area between the grains increases and the eŠect of the pressure is softened (Chang and Woods, 1987); (ii) On the other hand, it is well-known that matrix suction has an eŠect on the shear wave velocity (Wu et al., 1984), even in the drying-wetting process (Xu et al., 2008).
GrindoSonic tests allow for the measuring the shear compression wave velocities for zero conˆning stresses (Figs. 15 and 18). The shear and Young moduli derived from these measurements reveal that for unsaturated in-termediate materials, there are non-null moduli for zero conˆning stress. This eŠect is related to the capillary forces present in these materials. However, this result is in disagreement with Eqs. (6) and (7) for which zero moduli are expected for zero conˆning stress. To reproduce the eŠect of suction, Eqs. (6) and (7) could be modiˆed in two ways: (i) using a generalized eŠective stress analysis (Fleureau et al., 2003), or (ii) by consider-ing the suction eŠect on the modulus at zero stress and the eŠect of conˆning net stress separately (Caicedo et al., 2009). The second approach is used in this paper due to the di‹culties in the deˆnition of eŠective stresses in un-saturated soils. Then, to describe the variation of Young and shear moduli of intermediate unsaturated soils the following two power laws can be used:
G Gref fG(e)= G0s3 G0s3,ref +KG
Ø
s3 s3, ref»
n (8) E Eref fE(e)= E0s3 E0s3,ref +KEØ
s3 s3, ref»
n (9) Figure 20 shows the Young and shear moduli for zero conˆning vertical stress,E0s3,G0s3(normalized toe=0.45using the equations suggested by Iwasaki and Tatsuoka (1977) for shear modulus and Biarez and Hicher (1994) for Young modulus) as a function of suction, (ua-uw) for
all the soils of this study. As described, the modulus for zero total stress goes up as the suction increases. In fact, for zero total stress, the stiŠness of the material appears as a result of the capillary forces acting on the contacts between the granular particles. These results agree with the results presented by Fleureau et al. (2003), and Caice-do et al. (2009). Figure 19 shows that for zero suction, both the Young and shear moduli for zero conˆning stress go to zero; this value agrees with Eqs. (6) and (7). On the other hand, when suction increases, the modulus at zero conˆning stress trends to a maximum asymptotic value. This behaviour can be described using the follow-ing hyperbolic equations (Fig. 20):
Table 5. Constants used in Eqs. (11) and (12)
Soil Shear modulus kPa Young Modulus kPa
aG bG f(e) KG n aE bE f(e) KE n S1 0.99 3×10⁻³ (2.17-e)2/(1+e) 8.3 0.48 0.28 1×10⁻³ 1/e 38.3 0.48 S2 (w=11z) 43.3 0.43 79.9 0.46 S2 (w=15z) 7.0 0.49 18.5 0.48 S3 55.07 0.49 180.8 0.48
Fig. 21. Relationship between the component Ee=0.45-E0s3 of
Young modulus vs conˆning net stress s3-ua
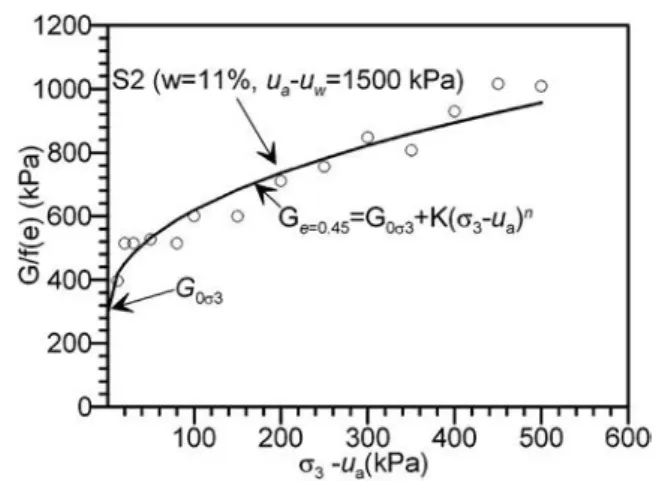
Fig. 22. Relationship between the component Ge=0.45-G0s3of shear
modulus vs conˆning net stress s3-ua
Fig. 23. Curves of modulus E0s3 upon matric suction for diŠerent
values of aEand bE G0s3= ua-uw aG+bG(ua-uw) , E0s3= ua-uw aE+bE(ua-uw) (10a, 10b) Figure 20 shows that using the previous equations, the Young and shear moduli of the intermediate soils used in this study can be described using the same equation. Par-ticularly, the similar behaviour against the suction of soils S2 and S1 could be explained because both soils have ˆne fraction prepared with the same soil (kaolin SPW).
Figures 21 and 22 show the evolution of the compo-nent of shear and Young modulus that vary with the con-ˆning net stress, (Ee=0.45-E0s3, andGe=0.45-G0s3vs.
s3-ua). Table 5 shows the values of the constants used to
ˆt the experimental results in to Eqs. (10), (11) and (12). The results of the exponentn vary between 0.43 and 0.49 for all the soils of this study, and for either Young or shear moduli; these values are similar to those presented in Table 4 corresponding to saturated unbound soils. This last result conˆrms that Eqs. (6) and (7) can be used for intermediate unsaturated soils but only to describe the eŠect of the net conˆning stress separately of the modulus for zero conˆning stress.
GfG(e)= ua-uw aG+bG(ua-uw) +KG(s3-ua)n (11) EfE(e)= ua-uw aE+bE(ua-uw) +KE(s3-ua)n (12)
As observed in Table 5, the exponentn is similar for all the soils studied; however, the constantK in Eqs. (11) and
Fig. 24. Component of Young modulus E-E0s3vs conˆning net stress
for diŠerent values of KEand n=0.5
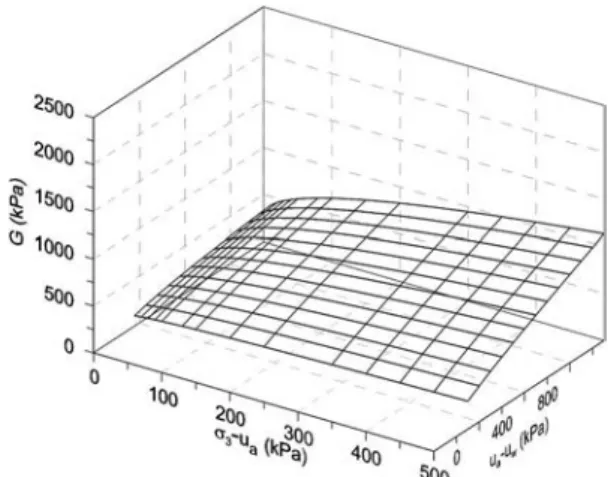
Fig. 25. Young modulus vs conˆning net stress s3-uaand suction ua
-uwfor soil S2
Fig. 26. Shear modulus vs conˆning net stress s3-uaand suction ua-
uwfor soil S2
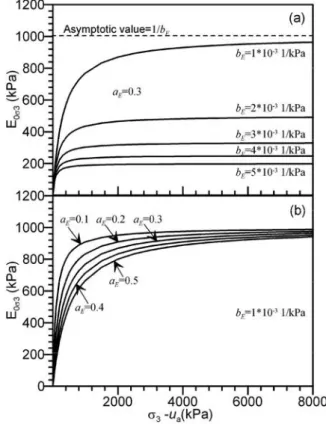
(12) depends on the type of soil and suction value. Figures 23 and 24 give an empirical interpretation of Eqs. (11) and (12). Figure 23 shows how the parametersaE, Gand
bE, Gwork to incorporate the eŠects of matric suction in
the shear and Young modulus at zero net stress: parameter 1/bE, Grepresents the asymptotic value of the
curves relating the shear and Young modulus vs. matric suction (Fig. 23a); the shape of these curves is controlled by the parameteraE, G(Fig. 23b).
Figure 24 shows how KE, G works to describe the
in-crease in the Young and shear modulus upon net stress. According to the results presented in this study, the parameterKE, Gdepends not only on the soil type but also
on its matric suction. Further studies considering diŠer-ent suction values for the same soil are required to evalu-ate the variation of KE, Gagainst suction. However, the
variation of Young and shear modulus vs. suction and net conˆning stress for S2 soils can be obtained using Eqs. (11) and (12) considering a linear variation ofKE, G
vs. suction as a ˆrst approximation. Figures 25 and 26 show the evolution of Young and shear modulus vs suc-tion and conˆning net stress. These ˆgures show how Eqs. (11) and (12) describe the diŠerent growing rate of
modulus when either the suction or the net conˆning stress remain constant.
SUMMARY AND CONCLUSIONS
Wave propagation velocities are experimentally deter-mined for S1, S2 and S3 soils subjected to isotropic stresses. The statically reconstituted samples tested, which are both cohesive and frictional, are mixtures of kaolin SPW and Missillac sand, which represent a sub-grade material.
The GrindoSonic test, based on the resonance fre-quency of the non-stressed sample, gives results for both the compression and shear wave velocities that are com-parable with bender-extender element measurements.
The bender-extender element technique, which is not yet standardised, has been used for wave velocity identiˆ-cation in the framework of a parametric study that in-cludes the eŠect of a) the length of the sample, b) the con-ˆning pressure, c) the nature of the soil, d) the frequency. This parametric study led to the following remarks con-cerning the use of bender element tests on intermediate compacted soils:
i. Even if near-ˆeld eŠects are systematically present, the eŠect of the length of the samples induce a dis-crepancy of lower than 15z on the wave velocities. ii. As expected, both shear and compression wave velocities increase with the conˆning pressure. However, the shear wave velocities increased at a lower rate for conˆning pressures higher than 250 kPa.
iii. Materials with a greater percentage of sand have higher shear wave velocity values.
iv. The test results show that a lower water content and higher suction pressure induces higher values for both the shear wave velocity and the Young's modulus values, for the same soil.
v. The range of frequency (5 to 10 kHz) gives consis-tent results, which are processed and interpreted us-ing ˆve diŠerent methods. In order to correctly get the shear wave velocity, the ``inversion'' and ``ˆrst
arrival'' method are recommended. The peak-to-peak method gives similar shear wave velocities for high excitation frequencies (8.3, 10 kHz); however, an overestimation of the propagation velocity is noted for lower frequencies.
vi. The results of the cross-correlation method are aŠected by the conˆning pressure and the input sig-nal frequency. Nevertheless, the peak-to-peak, and the cross-correlation interpretations may be used as indicators.
The results of the Young's and shear moduli have been interpreted in the framework of unsaturated soils. For zero net conˆning stress, non null Young and shear moduli appear as a result of the suction pressure for all the soils which contradicts the power law used to describe the evolution of these modulus as a function of the con-ˆning stress. Due to the di‹culties in the deˆnition of the generalized eŠective stress law for unsaturated soils, two relations are proposed to describe the evolution of the Young's and shear modulus in compacted intermediate soils. With these laws, the Young's and shear modulus go up depending on the increase in suction and the increase in the conˆning net stress, separately. Using this descrip-tion, the exponent of the power law for unsaturated soils fall within similar values to the exponent characteristic of the power law used for saturated soils in eŠective stress. It is acknowledged, however, that more tests are required to elucidate the variation of parameters KG and KE for
diŠerent soils and conditions.
ACKNOWLEDGEMENTS
The authors would like to thank all colleagues who have contributed to the experiments. The funding for this work was partially supported by COLCIENCIAS, which is highly appreciated.
REFERENCES
1) Allison, R. J. (1988): A nondestructive method of determining rock strength, Earth Surface Processes and Landforms, Wiley, New-York, 1–8.
2) Arulnathan, R., Boulanger, R. W. and Riemer, M. F. (1998): Anal-ysis of bender element tests, Geotechnical Testing Journal, 21(2), 120–131.
3) ASTM-D2845 Standard Test Method for Laboratory Determina-tion of Pulse Velocities and Ultrasonic Elastic Constants of Rock, 8.
4) Biarez, J. and Hicher P.-Y. (1994): Elementary Mechanics of Soil Behaviour-saturated and Remoulded Soils, Balkema.
5) Boulanger, R. W., Arulnathan, R., Harder, L. F., Torres, R. and Driller, M. (1998): Dynamic properties of Sherman Island peat, Journal of Geotechnical and Geoenviromental Engineering, ASCE, 124(1), 12–23.
6) Boussaid, K., Ferber, V., Garnier, J. and Thorel, L. (2003) Inter-mediate soils for physical modelling. International Symposium on Geotechnical Measurements and Modelling, Germany, 435–440. 7) Brignoli, E., Gotti, M. and Stokoe, K. H. (1996): Measurement of
shear waves in laboratory specimens by means of piezoelectric transducers, Geotechnical Testing Journal, 19(4), 384–397. 8) Caicedo, B., Coronado, O., Fleureau, J. M. and Gomes Correia,
A. (2009): Resilient behaviour of non-standard unbound granular
materials, Int. J. Road Materials and Pavement Design, 10(2), 287–312.
9) Chang, T. S. and Woods, R. D. (1987): EŠect of conˆning pressure on shear modulus of cemented sand. Developments in geotechnical engineering, Soil Structure Interaction, Elsevier, New York, 193–208.
10) Chun, C. and Santamarina, C. (2001): Unsaturated particulate materials particle level studies, Journal of Geotechnical and En-vironmental Engineering, 172(1), 84–96.
11) Dano, C. and Hicher, P. Y. (2002): Evolution of elastic shear modulus in granular materials along isotropic and deviatoric stress paths, Proc. 15th Engineering Mechanics Conference, ASCE, Columbia University, 6.
12) Dyvik, R. and Madshus, C. (1985): Laboratory measurement of Gmaxusing bender elements, Proc. Annual Convention, Advances
in the Art of Testing Soils under Cyclic Conditions, ASCE, Detroit, 186–196.
13) Fam, M. and Santamarina, J. C. (1997): A study of consolidation using mechanical and electromagnetic waves, G áeotechnique, 47(2), 203–219.
14) Fleureau, J.-M., Hadiwardoyo, S. and Gomes Correia, A. (2003): Generalised eŠective stress analysis of strength and small strains be-haviour of a silty sand, from dry to saturated state, Soils and Foun-dations, 43(4), 21–33.
15) Foti, S. (2000): Multistation methods for geotechnical characteriza-tion using surface waves, PhD thesis, Politecnico di Torino. 16) Fratta, D. and Santamarina, J. C. (1996): Waveguide device for
multi-mode, wideband testing wave propagation in soils, Geo-technical Testing Journal, ASTM, 19(2), 130–140.
17) Hardin, B. O. and Richart, F. E. (1963): Elastic wave velocities in granular soils, Journal of the Geotechnical Engineering Division, ASCE, 89(1), 33–65.
18) ISO 13320–1 (1999): Particle Size Analysis—Laser DiŠraction Methods—Part 1: General Principles.
19) Iwasaki, T. and Tatsuoka, F. (1977): EŠects of grain size and grad-ing on dynamic shear moduli of sands, Soils and Foundations, 17(3), 19–35.
20) Jovi ¾ci ác, V., Coop, M. and. Simic, M. (1996): Objective criteria for determining Gmaxfrom bender element tests, G áeotechnique, 46(2),
357–362.
21) Kawaguchi, T., Mitachi, T. and Shibuya, S. (2001): Evaluation of shear wave travel time in laboratory by bender element test, Proc. 15th Int. Conf. Soil Mechanics Foundations, Istanbul, 1, 155–158. 22) Kimura, J., Takemura, J., Hiro-oka, A. and Okamura, M. (1994): Mechanical behaviour of intermediate soils, Centrifuge 94, Balke-ma, Singapore, 13–24.
23) LCPC—Laboratoire Central des Ponts et Chauss áees (1992): R áeali-sation des remblais et des couches de forme, France, Fascicules I 98p et II, 102.
24) LCPC—Laboratoire Central des Ponts et Chauss áees (2003): Practi-cal manual for the use of soils and rocky materials in embankment construction, Guide technique. ISBN 2720831164, 60.
25) Leong, E. C., Yeo, S. H. and Rahardjo, H. (2005): Measuring shear wave velocity using bender elements, Geotechnical Testing Journal, ASTM, 28(5) 488–498.
26) Lings, M. L. and Greening, P. D. (2001): A novel bender/extender element for soil testing, G áeotechnique, 51(8), 713–717.
27) Lo Presti, D. C. F., Jamiolkowski, M., Pallara, O., Pisciotta, V. and Ture, S. (1995): Stress dependence of sand stiŠness, Proceed-ings of the 3rd International Conference on Recent Advances in Geotechnical Earthquake Engineering and Soil Dynamics, St Louis Missouri, 71–76.
28) Lo Presti, D. C. F., Jamiolkowski, M., Pallara, O., Cavallararo, A. and Pedroni, S. (1997): Shear modulus and damping of soils, G áeotechnique, 47(3), 603–617.
29) Lohani, T. N., Imai, G. and Shibuya, S. T. (1999): Determination of shear wave velocity in bender element test, Proceedings of the second International Conference on Earthquake Geotechnical En-gineering, Lisbon, 1, 101–106.
analysis of in situ S-wave measurements, Proc. of the 12th Interna-tional Conference on Soil Mechanics and Foundation Engineering, Rio de Janeiro, 1, 277–280.
31) Mohsin, A. K. M. and Airey D. W. (2003): Automating Gmax
meas-urement in triaxial test. Deformation characteristics of geomateri-als, Proceedings oh the 3nd International Symposium ISLyon, Balkema, Lyon, 73–80.
32) Murillo, C., Thorel, L. and Caicedo, B. (2009a): Spectral analysis of surface waves technique to evaluate the shear wave velocity in centrifuge models, J. Applied Geophysics, June, 68, 135–145. doi: 10.1016/j.jappgeo.2008.10.007.
33) Murillo, C., Caicedo, B. and Thorel, L. (2009b): A miniature fall-ing weight for non destructive characterization of soils. Technical Note, Geot. Testing J., ASTM, 32(5), 465–474.
34) Rossato, G. Ninis, N. L. and Jardine, R. J. (1992): Properties of some kaolin based model clay soils, Geotechnical Testing Journal, 15(2), 166–179.
35) Sanchez-Salinero, I., Rosset, J. M. and Stokoe, K. H. (1986): Ana-lytical studies of body wave propagation and attenuation, Civil En-gineering Department University of Texas at Austin, GR86–15, Texas.
36) Scholey, G. K., Frost, J. D. and Jamiolkowski, M. (1995): A review of instrumentation for measuring small strains during triaxial
test-ing of soils specimen, Geotechnical Testtest-ing Journal, 18(2), 137–156.
37) Shariˆpour, M., Dano, C. and. Hicher, P.-Y. (2004): Wave veloci-ties in assemblies of glass beads using bender—extender elements, 17th Engineering Mechanics Conference, ASCE, University of Delaware, Newark, CD-ROM.
38) Shirley, D. J. and Hampton, L. D. (1977): Shear wave measure-ments in laboratory sedimeasure-ments, J. Acoust. Soc. Am., 63(2), 607–613.
39) Spinner, S. and TeŠt, W. E. (1961): A method for determining mechanical resonance frequencies and for calculating elastic moduli from these frequencies, American Society Testing Material Proc., 61, 1221–1238.
40) Viggiani, C. and Atkinson, J. H. (1995): Interpretation of bender element tests, G áeotechnique, 45(1), 149–154.
41) Wu, S. Gray, D. H. and Richart, Jr. (1984): Capillary eŠects on dy-namic modulus of sands and silts, J. Geotechnical Engineering, ASCE, 110(9), 1188–1203.
42) Xu, J., Ng, C. W. W. and Yung, S. Y. (2008): Drying and wetting eŠects on shear wave velocity of an unsaturated soil, Unsaturated Soils; Advances in Geo-engineering, (eds. by Toll et al.), Taylor and Francis, 525–530.