http://www.scirp.org/journal/ajac ISSN Online: 2156-8278
ISSN Print: 2156-8251
DOI: 10.4236/ajac.2017.89042 Sep. 19, 2017 582 American Journal of Analytical Chemistry
Simple LC Isocratic Methods Development,
Validation, and Application in the Analysis of
Poor Quality Antimalarial Medicines
Védaste Habyalimana
1,2, Jérémie Kindenge Mbinze
3, Achille Loconon Yemoa
4,
Justin-Léonard Kadima Ntokamunda
5, Philippe Hubert
1,
Roland Marini Djang’eing’a
11Laboratory of Pharmaceutical Analytical Chemistry, CIRM, University of Liège (ULg), Liège, Belgium 2Rwanda Biomedical Center/Medical Procurement and Production Division, Kigali, Rwanda
3Faculty of Pharmaceutical Sciences, University of Kinshasa, Kinshasa XI, Democratic Republic of Congo 4Faculty of Health Sciences, School of Pharmacy, University of Abomey Calavi, Cotonou, Benin
5School of Medicine and Pharmacy, University of Rwanda, Butare, Rwanda
Abstract
Liquid chromatographic methods in isocratic mode for the analysis of poor quality medicines are privileged due to their simplicity and facility in methods development. They are generally fast; do not need to be re-equilibrated be-tween sample injections; have larger flexibility with acceptable changes on different column dimensions; and are applicable to LC systems equipped with simple or high developed pumps. In this study, we focused on developing simple isocratic methods using classical mobile phase composed by methanol and ammonium formate buffer for the analysis of most common antimalarial medicines marketed in malaria endemic countries and susceptible of being counterfeit/falsified, substandard and degraded. The selected medicines were quinine and related cinchona alkaloids in tablets and injectable forms; mether/lumefantrine tablets; and artemisinin compounds (arteether, arte-mether, and artesunate) in injectable forms. The current methods were de-veloped thanks to simple methodological approach consisting in sequential isocratic runs through adjustment or adaptation of existing methods to obtain optimal analytical conditions without complex design of experiments that might be long and costly. Then, the new methods presented shorter analysis time; allowed increase of sample analysis throughput; and obviously con-sumed little mobile phase solvents on classical analytical columns: 50 - 250 mm of length (L), 4.6 mm of internal diameter (I.D.), and 3.5 - 5.0 µm of par-ticle size (dp).
How to cite this paper: Habyalimana, V., Mbinze, J.K., Yemoa, A.L., Ntokamunda, J.-L.K., Hubert, P. and Djang’eing’a, R.M. (2017) Simple LC Isocratic Methods De-velopment, Validation, and Application in the Analysis of Poor Quality Antimalarial Medicines. American Journal of Analytical Chemistry, 8, 582-603.
https://doi.org/10.4236/ajac.2017.89042
Received: July 18, 2017 Accepted: September 16, 2017 Published: September 19, 2017 Copyright © 2017 by authors and Scientific Research Publishing Inc. This work is licensed under the Creative Commons Attribution International License (CC BY 4.0).
http://creativecommons.org/licenses/by/4.0/
DOI: 10.4236/ajac.2017.89042 583 American Journal of Analytical Chemistry
Keywords
Antimalarial Medicines, Liquid Chromatography, Isocratic Mode, Validation, Poor Quality Medicines
1. Introduction
Malaria is a life-threatening disease caused by Plasmodium parasites transmitted to people through the bites of infected female Anopheles mosquitoes (called malaria vectors). It is usually found in tropical and subtropical climates where the parasites live [1] [2]. According to the latest estimates of the World Health Organization (WHO), released in end of 2016, there were 212 million cases of malaria in 2015 and 429,000 deaths. The WHO African Region is the most af-fected by that disease and its consequences [1]. Thus far, the prevention of mala-ria involves among others the use of “insecticide-treated mosquito nets” and “indoor residual spraying” as effective vector control mechanisms, and the use of “antimalarial medicines” in disease treatment or chemoprophylaxis. Concerning medicines, they should always meet their quality specifications in order to give guarantee on their safety and efficacy during their shelf lives. Otherwise, any failure to the required quality standards may lead to serious public health con-cerns such as failure in disease treatment, development of drug resistance, in-crease of morbidity and mortality, etc.
Indeed, poor quality medicines constitute a harmful threat to the public health worldwide, particularly in under-resourced countries [3] [4] [5]. Newton et al. [3]
distinguished three categories of poor quality medicines: (i) Counterfeit/falsified medicines which are illicit products maliciously produced and distributed; (ii) Substandard also called out-of-specification “OOS” products which are genuine products generally produced in poor manufacturing conditions; and (iii) De-graded medicines which are products improperly stored, and spoiled. Hence, there is need to develop fast, effective, simple and transferable analytical me-thods to drug quality control laboratories in developing countries, and therefore reinforce their capacity in detecting and fighting against the spread of those harmful products.
In this context, we have developed simple isocratic methods for the analysis of curative antimalarial medicines most used in Rwanda i.e. artemether/lumefantrine, artesunate, and quinine with related other compounds that should be associated with them in case of counterfeiting, substandard, or degradation. This is the case for example of quinine and related cinchona alkaloids such as cinchonine, cin-chonidine, quinidine, and dihydroquinine, together with resorcinol most found in quinine resorcin formulations, etc. Moreover, we added arteether to the group of artemisinin derivatives that should be easily interchanged with artemether and artesunate due to their closer chemical structure similarity (see Figure 1).
DOI: 10.4236/ajac.2017.89042 584 American Journal of Analytical Chemistry Figure 1. Molecular structures of the studied analytes.
DAD was selected as gold standard for chemical separation, quantification and identification of simple and complex samples. This technique is highly used in pharmaceutical analysis, very sensitive and accurate; it gives results in relatively good-time, generally within approximately 10 and 15 minutes for isocratic me-thods, and within less than 60 minutes for gradient methods; and has a great ca-pacity of automation [5] [6].
The targeted methods were privileged for their simplicity, shorter analysis time, and higher analysis sample throughput; they were developed thanks to the adjustment (fine-tuning) or adaptation of other existing methods in fewer expe-rimental runs without passing through design of experiments that are informa-tion fullness however with high cost and relatively long time consuming.
Then, after optimizing the new methods, they must be validated according to the International Conference on Harmonization “ICH-Q2(R1)” guidelines [7], and we used the total error strategy based on random and systematic errors cor-responding to the precision + trueness, and using accuracy profiles as decision tool on the fitness of the methods for their intended use within given acceptable limits [8] [9] [10] [11].
Finally, in the frame of reducing the analysis time, we transferred the methods from long to shorter analytical columns in the classical range of 250 mm and 50 mm of length (L) × 4.6 mm of internal diameter (ID), and 5.0 to 3.5 µm of the particle size (dp) before use in routine analysis of different medicines especially when detecting counterfeit formulations.
DOI: 10.4236/ajac.2017.89042 585 American Journal of Analytical Chemistry
2. Materials and Methods
2.1. Materials
Arteether (100%), Artemether (100%), Artesunate (>97%), and Lumefantrine (100%) were purchased from Sensa Pharm (Lanchester, UK), and quinine sulfate (99.0%) from Fagron N.V. (Waregem, Belgium), quinine dihydrochloride (100.8%) from Molekula Limited (Dorset, UK), Hydrochloric acid (37%) and ammonium formate (98.1%) from VWR International BVBA (Leuven, Bel-gium), Methanol LC grade from Avantor Performance Materials B.V. (Deventer, The Netherlands), the Ultrapure Water was produced with a Milli-Q Plus 185 water purification system (Millipore, Billerica, MA, USA), and various samples of quinine tablets (300 mg), quinine for injection (300 mg/mL and 600 mg/mL) as labeled on the primary packaging, artemether/lumefantrine tablets (20 mg/ 120mg and 80 mg/480mg), and artesunate powder for injection (60 mg) were randomly collected from Rwanda, Democratic Republic of Congo, and Benin.
2.2. Methods Development Strategy and Validation
Methods in isocratic mode were developed by simple systematic approach, and by adaptation or adjustment of other methods on similar compounds. These methodologies have an advantage of reducing the number of experiments to be carried out without going through complex design of experiments (DoEs). The strategy of simple systematic approach was based on sequential isocratic runs and optimization of the most promising results, while the methods adaptation or adjustment was based on other methods found in literature (scientific publica-tions) on the same analytes, and tested with adequate adaptations or adjustments to have the desired chromatographic conditions using our preferred mobile phase composed by methanol and ammonium formate buffer.
2.3. Instrumental and Software
2.3.1. LC EquipmentThe methods were developed in Belgium on a Waters 2695 Alliance HPLC Se-paration Module coupled to Waters 2996 photodiode array (PDA) detector from Waters Corporation (Milford, MA, USA) piloted with Empower 2.0 software (Waters Corporation).
Different chromatographic columns packed with C18 or C8 stationary phases, in different dimensions (L: 50 mm to 250 mm, ID: 4.6 mm; dp: 3.5 µm and 5 µm) were used during the methods development and geometric transfer as de-scribed in the experimental part.
2.3.2. Software
Empower 2.0 software (Waters Corporation, MA, USA) for Windows was used to control the Waters Alliance HPLC system, to record the signals from the de-tector and interpret the generated chromatograms. Then, different optimum levels for geometric transfer from columns to others were calculated using
DOI: 10.4236/ajac.2017.89042 586 American Journal of Analytical Chemistry
HPLC Calculator v3.0 developed by Guillarme et al. [12], and the accuracy profiles as well as the statistical calculations including the validation results and uncertainty estimates were obtained thanks to e-noval® V3.0 software
(Arlenda, Belgium).
2.4. Preparation of Sample Solutions
2.4.1. Sample Solutions for Method Development for the Analysis of Arteether, Artemether, Artesunate and Quinine in Different Injectable Formulations
In the first step, approximately 10.0 mg of quinine base from quinine dihy-drochloride chemical reference substance (CRS) were dissolved with methanol in 100.0 mL volumetric flask; and in the second step, this solution was used to dissolve and dilute approximately 10.0 mg of each of the arteether, artemether and artesunate reference substances weighed in a 2.0 mL volumetric flask. This was the final working solution annotated “Solution Q3A” to be injected in the chromatographic system. It contained approx. 100 µg mL−1 of quinine, and 5000
µg mL−1 of the three artemisinin derivate compounds.
2.4.2. Sample Solutions for Method Adaptation for the Analysis of Quinine, Resorcinol, Quinidine, Dihydroquinine and Other Cinchona Alkaloids in Tablets and Injectable Formulations
The working sample solutions were prepared from two real medicines contain-ing the studied analytes (i.e. quinine, dihydroquinine, quinidine, cinchonine, cinchonidine, and resorcinol) manufactured by Sanofi-Winthrop Pharma (Se-negal) and Wintac Ltd. (India).
Each sample solution was diluted with purified water to have a final working solution containing approximately 100 µg mL−1 of quinine alkaloid which is the
main active ingredient, and the concentrations of other cinchona alkaloids to-gether with resorcinol were subsequently reduced according to the product for-mulation as stated on the labeled composition. For example, one sample of am-poule 4 mL was stated to contain per mL: 96.10 mg of quinine resorcinol dihy-drochloride, 2.55 mg of quinidine resorcinol dihydihy-drochloride, 0.68 mg of cin-chonine resorcinol dihydrochloride, 0.67 mg of cinchonidine resorcinol dihy-drochloride, and water for injection BP q.s. Then, to have final working solu-tions containing approx. 100 µg mL−1 of quinine resorcinol dihydrochloride, 520
µL of quinine resorcine injection sample were diluted in 500 mL volumetric flasks before they were injected in the chromatographic system for analysis. Note that the content of resorcinol was not mentioned on both samples, but the product was well identified as shown later in results. Then, to identify all six analytes, we injected separately in the LC system single solutions of quinine ref-erence substance (100 µg mL−1 in purified water) containing dihydroquinine
(<10%), cinchonine CRS (50 µg mL−1 in purified water), cinchonidine CRS (50
µg mL−1 in purified water), quinidine CRS (50 µg mL−1 in purified water), and
DOI: 10.4236/ajac.2017.89042 587 American Journal of Analytical Chemistry
2.4.3. Sample Solutions for Method Adjustment for the Analysis of Artemether/Lumefantrine in Tablet Formulations
Reference to the USP, International and European pharmacopoeias allowable adjustments in chromatographic systems [13] [14] [15], our previously validated method for the analysis of artemether/lumefantrine in tablets forms [16] was adjusted in order to reduce the analysis time and increase the sample analysis throughput. The following solutions were prepared:
Standard solutions:
Dissolve accurately weighed quantities of artemether and lumefantrine refer-ence substances in appropriate volumetric flask with acidified methanol by phosphoric acid (0.2% phosphoric acid in methanol, w/v) to obtain 200 and 1200 µg mL−1 of both analytes respectively. Prepare two independent standard
solutions for system suitability testing and analysis.
Sample solutions:
Different samples randomly collected using blind sampling techniques from Rwanda (n = 13), D.R. Congo (n = 9), and Benin (n = 1 suspected counterfeit) were prepared for analysis in the frame of quality assessment of artemisinin-based combination therapy (ACT) medicines marketed in the three countries.
The sample solutions were prepared by weighing and powdering 20 tablets; and transferring a quantity of each sample powder containing approximately 20 mg of artemether and 120 mg of lumefantrine accurately weighed in 100.0 mL vo-lumetric flask, and dissolving the sample with the acidified methanolic solution (phosphoric acid 0.2%, w/v) used in the preparation of artemether/lumefantrine standard solutions by mechanical shaking on vortex during 1 minute, and dilu-tion to volume with the same solvent to obtain approx. 200 and 1200 µg mL−1 of
both analytes respectively. Prepare three independent sample solutions per batch, and filter each solution through 0.45 µm filter before they are injected in the chromatographic system.
2.4.4. Sample Solutions for Method Validation and Routine Analysis for Artesunate Powder for Injection
a) Sample solutions for method validation
They consisted of three concentration levels for calibration standards (CS), and five concentration levels for validation standards (VS). The required solu-tions were prepared as described in section 3.2.
b) Sample solutions for routine analysis
The samples of artesunate powder for injection were prepared by dissolving with methanol LC grade approximately 10.0 mg of the sample in 2.0 mL volu-metric flasks and completing to volume with the same solvent to obtain around 5000 µg mL−1 final solutions against artesunate reference substance prepared at
the same concentration level with the same solvent. Three independent sample solutions were prepared, and two independent reference solutions for system suitability testing and sample analysis.
DOI: 10.4236/ajac.2017.89042 588 American Journal of Analytical Chemistry
3. Experimentation
3.1. Simple Isocratic Methods Development by Adaptation or
Adjustment and Sequential Isocratic Runs with Fine-Tuning
Simple isocratic methods for the analysis of (i) quinine and artemisinin deriva-tives (arteether, artemether, and artesunate), (ii) quinine resorcin and major cinchona alkaloids (cinchonine, cinchonidine, quinidine, and dihydroquinine), and (iii) artemether/lumefantrine in different pharmaceutical forms were devel-oped through sequential isocratic runs with optimization (fine-tuning), and by simple adaptation or adjustment of other methods in order to reduce the analy-sis time, improve the sample treatments conditions, and use of our preferred mobile phase composed by methanol and ammonium formate buffer which is not expensive and that can be transferred to LC/MS for advanced analysis whenever needed for the identification of unknown compounds. Moreover, iso-cratic methods have an advantage of flexibility to tolerable changes with column dimensions, flow rate of the mobile phase, organic modifier proportion, etc. that can be done without need of the methods revalidation [13] [14] [15].
3.1.1. Development of a Generic Method for the Analysis of Quinine, Arteether, Artemether and Artesunate in Injectable Formulations
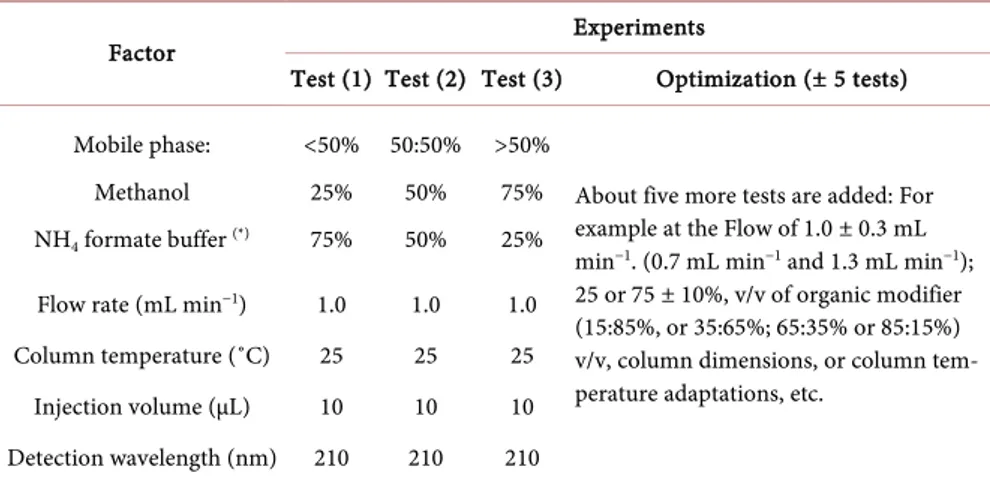
The development of a generic isocratic method for the analysis of quinine, ar-teether, artemether and artesunate was done through a simplified systematic ap-proach based on sequential isocratic runs with optimization (fine-tuning) de-scribed in Table 1, using classical analytical columns and mobile phase com-posed by methanol and ammonium formate buffer.
The first three experiments helped to know the trend of peak separation of the four analytes either at higher or lower proportion of the organic modifier, and therefore have an idea on which parameter to make changes in the optimization phase. For example, if the best separation of the analytes is at the lower level of methanol (i.e. at Test 1: 25/75% MeOH/Buffer, v/v ), one can plan for two addi-tional tests at 25% ± 10% of methanol (i.e. Test 4: 15/85% and Test 5: 35/65%
Table 1. Simplified sequential isocratic experiments.
Factor Experiments
Test (1) Test (2) Test (3) Optimization (± 5 tests) Mobile phase: Methanol NH4 formate buffer (*) <50% 25% 75% 50:50% 50% 50% >50% 75% 25%
About five more tests are added: For example at the Flow of 1.0 ± 0.3 mL min−1. (0.7 mL min−1 and 1.3 mL min−1);
25 or 75 ± 10%, v/v of organic modifier (15:85%, or 35:65%; 65:35% or 85:15%) v/v, column dimensions, or column tem-perature adaptations, etc.
Flow rate (mL min−1) 1.0 1.0 1.0
Column temperature (˚C) 25 25 25 Injection volume (µL) 10 10 10 Detection wavelength (nm) 210 210 210
DOI: 10.4236/ajac.2017.89042 589 American Journal of Analytical Chemistry
MeOH/Buffer, v/v), and then continue the adjustment of the method with the flow rate changes at 0.7 mL min−1 or 1.3 mL min−1 if needed (Test 6),
tempera-ture changes at 35˚C (Test 7), or columns dimensions (Test 8: L = 50 - 250 mm; ID: 4.6 mm; dp: 3.5 or 5 µm) in order to have the desired chromatographic se-paration within ≤10 minutes of run time generally preferred for isocratic me-thods.
3.1.2. Development of Isocratic Method for the Analysis of Quinine, Resorcinol, Dihydroquinine and Major Cinchona Alkaloids
The analysis of quinine in different pharmaceutical forms is generally done with other cinchona alkaloids especially dihydroquinine that should not be more than 10% of content, cinchonidine not more than 5%, and any other related substance such as cinchonine, quinidine, etc. at not more than 2.5% calculated by the area percentage method to quinine peak area [17].
Reference to other existing methods covering almost the same analytes [18] [19], we optimized a rapid isocratic method for the analysis of quinine, resorci-nol, cinchonine, cinchonidine, quinidine, and dihydroquinine by adapting these methods to our analytes and changing the earlier mobile phase to methanol and ammonium formate buffer. Resorcinol was added to the list of the studied ana-lytes, as being one of the key ingredients in quinine resorcin injection solutions widely used in different malaria endemic countries.
The method was optimized on a Zorbax SB-C8 (dp 3.5 µm) column, (150 mm × 4.6 mm ID) maintained at 35˚C, applying as mobile phase an isocratic mixture of methanol and 10 mM ammonium formate buffer (adjusted to pH 2.8 with formic acid or 6 N hydrochloric acid) (40:60, v/v) for the analysis of quinine tablets containing generally quinine sulfate, dihydroquinine, and cinchonidine; and (30:70, v/v) for the analysis of quinine resorcin injection containing the six analytes (quinine, resorcinol, dihydroquinine, cinchonine, cinchonidine, and quinidine), at a flow rate of 1 mL min−1. The sample solutions were thermostated
at 15˚C, introduced in the separation system at 10 µL injection volumes, and monitored at 230 nm.
3.1.3. Adjustment of the Method for Analysis of
Artemether/Lumefantrine in Tablet Formulations
Our former analytical method for the analysis of artemether/lumefantrine in tablet formulations [16] was readjusted to improve the analysis time (run time), and sample treatment by increasing the capacity of methanol in dissolving lu-mefantrine. Hence, to improve the analysis time, we slightly increased the pro-portion of methanol in the mobile phase and the run time reduced; then, to in-crease the capacity of methanol in dissolving lumefantrine, we slightly inin-creased the acidity power by using methanol acidified with phosphoric acid 0.2% (w/v) instead of 0.1% (w/v) previously used.
The method was adjusted on a Zorbax 80Å Extend-C18, 100 mm × 4.6 mm (ID), (dp: 3.5 µm) chromatographic column at a flow rate of 0.7 mL min−1 of
DOI: 10.4236/ajac.2017.89042 590 American Journal of Analytical Chemistry
at 25˚C, injecting 6 µL of the sample and reference solutions, and recording the chromatographic data at 210 nm. The dissolution of lumefantrine was improved by slight increases of the phosphoric acid in methanol from the original content of 0.1% to 0.2% (w/v) that is enough to dissolve the targeted analyte by hand shaking or vortex easily.
3.2. Validation of the Method for Analysis of Artesunate Powder
for Injection
The generic isocratic method for the analysis of quinine and artemisinin deriva-tives was validated for specific analysis of artesunate powder for injection. The calibration and validation standard solutions were prepared by dissolving arte-sunate CRS in methanol in order to have the following solutions.
Calibration standards
Level 1 (60%): 3000 μg mL−1 of artesunate (approx. 15.0 mg in 5.0 mL vol. flask);
Level 3 (100%): 5000 μg mL−1 of artesunate (approx. 10.0 mg in 2.0 mL vol. flask);
Level 5 (140%): 7000 μg mL−1 of artesunate (approx. 14.0 mg in 2.0 mL vol. flask). Validation standards
The validation standards (VS) were prepared with artesunate CRS and me-thanol as solvent. There is no sample matrix as the studied product is a pure raw material without any excipient, and the concentration level is higher due to the weak absorption of the UV light by artesunate.
The VS were prepared to have five different concentration levels, three series per day, during three validation days.
Level 1 (60%): 3000 μg mL−1 of artesunate (approx. 15.0 mg in 5.0 mL vol. flask);
Level 2 (80%): 4000 μg mL−1 of artesunate (approx. 20.0 mg in 5.0 mL vol. flask);
Level 3 (100%): 5000 μg mL−1 of artesunate (approx. 10.0 mg in 2.0 mL vol. flask);
Level 4 (120%): 6000 μg mL−1 of artesunate (approx. 12.0 mg in 2.0 mL vol. flask);
Level 5 (140%): 7000 μg mL−1 of artesunate (approx. 14.0 mg in 2.0 mL vol. flask).
To sum up, three independent solutions (n = 3) were prepared per each con-centration level (c = 3 for CS, c = 5 for VS), and all these preparations were re-peated for three days corresponding to three series (s = 3). The method was va-lidated on a C18, 150 × 4.6 mm, dp: 5 µm column in order to allow covering the widest range of classical HPLC columns’ sizes and allowable changes.
Then, for routine analyses, two independent reference solutions for system suitability testing and sample analysis were prepared at 5000 µg mL−1i.e. Level 3
(100%) against three independent sample solutions per batch was prepared at the same concentration level.
3.3. Sampling and Application of the Methods on Real Samples
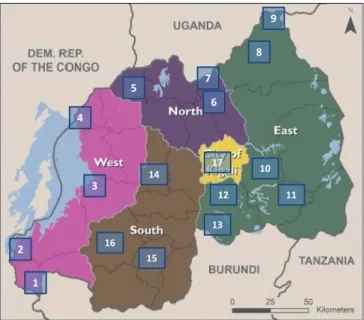
Seventeen sampling sites mapped in Figure 2 were defined for collecting differ-ent antimalarial medicines found on the list of national essdiffer-ential medicines for Rwanda [20] [21] [22]. The targeted sampling points were hospitals and phar-macies in public and private sectors, and tentatively illicit vendors if available, located in strategic cities, suburbs, and Rwanda’s borders.
DOI: 10.4236/ajac.2017.89042 591 American Journal of Analytical Chemistry
The sampling sites were selected on the basis of areas known to have intensive commercial activities, border areas with other countries (Burundi in South, Tanzania in East, Uganda in North, and D.R. Congo in West) where the risk of illegal trade of goods including medicines is relatively higher and therefore the possibility of entry of poor quality medicines especially counterfeit/falsified and substandard. All samples were selected randomly by considering batch numbers, manufacturers, strength, and dosage forms (tablets, capsules, injectables, etc.).
Moreover, other samples of antimalarial medicines were received from Kin-shasa (university of KinKin-shasa, D.R. of Congo) and Cotonou (university of Ab-omey Calavi, Benin) in the frame of scientific collaboration including the Uni-versity of Liège (Belgium) in the project of fighting against counterfeit medicines.
4. Results and Discussions
4.1. Adaptation of the Method for the Analysis of Quinine,
Resorcinol and Major Cinchona Alkaloids in Different
Pharmaceutical Forms
A simple isocratic method for the analysis of quinine, resorcinol, and major cinchona alkaloids in different pharmaceutical forms was optimized thanks to the adaptation of other methods. In fact, from literature search, we identified two interesting references [18] [19] from which we did necessary adaptations with our regular mobile phase composed by methanol and ammonium formate buffer. Hence, we decided to run some experiments around the practical condi-tions of the two reference methods as summarized in Table 1; and we got
Figure 2. Strategic sampling sites on the map of Rwanda (Western Province: (1) Bugara-ma, (2) Kamembe, (3) Karongi/Kibuye, (4) Rubavu/Gisenyi; Northern Province: (5) Mu-sanze/Ruhengeri, (6) Gicumbi/Byumba, (7) Gatuna; Eastern Province: (8) Nyagatare, (9) Kagitumba, (10) Rwamagana, (11) Ngoma/Kibungo, (12) Nyamata/Bugesera, (13) Ruhu-ha/Ngenda; Southern Province: (14) Muhanga/Gitarama, (15) Huye/Butare, (16) Nya-magabe/Gikongoro; and Kigali City: (17) The Capital).
11 10 1 2 3 4 5 6 7 8 9 12 13 14 15 16 17
DOI: 10.4236/ajac.2017.89042 592 American Journal of Analytical Chemistry
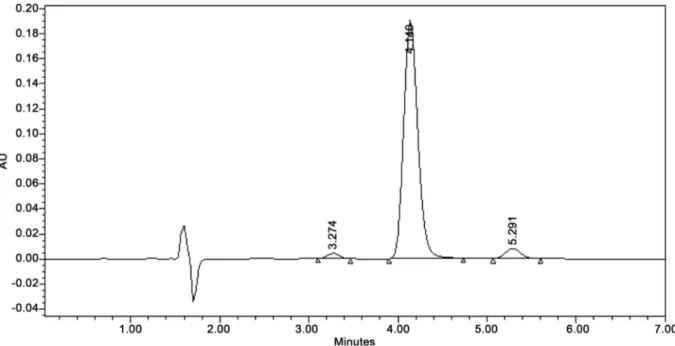
satisfactory results at 10 mM ammonium formate buffer pH 2.8 and methanol (60:40, v/v) as illustrated in Figure 3 for the analysis of quinine, dihydroquinine and cinchonidine generally tested in quinine tablet forms [17]; and for the anal-ysis of quinine, resorcinol, cinchonine, cinchonidine, quinidine, and dihydro-quinine in injectable forms, the optimum proportions of mobile phase was found at 70:30, v/v for 10 mM ammonium formate buffer pH 2.8 and methanol, respectively. Figure 4 illustrates the case of simultaneous separation of the six analytes in quinine resorcin solutions.
This method was also geometrically transferred to shorter analytical columns in order to reduce the analysis time and therefore increase the sample analysis throughput as well as reducing the consumption of the mobile phase.
4.2. Adjustment of the Method for the Analysis of
Artemether/lumefantrine in Tablet Forms
Our earlier developed method in isocratic mode for the analysis of artemether and lumefantrine in tablet forms [16] was adjusted by improving the dissolution capacity of methanol on lumefantrine and therefore allowing to speed up the process of sample preparation by acidifying methanol at 0.2% w/v with phosphoric acid. Indeed, lumefantrine is practically insoluble in water, soluble in dichloro-methane and chloroform, and slightly soluble in methanol but we privileged to dissolve it with the acidified methanol to avoid the use of chloroform or dichlo-romethane which are very chromophorous and capable of giving an additional peak in the chromatogram that would compete with lumefantrine and therefore reduce the detection of artemether which does not absorb well the UV light.
Figure 3. Isocratic method for the analysis of quinine and major cinchona alkaloids in tablet pharmaceutical forms. Expe-rimental conditions: Column: Zorbax C8, 150 × 4.6 mm, dp: 5 µm; Flow: 1 mL min−1; T˚: 35˚C; λ = 230 nm; Isocratic
elu-tion with methanol and 10 mM ammonium formate buffer pH 2.8 (40:60, v/v). Eluelu-tion order: Cinchonidine (≈3.274 min.), quinine (≈4.140 min.), dihydroquinine (≈5.291 min.).
DOI: 10.4236/ajac.2017.89042 593 American Journal of Analytical Chemistry Figure 4. Isocratic method for the analysis of quinine resorcin and major cinchona alkaloids in injectable solutions. Expe-rimental conditions: Column: Zorbax C8, 150 × 4.6 mm, dp: 5 µm for chromatogram (a), and Zorbax C8, 50 × 4.6 mm, dp: 3.5 µm for chromatogram (b); Flow: 1 mL min−1; T˚: 35˚C; λ = 230 nm; Isocratic elution with methanol and 10 mM
am-monium formate buffer pH 2.8 (30:70, v/v). Elution order (identic to both chromatograms): i) Chromatogram (a): Resor-cinol (≈2.844 min.), cinchonine (≈4.513 min.), cinchonidine (≈5.504 min.), quinidine (≈6.170 min.), quinine (≈8.095 min.), dihydroquinine (≈11.226 min.); ii) Chromatogram (b): Resorcinol (≈1.007 min.), cinchonine (≈1.835 min.), cin-chonidine (≈2.272 min.), quinidine (≈2.615 min.), quinine (≈3.452 min.), dihydroquinine (≈4.962 min.).
Moreover, the amount of lumefantrine is six times the amount of artemether in different medicines, and this is another challenge during sample preparation as there is need of having an effective solvent for both analytes that cannot com-promise the chromatographic results.
DOI: 10.4236/ajac.2017.89042 594 American Journal of Analytical Chemistry
adapted the mobile phase proportions to 85:15, v/v of methanol and ammonium formate buffer pH 2.8 respectively, 0.7 mL min−1 of flow rate, and 25˚C of
col-umn oven using a Zorbax-Extend C18, 80Å, 100 × 4.6 mm (dp: 3.5 µm) analyti-cal column. This allowed to reduce the analysis time from 16 min to 6 minutes on a 100 × 4.6 mm column as illustrated in Figure 5, and to 10 minutes on 150 × 4.6 mm columns with the possibility to reduce the run time by changing the flow rate to 1.0 mL min−1 with the same mobile phase.
4.3. Simple Development and Geometric Transfer of an Isocratic
Method for the Analysis of Quinine, Arteether, Artemether
and Artesunate in Injectable Forms
A simple isocratic method for the analysis of quinine, arteether, artemether and artesunate was developed thanks to a simple systematic approach based on se-quential isocratic runs described in Table 1 using octadecyl silane (ODS or C18) LC columns and the same mobile phase composed by methanol and ammonium formate buffer used in the previous methods development and optimization. In fact, we added quinine dihydrochloride to the three artemisinin compounds as another potential antimalarial medicine used in injectable forms to ensure that the method shall detect it in case of analyzing counterfeit medicines composed by one of the three artemisinin active ingredients.
Then, by following the planned systematic tests, we found better chromato-graphic results at higher proportions of the organic modifier, and we optimized the method at 90:10, v/v of methanol and 10 mM ammonium formate buffer pH 2.8; 0.7 mL min−1 to 1.0 mL min−1 of flow rate; 25˚C of the column oven
com-partment; and 210 nm of wavelength on a Zorbax Extend C18, 150 × 4.6 mm (dp: 5 µm) column; and we transferred the method to XBridge Shield RP18, 100 × 4.6 mm (dp: 3.5 µm), and Zorbax Extend C18, 50 × 4.6 mm (dp: 3.5 µm) col-umns to reduce the analysis time and mobile phase consumption, as well as al-lowing the increase of sample analysis throughput.
As illustrated in Figure 6, one can notice that the method has the ability of separating well the three artemisinin compounds, and that it can allow detecting any counterfeit of mixing them; but also the method was found capable of de-tecting quinine which is another potential injectable medicine from the three compounds.
4.4. Methods Validation
After methods optimization, it is necessary to demonstrate that the new methods are suit-for-purpose by providing accurate analytical results. In this regards, we have selected the method for analysis of artesunate powder for injection as a new antimalarial medicine in Rwanda aligned in the national list of essential medi-cines in 2015 [21] [22]. Moreover, this method can also help in detecting other arteminisin compounds such as arteether and artemether which are closely re-lated to artesunate and which can be found in counterfeit or substandard arte-sunate medicines. Hence, the validation criteria as required by the International
DOI: 10.4236/ajac.2017.89042 595 American Journal of Analytical Chemistry Figure 5. Readjusted isocratic method for the analysis of artemether-lumefantrine in tablet forms. Experimental conditions: Column: Zorbax-Extend C18, 80Å, 100 × 4.6 mm, dp: 3.5 µm (entire and zoomed chromatograms to visualize artemether); Flow: 0.7 mL min−1; T˚: 25˚C; λ = 210 nm; Isocratic elution with methanol and 10 mM ammonium formate buffer pH 2.8 (85:15, v/v).
Elution order: Lumefantrine (≈2.548 min.) and artemether (≈4.508 min.) in Full chromatogram (a) and magnified chromatogram (b) for low abundant peak.
DOI: 10.4236/ajac.2017.89042 596 American Journal of Analytical Chemistry Figure 6. Isocratic method for the analysis of quinine, arteether, artemether and artesunate in injectable forms. Experimental conditions: Column: (a) Zorbax Extend C18, 150 × 4.6 mm (dp: 5 µm); (b) XBridge Shield RP18, 100 × 4.6 mm (dp: 3.5 µm); (c) Zorbax Extend C18, 50 × 4.6 mm (dp: 3.5 µm); Flow: 1.0 mL min−1 for column (a), and 0.7 mL min−1 for column ((b) and (c)); T˚:
25˚C; λ = 210 nm; Isocratic elution with methanol and 10 mM ammonium formate buffer pH 2.8 (90:10, v/v). Elution order: (identic in in the three chromatograms). i) Chromatogram (a): Quinine (≈1.536 min.), artesunate (≈3.132 min.), artemether (≈5.494 min.), arteether (≈6.420 min.); ii) Chromatogram (b): Quinine (≈1.186 min.), artesunate (≈2.161 min.), artemether (≈4.690 min.), arteether (≈5.656 min.); iii) Chromatogram (c): Quinine (≈0.637 min.), artesunate (≈1.144 min.), artemether (≈2.423 min.), arteether (≈2.907 min.).
DOI: 10.4236/ajac.2017.89042 597 American Journal of Analytical Chemistry
Conference on Harmonization (ICH) in its document Q2(R1) were considered namely: selectivity, trueness, precision (repeatability and intermediate preci-sion), accuracy, linearity, limit of detection (LOD) / limit of quantitation (LOQ), and dosing range [7].
At first, we checked the selectivity of the method by checking whether there is no peak interference at the tR of artesunate especially by other artemisinin
com-pounds widely used in pharmaceutical formulations i.e. arteether and artemeth-er, and this criteria was satisfactory as illustrated in Figure 7 since all peaks were well resolved.
At second, we applied the concept of total error strategy represented by accu-racy profiles as decision tool on the fit-for-purpose of the method for its in-tended use [8] [9] [10] [11]. By using the data of CS, the linear regression model was constructed and allowed obtaining the calculated result from VS. Then, an accuracy profile for artesunate was drawn as can be seen in Figure 8 with the
Figure 7. Chromatograms of artesunate with other compounds (a) and artesunate alone in a sample solution (b). Experimental conditions: Column: XBridge Shield RP18, 100 × 4.6 mm (dp: 3.5 µm); Flow: 0.7 mL min−1; T˚: 25˚C; λ = 210 nm; Isocratic elution with
DOI: 10.4236/ajac.2017.89042 598 American Journal of Analytical Chemistry Figure 8. Accuracy profile for quantitative method validation of artesunate powder for injection. The plain red line represents the relative bias, the blue dashed lines the 95%
β-expectation tolerance limits and the black dotted lines the 5% acceptance limits. The green dots express the relative error of the back-calculated concentrations plotted with respect to their targeted concentrations. (For interpretation of the references to color in this figure legend, the reader is referred to the web version of this article).
results of validation criteria summarized in Table 2. The acceptance limits were set at ±5.0% according to the European Medicine Agency (EMA) standard for finished pharmaceutical products [23], and the analytical results from this me-thod comply automatically with the larger specifications of ±10.0% as per the International Pharmacopoeia monograph for artesunate powder for injection
[24]. Indeed, we choose the narrower acceptable limits to allow the method be-ing suitable to both regional requirements (European and International Phar-macopoeias), and the end-user regulatory authority shall choose which limit to enforce.
Then after, from the back-calculated results of VS that are the experimental ones, trueness of the method was assessed as it is the closeness of agreement be-tween a conventionally accepted value (or reference value) that corresponds to the introduced concentrations of the analyte and a mean of experimental ones. We were able to get information on the systematic error that was found quite acceptable with relative biases between −0.1% and 0.3% compared to the two considered acceptable limits.
The method precision was also found acceptable since there was a closeness of agreement among measurements; here, the back-calculated results of VS ob-tained from multiple sampling of homogeneous samples of the analyte. The rela-tive standard deviation values for repeatability and for intermediate precision at the target of 100% concentration level were acceptable with a maximum of 0.3%
DOI: 10.4236/ajac.2017.89042 599 American Journal of Analytical Chemistry Table 2. Summary of the validation criteria for artesunate powder for injection.
Validation criteria Conc. (µg mL−1) Artesunate
Trueness: Absolute bias (µg mL−1) (Relative bias (%)) 3000.0 7.9 (0.3) 4000.0 −4.8 (−0.1) 5000.0 15.0 (0.3) 6000.0 16.3 (0.3) 7000.0 −42.0 (−0.6) Precision: Repeatability (%)/ Intermediate precision (%) 3000.0 0.3/3.3 4000.0 0.2/1.3 5000.0 0.2/1.1 6000.0 0.2/1.1 7000.0 0.2/1.4 Accuracy:
95% β-expect. tol. int. (µg mL−1)
[Rel. 95% β-expect. tol. int (%)]
3000.0 [−9.593, 10.13] 2680 - 3264 4000.0 3870 - 4174 [−3.9 - 3.7] 5000.0 4722 - 5084 [−3.4 - 4.0] 6000.0 5692 - 6060 [−2.9 - 3.4] 7000.0 6628 - 7211 [−4.8 - 3.6] Linearity: Slope 0.9916 Intercept 39.49 R2 0.9975
Dosing range: Lower LOQ (µg mL
−1) 3820
Upper LOQ (µg mL−1) 6962
for repeatability, and 3.2% for intermediate precision.
To demonstrate the method linearity, we assessed the relationship between the back-calculated results of VS (experimental ones) against the introduced con-centrations. The linear regression model was fitted on the two types of concen-trations, with a good linearity of the results illustrated in Table 2 by the slope close to 1.
Moreover, method accuracy taking into account the total error, i.e. systematic and random errors, was assessed from the accuracy profile shown in Figure 8. In addition, as shown in Table 2, the relative β-expectation tolerance intervals are within a range of [−4.8%, 4.0%] except level 1 which is between −9.6% and 10.1%. Hence, as the lower and upper tolerance bounds are included within the acceptance limits for the targeted concentration level of 5000 µg mL−1, one can
guarantee that at least 95% of future experimental results will fall within the ac-ceptance limits [25].
We estimated also the limit of detection (LOD) that is the smallest quantity of the targeted substance that can be detected, but not accurately quantified in the
DOI: 10.4236/ajac.2017.89042 600 American Journal of Analytical Chemistry
sample. The computed value was 124.1 µg mL−1.
The lower limit of quantitation (LLOQ) which is the smallest quantity of the targeted substance in the sample that can be assayed under experimental condi-tions with well-defined accuracy was calculated and its value is 3820 µg mL−1 vs.
the upper limit of quantitation (ULOQ) which is the highest quantity of the tar-geted substance in the sample that can be assayed under the experimental condi-tions with well-defined accuracy was calculated at 6962 µg mL−1. In fact, those
limits of quantitation were obtained by calculating the smallest and highest con-centrations beyond which the accuracy limits or β-expectation limits go outside the acceptance limits. Hence, the intervals between the lower and the upper lim-its where the procedure achieves adequate accuracy allowed us to set the “Dosing range”, again equivalent to [3820 µg mL−1 to 6962 µg mL−1].
Finally, the uncertainty which is a parameter associated with the result of a measurement that characterizes the dispersion of the values that could rea-sonably be attributed to the measurand was calculated, and its relative ex-panded value (%) was found less than 3.1% on the four concentration levels except level 1.
4.5. Application of the Methods
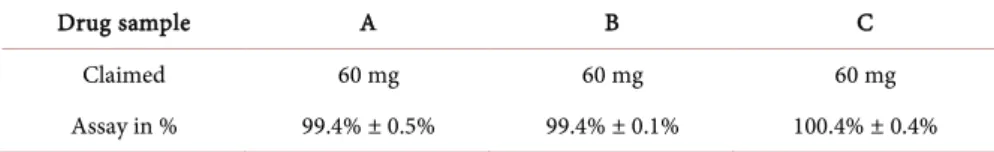
The validated method for analysis of artesunate powder for injection was applied in the analysis of 3 different batches found in public hospitals in Rwanda during our sampling, whose results are presented in Table 3. The other methods were also applied in the analysis of artemether/lumefantrine in different samples of medicines sampled in the D.R. Congo (9 samples), Rwanda (13 samples) and Benin (1 suspected counterfeit) as reported in another article submitted to the Current Drug Safety Journal—Bentham Science Publishers [26], and the method for quinine and major cinchona alkaloids was used in the analysis of suspected counterfeit quinine tablets as reported in the American Journal of Analytical Chemistry [27].
The methods developed in Belgium on a LC Waters 2695 were successfully tested to Rwanda on two other LC systems namely Agilent 1200 series and Agi-lent 1260 series both equipped with diode array detector (DAD) from AgiAgi-lent Technologies (Böblingen, Germany) and Chemetrix (Agilent Technologies au-thorized distributor, Midrand, South Africa) respectively (results not shown).
Table 3. Assay results of the analyzed three batch samples of artesunate powder for injec-tion coded A, B and C sampled in Rwanda. The results consist in the mean percentage of claimed nominal content and the relative standard deviation calculated on 3 independent sample solutions per batch. Specifications are set to 90.0% - 100.0% of the claimed no-minal content (mg).
Drug sample A B C
Claimed 60 mg 60 mg 60 mg
DOI: 10.4236/ajac.2017.89042 601 American Journal of Analytical Chemistry
5. Conclusions
Simple isocratic methods were developed thanks to methods adaptation or ad-justments approach, and sequential systematic tests without passing through long and expensive DoE. The isocratic methods were privileged for their sim-plicity, short analysis time and high sample throughput, low mobile phase con-sumption, and adaptability to LC systems equipped with simple or gradient pumps. In this regard, we developed a generic method for the analysis of: (i) ar-tesunate, arteether and artemether in injectable forms; (ii) artemether and lu-mefantrine in tablets; and (iii) quinine-resorcin with major cinchona alkaloids (cinchonine, cinchonidine, quinidine, and dihydroquinine).
The analytical method for artesunate powder for injection derived from the generic method for artesunate, arteether and artemether was fully validated thanks to the strategy of total error and accuracy profile approach in accordance with the criteria of ICH Q2 (R1) guidelines; and finally, the methods were ap-plied in the analysis of real samples of artemether/lumefantrine medicines, arte-sunate powder for injection, and counterfeit quinine tablets.
Acknowledgements
The Belgian Technical Cooperation (BTC/CTB) is acknowledged for scholarship and financial support to Védaste Habyalimana as well as the Belgian “Académie pour la Recherche et l’Enseignement Supérieur (ARES)” for supplementary funds to the scholarship of this author. Anonymous reviewers are also kindly acknowledged for their useful comments.
References
[1] World Health Organization (2017) Malaria, Fact Sheet Updated. http://www.who.int/mediacentre/factsheets/fs094/en/
[2] Choi, J. and Burke, D. (2017) Malaria.
http://www.healthline.com/health/malaria#overview1
[3] Newton, P.N., Amin, A.A., Bird, C., Passmore, P., Dukes, G., Tomson, G., Simons, B., Bate, R., Guerin, P.J. and White, N.J. (2012) The Primacy of Public Health Con-siderations in Defining Poor Quality Medicines. PLoS Medicine,8, e1001139. https://doi.org/10.1371/journal.pmed.1001139
[4] Dégardin, K., Roggo, Y. and Margot, P. (2014) Understanding and Fighting the Medicine Counterfeit Market. Journal of Pharmaceutical and Biomedical Analysis, 87, 167-175. https://doi.org/10.1016/j.jpba.2013.01.009
[5] Kovacs, S., Hawes, S.E., Maley, S.N., Mosites, E., Wong, L. and Stergachis, A. (2014) Technologies for Detecting Falsified and Substandard Drugs in Low and Mid-dle-Income Countries. PLoS ONE, 9, e90601.
https://doi.org/10.1371/journal.pone.0090601
[6] Hansen, S.H., Pedersen-Bjergaard, S. and Rasmussen, K.E. (2012) Introduction to Pharmaceutical Chemical Analysis, Chapter 13: High Performance Liquid Chro-matography. John Wiley & Sons Publication, New York, 174-175
[7] ICH Harmonised Tripartite Guideline: Validation of Analytical Procedures: Text and Methodology Q2 (R1) (2005).
DOI: 10.4236/ajac.2017.89042 602 American Journal of Analytical Chemistry https://www.ich.org/fileadmin/Public_Web_Site/ICH_Products/Guidelines/Quality /Q2_R1/Step4/Q2_R1__Guideline.pdf
[8] Hubert, Ph., Nguyen-Huu, J.-J., Boulanger, B., Chapuzet, E., Chiap, P., Cohen, N., Compagnon, P.-A., Dewé, W., Feinberg, M., Lallier, M., Laurentie, M., Mercier, N., Muzard, G., Nivet, C. and Valat, L. (2004) Harmonization of Strategies for the Va-lidation of Quantitative Analytical Procedures: A SFSTP Proposal—Part I. Journal of Pharmaceutical and Biomedical Analysis, 36, 579-586.
[9] Hubert, Ph., Nguyen-Huu, J.-J., Boulanger, B., Chapuzet, E., Chiap, P., Cohen, N., Compagnon, P.-A., Dewé, W., Feinberg, M., Lallier, M., Laurentie, M., Mercier, N., Muzard, G., Nivet, C., Valat, L. and Rozet, E. (2007) Harmonization of Strategies for the Validation of Quantitative Analytical Procedures: A SFSTP Proposal—Part II.
Journal of Pharmaceutical and Biomedical Analysis, 45, 70-81. https://doi.org/10.1016/j.jpba.2007.06.013
[10] Hubert, Ph., Nguyen-Huu, J.-J., Boulanger, B., Chapuzet, E., Cohen, N., Compag-non, P.-A., Dewé, W., Feinberg, M., Laurentie, M., Mercier, N., Muzard, G., Valat, L. and Rozet, E. (2007) Harmonization of Strategies for the Validation of Quantita-tive Analytical Procedures: ASFSTP Proposal—Part III. Journal of Pharmaceutical and Biomedical Analysis, 45, 82-96. https://doi.org/10.1016/j.jpba.2007.06.032 [11] Hubert, Ph., Nguyen-Huu, J.-J., Boulanger, B., Chapuzet, E., Cohen, N.,
Compag-non, P.-A., Dewé, W., Feinberg, M., Laurentie, M., Mercier, N., Muzard, G., Valat, L. and Rozet, E. (2008) Harmonization of Strategies for the Validation of Quantita-tive Analytical Procedures: A SFSTP Proposal: Part IV—Examples of Application.
Journal of Pharmaceutical and Biomedical Analysis, 48, 760-771. https://doi.org/10.1016/j.jpba.2008.07.018
[12] Guillarme, D., Nguyen, D., Rudaz, S. and Veuthey, J.-L. (2008) HPLC Calculator v3.0: Software for Chromatographic Performance Evaluation and HPLC Method Transfer. European Journal of Pharmaceutics and Biopharmaceutics, 68, 430-440. https://doi.org/10.1016/j.ejpb.2007.06.018
[13] The United States Pharmacopeial Convention, USP39-NF34 (2016) General Chap-ters: <621> Chromatography—System Suitability.
[14] European Pharmacopoeia (2015) Methods of Analysis—Chromatographic Separa-tion Techniques—Adjustment of Chromatographic CondiSepara-tions. 8th EdiSepara-tion. [15] The International Pharmacopoeia (2016) High-Performance Liquid
Chromatogra-phy—System Suitability—Adjustment of Chromatographic Conditions. 6th Edition.
http://apps.who.int/phint/pdf/b/Jb.7.1.14.4.pdf
[16] Mbinze, J.K., Loconon, A.Y., Lebrun, P., Sacré, P.-Y., Habyalimana, V., Kalenda, N., Bigot, A., Atindehou, E., Hubert, Ph. and Marini, R.D. (2015) Fighting Poor Quality Medicines: Development, Transfer and Validation of Generic HPLC Methods for Analyzing Two WHO Recommended Antimalarial Tablets. American Journal of Analytical Chemistry, 6, 127-144. https://doi.org/10.4236/ajac.2015.62012
[17] International Pharmacopoeia (2016) Quinine Bisulfate Tablets; Quinine drochloride Injection; Quinine Sulfate Tablets; Quinine Bisulfate; Quinine Dihy-drochloride; Quinine HyDihy-drochloride; Quinine Sulfate. 6th Edition.
http://apps.who.int/phint/en/p/docf/
[18] YMC Co. Ltd. (Japan) (n.d.) Columns—YMC-Pack Pro C8&C4—Separation of Ba-sic Compounds. http://www.ymc.co.jp/en/columns/ymc_pack_pro_c8_c4/
[19] McCalley, D.V. (1986) Analysis of the Cinchona Alkaloids by High-Performance Liquid Chromatography: Use as Probes of Activity towards Basic Compounds Shown by Reversed-Phase Columns. Journal of Chromatography A, 357, 221-226.
DOI: 10.4236/ajac.2017.89042 603 American Journal of Analytical Chemistry https://doi.org/10.1016/S0021-9673(01)95824-8
[20] Republic of Rwanda, Ministry of Health (2010) National List of Essential Medicines, 5th Edition. http://apps.who.int/medicinedocs/documents/s17569fr/s17569fr.pdf [21] Republic of Rwanda, Ministry of Health (2015) National List of Essential Medicines
for Adults. 6th Edition.
http://moh.gov.rw/fileadmin/templates/Docs/NEML_For_Adults_6th_Edition_201 5.pdf
[22] Republic of Rwanda, Ministry of Health (2015) National List of Essential Medicines for Paediatrics.
http://moh.gov.rw/fileadmin/templates/Docs/NEML_For_Paediatrics-_1st_Edition-2015.pdf
[23] European Medicines Agency (EMA) (1991) Specifications and Control Tests on the Finished Product. Directive 75/318/EEC.
http://www.ema.europa.eu/docs/en_GB/document_library/Scientific_guideline/200 9/09/WC500003368.pdf
[24] International Pharmacopoeia (2016) Artesunate for Injection. 6th Edition. http://apps.who.int/phint/pdf/b/Jb.6.2.2.20.pdf
[25] Commission SFSTP, Hubert, Ph., Nguyen-Huu, J.J., Boulanger, B., Chapuzet, E., Chiap, P., Cohen, N., Compagnon, P.A., Dewe, W., Feinberg, M., Lallier, M., Lau-rentie, M., Mercier, N., Muzard, G., Nivet, C. and Valat, L. (2003) Validation des procédures analytiques quantitatives Harmonisation des demarches. [Validation of Quantitative Analytical Procedure, Harmonization of Approaches.] STP Pharma Pratiques, 13, 101-138. http://hdl.handle.net/2268/22157
[26] Yemoa, A., Habyalimana, V., Mbinze, J.K., Crickboom, V., Muhigirwa, B., Ngoya, A., Sacré, P.-Y., Gbaguidi, F., Quetin-Leclercq, J., Hubert, Ph. and Marini, R.D. (2017) Detection of Poor Quality Artemisinin-Based Combination Therapy (ACT) Medicines Marketed in Benin Using Simple and Advanced Analytical Techniques.
Current Drug Safety Journal, 12, E-Pub Abstract Ahead of Print.
[27] Habyalimana, V., Mbinze, J.K., Tshilombo, N.K., Dispas, A., Loconon, A.Y., Sacré, P.-Y., Widart, J., De Tullio, P., Counerotte, S., Ntokamunda, J.-L.K., Ziemons, E., Hubert, Ph. and Djang’eing’a, R.M. (2015) Analytical Tools and Strategic Approach to Detect Poor Quality Medicines, Identify Unknown Components, and Timely Alerts for Appropriate Measures: Case Study of Antimalarial Medicines. American Journal of Analytical Chemistry,6, 977-994.
Submit or recommend next manuscript to SCIRP and we will provide best service for you:
Accepting pre-submission inquiries through Email, Facebook, LinkedIn, Twitter, etc. A wide selection of journals (inclusive of 9 subjects, more than 200 journals)
Providing 24-hour high-quality service User-friendly online submission system Fair and swift peer-review system
Efficient typesetting and proofreading procedure
Display of the result of downloads and visits, as well as the number of cited articles Maximum dissemination of your research work
Submit your manuscript at: http://papersubmission.scirp.org/