Contents lists available atScienceDirect
Building and Environment
journal homepage:www.elsevier.com/locate/buildenvComparative bioclimatic approach for comfort and passive heating and
cooling strategies in Algeria
Samir Semahi
a,b,d, Noureddine Zemmouri
b, Manoj Kumar Singh
c, Shady Attia
d,∗ aInstitute of Architecture and Urbanism, University of Blida-1, Blida, AlgeriabLaboratory of Design and Modeling of Architectural and Urban Forms and Ambiances (LACOMOFA), Department of Architecture, University of Biskra, Biskra, Algeria cDepartment of Human and Social Systems, Institute of Industrial Science, The University of Tokyo, 4-6-1, Komaba, Meguro-ku, Tokyo, 153-8505, Japan
dSustainable Building Design Lab, Dept UEE Applied Sciences, Universite de Liege, Belgium
A R T I C L E I N F O Keywords: Climate analysis Bioclimatic chart Adaptive comfort Bioclimatic design Energy simulation Residential building A B S T R A C T
The energy consumption and thermal comfort in buildings are heavily affected by weather conditions. Therefore, the aim of this paper is to analyze the bioclimatic potential of Algerian climate zones. This analysis was made based on eight representative locations using recent weather datasets (2003–2017). The thermal comfort and passive design potential analysis were based on a psychometric chart applying the adaptive comfort model ASHRAE 55–2017. In addition, an evaluation of the bioclimatic potential was conducted using simulations of a monitored and calibrated residential building model in Algeria using EnergyPlus. The building model has been tested in eight previously selected locations. The heating and cooling energy load results were calculated for each climatic zone and compared. The results allow architects and urban planners to better understand the climate and provide practical design guidance.
1. Introduction
The present and future of sustainably built environments is influ-enced by the ability of architects, engineers, and urban designers to create buildings that reduce building-associated carbon dioxide emis-sions and at the same time achieve high levels of thermal comfort [1]. However, this ability is influenced by the understanding of the local climate and the application of corresponding bioclimatic design prin-ciples and strategies [2]. In the past, many innovative heating, venti-lation, and air conditioning (HVAC) technologies have been proposed to improve the indoor conditions, regardless of energy savings. Today, the integration of passive and active design solutions in newly con-structed buildings is becoming a must worldwide. The recent progress with respect to adaptive thermal comfort models and their proliferation influence our understanding of the bioclimatic building performance [3–5]. Therefore, bioclimatic studies that investigate the effects of cli-mate on the thermal comfort conditions and the building heating and cooling energy demand are increasingly receiving attention from the research and development community [6–8].
Integrating bioclimatic analysis tools into daily urban or archi-tectural design practices is a challenge but an essential step towards realizing effective climate-responsive design [8]. Several analytical tools are available for the quantification of the potential effectiveness of
design strategies, e.g., the ECOTECT Weather Tool [9] and Climate Consultant [10,11]. However, most of those analytical tools depend on static comfort models of fully space-conditioned buildings and are not suitable for buildings in hot climates [8]. More importantly, some of them lack sensitivity to hot climates and provide misleading design recommendations [7,8,12,13]. Providing accurate bioclimatic design recommendations is essential for making informed design decisions in early design stages [14,15].
In this paper, we adopt a dual approach that combines psychro-metric chart-based analysis with building performance simulation analysis for the development of accurate bioclimatic design re-commendations for Algeria. This research approach is inspired by and builds on the work of Kumar et al. and Kishore et al. [16,17] and adds up on to it. Our research approach integrates the ASHRAE-55 adaptive comfort model as a novel assessment component. The main aim of this paper is to analyze the bioclimatic potential of passive design strategies in Algeria. The paper has two objectives:
1 Evaluate the thermal comfort and bioclimatic design potential of eight selected cities, which represent the six official climate zones of Algeria, based on a psychometric chart and the adaptive comfort model ASHRAE 55–2017.
2 Validate the bioclimatic potential analysis by simulating the heating
https://doi.org/10.1016/j.buildenv.2019.106271
Received 22 March 2019; Received in revised form 29 May 2019; Accepted 5 July 2019 ∗Corresponding author.
E-mail address:[email protected](S. Attia).
Available online 08 July 2019
0360-1323/ © 2019 Elsevier Ltd. All rights reserved.
and cooling energy loads of a calibrated residential building for the eight selected cities.
The value of the paper is based on providing a systematic and methodological approach to assess the bioclimatic design potential in Algerian cities based on updated weather datasets. Validated biocli-matic design recommendations for comfort and passive heating and cooling in Algeria are obtained by using a recent dataset (2003–2017) of eight Algerian cities and a calibrated reference building for building performance simulation.
The paper is organized as follows. A literature is provided in Section 2. The research methodology and analysis results are described in detail in Sections3 and 4. Section5reflects on the results of the reference case simulation and provides a critical discussion of the study's strength, limitations, and future implications. The paper is concluded in Section6 by highlighting the key findings and contributions of the study.
2. Literature review
The importance of bioclimatic studies is growing and gaining mo-mentum every year. The aim of bioclimatic studies is to understand the climate to maximize the benefits of bioclimatic building design strate-gies and ensure thermal comfort and increase the energy efficiency. Although being one of the most important aspects of building energy efficiency, several advances have been made in this field in recent years. Our literature review included more than 140 publications, found on Scopus and the Web of Science, relevant to the field of bio-climatic analysis. However, we selected the most relevant publications and classified them into groups using three main categories, which are described in the following paragraphs.
The first group of studies regarding bioclimatic analysis contains
the oldest publications that relied on using bioclimatic charts to assess the climate and provide design recommendations for designers. The building bioclimatic chart indicates if the temperature and humidity conditions are within the comfort range of a building designed to ef-fectively benefit from bioclimatic design strategies [18]. The most im-portant publications of this group based on charts 1) are Mollier's psychrometric chart (1923), 2) Olgyay's chart (1963), and 3) Dekay and Browns chart (2004) [19–21].
The chart of Mollier is the one that is most famous and widely used by engineers, architects, and urban planners [16]. The chart evolved and benefited from the significant contributions of Givoni and Milne in 1979 that combined different bioclimatic design strategies in a chart [22]. In the same year, Milne developed an interactive computer-aided tool for passive solar design that later became the Climate Consultant program [23]. In the 1980s and 1990s, several researchers contributed to the psychrometric chart and applied unique comfort models [24]. More recently, several researchers applied the psychrometric chart to local contexts [25–28]. The chart of Olgyay has been used less because it is less comprehensive. However, several researchers applied it and validated its outcomes in the last years. The work of Katafygiotou et al. [29] on Cyprus and Pajek et al. [30] on Slovenia have recently become two of the most cited publications. The third type of chart that was published in 2004 by Dekay and Brown has been used in recent
research in Australia, Iran, and Madagascar [8,11,31,32]. Un-fortunately, bioclimatic charts lack sensitivity to hot climates and provide misleading design recommendations [15,16].
The second group of studies regarding bioclimatic analysis mainly
relies on building performance simulations to assess the climate and provide recommendations for designers. The building performance si-mulation (BPS) is the replication of aspects of the building performance using a computer-based, mathematical model created on the basis of fundamental physical principles and sound engineering practice [33]. This group is characterized by an abundance of publications worldwide. Therefore, we focused on the publications most relevant to Algeria, which aimed to calculate the bioclimatic potential or heating/cooling degree days or run simulations to predict the impact of climate change. This includes the work of Khouki et al. [34] who assessed the effec-tiveness of bioclimatic design strategies in hot dry regions of Algeria and that of Imessad et al. [35] who focused on assessing the effec-tiveness of passive cooling in Algiers. Among those studies, the study of Ghedamsi et al. [36] is the most relevant and comprehensive study in which the annual heating and cooling requirements of buildings in different regions of Algeria were calculated using the degree days method. Unfortunately, none of those studies followed a comprehensive approach that covers all climatic regions of Algeria while providing validated bioclimatic design recommendations that designers can apply in early design stages. More importantly, most studies that follow the simulation-based approach are post-design evaluations and mainly consider only hypothetical non-bioclimatic comfort models and thus do not validate early-design bioclimatic recommendations.
The third group of studies regarding bioclimatic analysis mainly
relies on a mixed approach combing bioclimatic charts and building performance simulations to assess the climate and provide re-commendations for designers. This group of studies emerged in 2017 with the work of Pajek et al. [12] who investigated the climatic po-tential of five cities in Slovenia and the work of Ali-Toudert et al. [37] who focused on two climatic zones in Algeria. The work of Kumar et al. and Kishore et al. [16,17] also belong to this group because they sys-tematically combined bioclimatic chart analysis with building perfor-mance analysis for India. The advantage of the mixed approach is that it allows comparing the simulation results with the bioclimatic potential analysis to validate the design recommendation. More importantly, validated design recommendations are grouped and classified in a comprehensive way based on this approach, which contributes to the consolidation of the knowledge of bioclimatic design on national scales. This overview and classification of literature demonstrate that the mixed bioclimatic analysis approach should be adopted to obtain in-formation about the design of bioclimatic buildings. The literature re-view indicates that this mixed bioclimatic analysis approach has been the most studied approach in recent years, particularly in Algeria. Thus, the lack of validated design recommendations for bioclimatic design may inhibit the integration of bioclimatic design solutions and tech-nologies in future buildings.
In this paper, we present the results of the application of a mixed approach that combines bioclimatic analysis and building performance simulations to address several of the points mentioned above. More specifically, the validity of bioclimatic design strategies in Algeria was
Abbreviations
ASHRAE American Society of Heating, Refrigerating, and Air-Conditioning Engineers
CNERIB Centre National d’Etudes et de Recherches Integrees du Batiment
CV (RMSE) Coefficient of Variation or Root-Mean-Square Error DBT Dry-Bulb Temperature
DEC Direct Evaporative Cooling
DHW Domestic Hot Water
DTR Document Technique Réglementaire HVAC Heating, Ventilation, and Air Conditioning MBE Mean Bias Error
NV Natural Ventilation PSH Passive Solar Heating TMY Typical Meteorological Year WBT Wet-Bulb Temperature WWR Window-to-Wall Ratio
tested based on a recent weather dataset (2003–2017), adaptive com-fort model, and calibrated reference study.
3. Materials and methods
The research methodology is based on a comparative approach that quantifies the bioclimatic potential of different locations in Algeria using recent weather datasets. Firstly, the annual bioclimatic potential is quantified using simple psychrometric charts without considering the building effect. Secondly, a simulation model for a representative case study in Algeria is used to assess the bioclimatic potential including the building effect. Our methodology is inspired by the work of Khambadkone and Jain [38] who applied this approach in India. We applied their methodology to a new context.Fig. 1presents the detailed conceptual framework of the study describing the steps of the research methodology. The conceptual framework of this study can be divided into four major steps. Each step is described in detail in the following sections.
3.1. Literature review
A literature review was conducted including recent publications that aimed to assess the bioclimatic potential worldwide. The publica-tions included scientific manuscripts that focus on climate zoning and bioclimatic design. Our initial Scopus and Web of Science research re-sulted in more than 140 publications relevant to bioclimatic analysis. We then narrowed the research scope to focus on bioclimatic analysis in hot and hot–arid climates. The publication information was imported to the software HistCite for analysis and grouped into three categories: bioclimatic chart-based analysis, building performance
simulation-based analysis, and mixed analysis. Moreover, a review of Algerian national standards and codes was performed to cover the local state of the art and reflect the regulation landscape. The results of the literature review are presented in Section2.
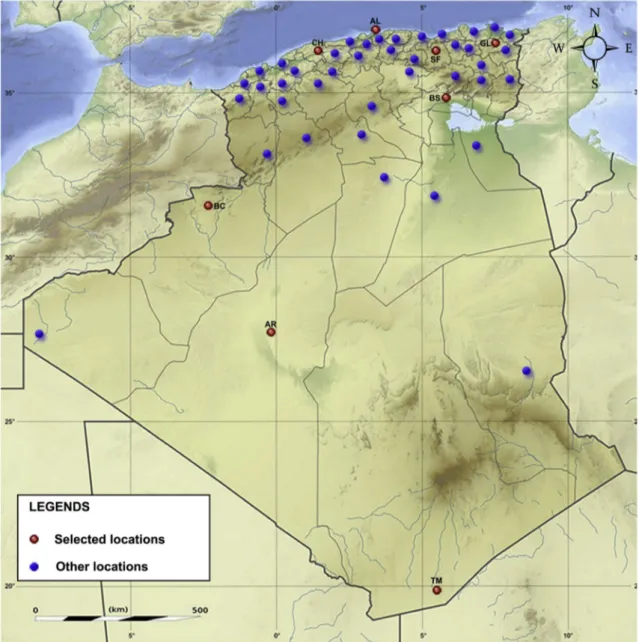
3.2. Selection of representative locations
According to the Algerian National Center of Studies and Researches Integrees of the Building (CNERIB: Centre National d’Etudes et de Recherches Integrees du Batiment) and the thermal regulation (DTR C3-2) [39] for residential buildings, Algeria has six distinguished climatic zones: Zone (A): in the north of Algeria, including the coastal zone; Zone (B): in the south of zone (A), including the plain behind the sea-shore; Zone (C): in the south of zone (B), including the highlands; Zone (D): in the south of Algeria, including the desert; and the climate zones (B′) and (D′), representing subzones within the main zones (B) and (D), respectively. Some of the characteristics of the subzones differ from those of the main zones. For example, they have the same character-istics in winter as the main zones, but they are very hot in summer compared with the main zones (B) and (D). For our investigation, we selected eight locations because climate zone (D) covers a large area in the south of Algeria and we thus added two weather stations to this zone (seeTable 1). Among those weather stations, we distinguished in Guezzam city, located in the south of Tamanrasset Region, because it has specific climatic characteristics. In Guezzam has an annual global radiation that exceeds 7600 Wh/m2[40]. This could have an impact on other climate data for this location. We also used a map with the official climatic zones of Algeria. Fig. 2indicates the locations of the eight selected weather stations.
3.3. Climate data
In this study, recent weather datasets (2003–2017) for eight loca-tions were used. The last version of the Typical Meteorological Year (TMY) hourly weather data files for the eight selected locations was used (seeTable 1). These weather data were created by the Algerian National Meteorology Office and made available by the United States Department of Energy [41].
3.4. Calculation of annual bioclimatic potential
A psychrometric chart and the adaptive comfort model ASHRAE 55–2017 were used to calculate the bioclimatic potential of the eight selected locations. The selection of the ASHRAE 55-2017 adaptive comfort model was based on the recommendations of Attia et al. [8] who consider it as the best available socioeconomic model that sets no humidity limit, which is essential in the coastal cities of Algeria. Table 1
Geographical information about the eight selected representative locations in Algeria.
No. Name of location Station code Coordinates Altitude (m) Climate zone (CNERIB classification)
1 Algiers AL 36.6 °N 3.2 °E 25 A 2 Guelma GL 36.4 °N 7.4 °E 228 B 3 Chlef CH 36.2 °N 1.3 °E 141 B′ 4 Setif SF 36.1 °N 5.3 °E 1050 C 5 Biskra BS 34.7 °N 5.7 °E 88 D 6 Bechar BC 31.6 °N 2.2 °W 811 D 7 Adrar AR 27.8 °N 0.1 °W 280 D′
8 Tamanrasset (in Guezzam) TM 19.6 °N 5.8 °E 400 D
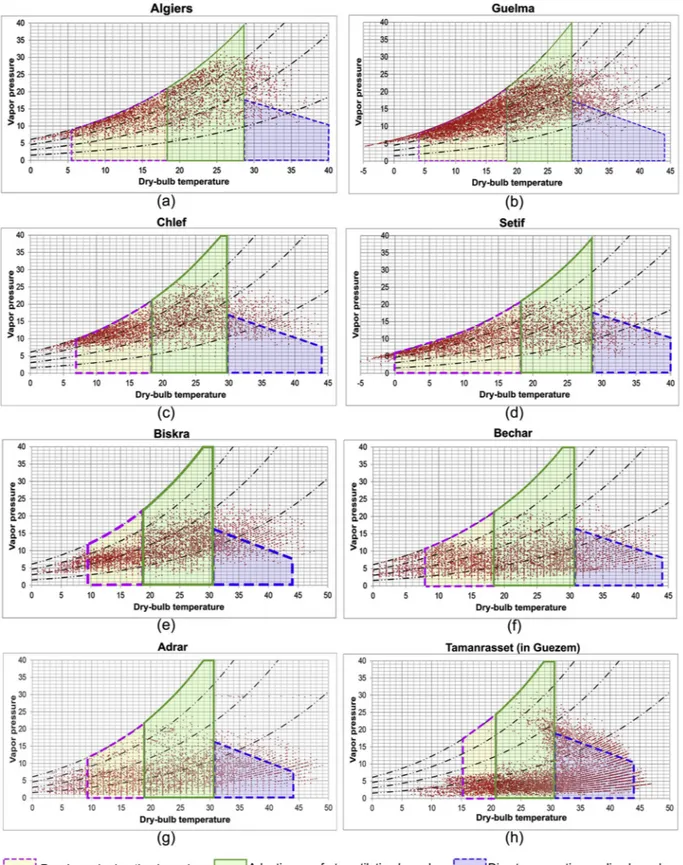
The hourly weather data of each location were plotted on the psy-chrometric chart. The data plots were created using three major bio-climatic design strategies or combinations of the three strategies:
•
Passive Solar Heating (PSH)•
Natural Ventilation (NV)•
Direct Evaporative Cooling (DEC)The literature review indicated that the three strategies listed above are the most effective design strategies, which are suitable for the cli-mate of Algeria and should be prioritized by designers [34,42]. The boundaries of the thermal comfort zone were limited by the comfort temperature calculated by the adaptive comfort model ASHRAE 55–2017. The zone of direct evaporative cooling was limited by the thermal comfort zone. The wet-bulb temperature (WBT) maximum in summer is ∼24 °C and the Dry Bulb Temperature (DBT) maximum is about 44 °C (in hot–dry developing countries) according to Givoni [43]. The potential of thermal comfort, passive cooling, and passive heating were calculated based on the number of hourly data points within each boundary on the chart. The passive solar heating zone is a function of the building design. The lower limit of this zone is defined by the lowest outdoor air temperature at which the available solar radiation will produce minimum comfort temperatures. The bioclimatic chart for the eight selected locations was created based on these assumptions. Eqs(1) and (2)provide the basis of the bioclimatic potential calefactions:
•
Optimal comfort temperature (°C) [5,11]:Tc= 0.31ƒ(Tout) + 17.8 10 °C ≤ ƒ(Tout) ≤ 33.5 °C (1)
Upper 90% acceptability limit (°C):
Tc= 0.31ƒ(Tout) + 20.3 10 °C ≤ ƒ(Tout) ≤ 33.5 °C
Lower 90% acceptability limit (°C):
Tc= 0.31ƒ(Tout) + 15.3 10 °C ≤ ƒ(Tout) ≤ 33.5 °C
where ƒ(Tout) is the prevailing mean outdoor air temperature (tpma(out))
in ASHRAE 55 for 2013 and 2017 and the mean monthly outdoor air temperature in ANSI/ASHRAE 55 for 2004 and 2010.
•
Prevailing mean outdoor air temperature (°C) [5]:̅tpma(out)= (1 − α) [te (d-1)+ α·te (d-2)+ α2·te (d-3)+ α4·te (d-4)+…], (2) where α is a constant ranging between 0 and 1 and te (d-1)is the daily
mean external air temperature at time d of a series of equal intervals (day).
In the last two versions, ANSI/ASHRAE 55 suggests an α value of 0.9 for climates in which the day-to-day temperature variation is relatively minor, such as the humid tropics, and a lower α value of 0.6 for mid-latitude climates in which the day-to-day temperature variation is more pronounced.
3.5. Reference building
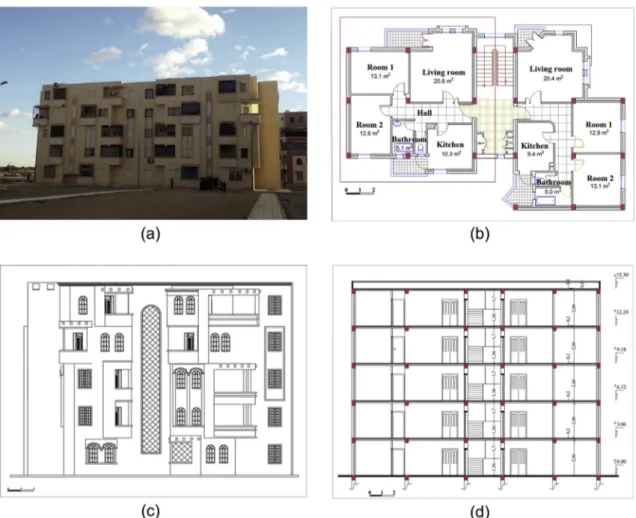
A representative reference building was selected to conduct building performance simulations. The case study includes a multi-family social housing typology in Biskra in the southwest of Algeria (coordinates:
34°51′N 5°44′E; altitude: 87 m; Biskra, Latin Vescera). Biskra's climate is classified as hot desert climate and falls in zone BWh in the Köppen climate classification. This typology was chosen because it represents the most common typology in Algeria. The selected apartment was in the first floor to be more representative because the ground floor and highest floor are more affected by the outdoor environment. In addi-tion, we were able to take real measurements in this apartment.Fig. 3 shows the characteristics of the reference building, which is a housing typology commonly found in most urban dense cities in Algeria.Table 2 presents the thermophysical properties of the building elements ac-cording to the Algerian Thermal Regulation of Residential Buildings [39].
3.6. Simulation model and validation
The reference building was modeled using EnergyPlus v.8.3 soft-ware, which is a validated program for the simulation of the building thermal performance [45].Fig. 4shows the 3D model of the reference building. The building geometry (seeFig. 3) and thermal properties of the real building components (Table 2) were used as the simulation model input. The systems of heating, cooling, and Domestic Hot Water (DHW) were represented based on a building audit, similar to the schedules of occupancy, lighting, heating, cooling, and DHW (see Fig. A). The TMY hourly weather data file for Biskra was used to represent the outdoor weather conditions. The following two sections describe the performance monitoring that was conducted for the reference building and the use of the monitoring data to validate the model.
3.6.1. Building audit and monitoring
The indoor air temperature and energy consumption of the selected apartment were monitored during 2016. A walkthrough visit was per-formed to identify the major energy use equipment (e.g., heating sys-tems, air conditioners, ceiling fans, lighting, water heaters, stoves) and questions were asked about the living habits of the occupants to create occupancy and other related schedules. The indoor air temperatures were continuously recorded from January 21–27, 2016, (168 h) in the winter period and from July 12–18, 2016, (168 h) in the summer period. The indoor air temperatures were determined every hour with a Testo-480 measurement kit. We used the sensor temperature and hu-midity. The measurement range is −20 °C to +70 °C at an accuracy of ± 0.5 °C. The instrument was installed in the living room. The
measurements taken in the main living space of the apartment are considered representative, similar to the work of Colton et al. [46] and Lai et al. [47]. To avoid data distortion due to radiation from floor and walls, the instrument was placed in the center of the space at a height of 1.4 m, which is the medium clear height of the living room. The monthly electric and gas consumptions (kWh) were registered during 2016; the data were collected from electricity and gas meters.
3.6.2. Calibration method
The calibration focused on how closely the simulated results match the monitored data. The calibration was an essential step to allow the creation of a reliable simulation model. The simulation model was ca-librated using the present building physics conditions and patterns of energy use. To calibrate the building simulation model, ASHRAE Guideline 14 was followed. Two indices of the ASHRAE Guildine 14 were used for our manual calibration: 1) mean bias error (MBE), and 2) coefficient of variation or root-mean-square error [CV (RMSE)]. The MBE is a nondimensional measure of the overall bias error between the measured and simulated data with a known time resolution. The CV (RMSE) indicates how well the simulation model describes the varia-bility in the measured data. The MBE and CV (RMSE) values were calculated using the following equations:
= = = MBE Mi Si Mi ( ) (%) i Np i Np 1 1 (3) = = CV RMSE M Mi Si Np ( ) 1 i ( ) (%), Np 1 2 (4) where Mi and Si are the measured and simulated data at time interval I and Np is the total number of data values used for the calculation.
According to ASHRAE Guideline 14 [48], the simulation model is considered calibrated if:
•
hourly MBE values are within ± 10% and hourly CV (RMSE) values are below 30%•
monthly MBE values are within ± 5% and monthly CV (RMSE) va-lues are below 15%The simulation was calibrated using two data categories: 1) hourly indoor temperature, and 2) monthly energy consumption. Each data Table 2
Thermal properties of the building elements of the selected multi-family social housing typology [39,44]. N° Building
element Outside toinside Composition Thickness (m) Thermal conductivity (W/m-K) Density (kg/m3) Specific heat capacity(kJ/kg K) U-value (W/m2-K)
1 Exterior wall Layer 1 Mortar 0.02 1.15 1900 1.08 1.118
Layer 2 Hollow brick 0.15 0.48 900 0.93
Layer 3 Air cavity 0.05 0.024 1.22 1.00
Layer 4 Hollow brick 0.1 0.48 900 0.93
Layer 5 Plaster 0.02 0.35 800 0.93
2 Partition wall Layer 1 Plaster 0.02 0.35 800 0.93 1.857
Layer 2 Hollow brick 0.1 0.48 900 0.93
Layer 3 Plaster 0.015 0.35 800 0.93
3 Internal floor Layer 1 Tiling 0.02 1.7 2200 0.93 1.985
Layer 2 Mortar 0.03 1.15 1900 1.08
Layer 3 Concrete slab (hollow
block) 0.2 1.45 1450 1.08
Layer 4 Plaster 0.02 0.35 800 0.93
4 Roof Layer 1 Tightness 0.015 0.7 2100 1.04 0.584
Layer 2 Mortar 0.04 1.15 1900 1.08
Layer 3 Polystyrene 0.05 0.04 20 1.4
Layer 4 Concrete slab (hollow
block) 0.2 1.45 1450 1.08
Layer 5 Plaster 0.02 0.35 800 0.93
5 Ground floor Layer 1 Concrete 0.1 1.75 2500 1.08 3.259
Layer 2 Mortar 0.03 1.15 1900 1.08
category has two subcategories: winter and summer indoor temperature and electricity and gas consumption. A manual calibration was used and the initial model (reference case) went through several trial-and-error modifications. The airtightness values, schedules (occupancy, lighting, heating, cooling, and DHW), and setpoint temperature values were modified during the calibration. The MBE and CV (RMSE) values were calculated after each simulation run and compared with the ac-curacy thresholds of ASHRAE Guideline 14.Table 3and Figure A in the appendix A summarize the final model input. The results of the vali-dation of the simulation model calibration are described in Section4.2.
3.7. Calculation and comparison of energy loads
After validating the building performance simulation model, the thermal comfort and annual energy consumption of the reference case were calculated. The annual energy consumption and discomfort hours of the eight selected locations were simulated. A statistical method was used to compare the results of the simulation and bioclimatic potential. The results of the simulation and the comparison with the bioclimatic
potential analysis are described in Section4.3.
4. Results
4.1. Bioclimatic potential of the eight selected locations
The monthly minimum and maximum adaptive comfort tempera-ture ranges for the selected eight locations were calculated using the ASHRAE adaptive model and Eqs(1) and (2). The weather data used in this calculation are the averages of 15 years (2003–2017) for each lo-cation.Table 4shows that each city has a monthly upper and lower limit. Based on the identification of the monthly adaptive comfort limit thresholds indicated in Table 4, we selected the highest and lowest comfort temperatures of all months for each location to obtain the annual adaptive comfort temperature range.
The annual bioclimatic potential of the three major design strategies was calculated (seeTable 5). The percentage of each bioclimatic stra-tegy's potential is listed in Table 5. The psychrometric charts were plotted using the hourly weather data for each location, as shown in Fig. 4. Simulated building model developed using DesignBuilder (EnergyPlus).
Table 3
Simulation model parameter input.
Model input measures Value
Envelope External wall (W/m2K) 1.118 [39]
External wall surface absorptance, CCF 0.6
Internal floor (W/m2K) 1.985
Air tightness (Vol/h) 3
WWR (%) 11.47°N, 12.78°S
Opening (W/m2K) 5.778
Solar Heat Gain Coefficient (SHGC) 0.81
Occupancy Density (people/m2) 0.0844
Schedules seeFig. A1(a)
Lighting Installation power density (W/m2) 15 (to achieve 300 Lux)
Schedules seeFig. A1(b)
Ventilation and air conditioning Outside air (l/s per person) 10
Temperature setpoint (°C) Heating 22 °C, Cooling 28 °C [39,49]
COP/EER 1.8/1.8
DHW Winter period (December–March) (l/m2/day) 3.15
Midseason period (April and May, October and November) (l/m2/day) 1.89
Schedules seeFig. A1(c)
Fig. 5.
4.1.1. Annual thermal comfort potential
The annual thermal comfort potential (%) was calculated for the different locations, as shown inFig. 6. It represents the percentage of comfortable time (h) during the year without the use of any bioclimatic strategies.Fig. 6shows that the weather in Chlef is characterized by the highest number of hours within the comfort limits (28%). This location has a higher comfort period compared with the other locations in Al-geria. In contrast, the annual comfort potential of Setif and Tamanrasset (within the Tamanrasset Province) is ∼18.5%. These locations have the lowest number of comfort hours throughout the year.
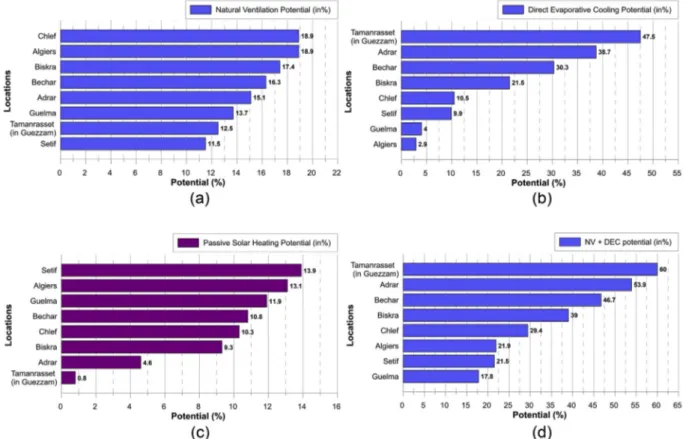
4.1.2. Annual natural ventilation potential
The annual natural ventilation potential (%) was calculated for the different locations shown inFig. 7a. The natural ventilation strategy allows to extend the upper comfort threshold to a maximum of 3 °C according to ASHRAE 55 [50]. As shown inFig. 7a, the highest po-tential to increase the comfort hours by natural ventilation was ob-served in Chlef and Algiers (∼19%). In contrast, Setif has the lowest value (11.6%); natural ventilation can be considered as an effective passive strategy.
4.1.3. Annual direct evaporative cooling potential
The annual evaporative cooling potential (%) for the different lo-cations was calculated, as shown inFig. 7b. It represents the percentage of time during the year during which the comfort limit is extended
above the upper limits of comfort by using direct evaporative cooling. Evaporative cooling can extend the comfort period by ∼47.5% in Ta-manrasset (in Guezzam). This value shows that evaporative cooling is very effective in the Tamanrasset Province. In contrast, evaporative cooling is the least effective strategy in Algiers (3%).
4.1.4. Annual passive solar heating potential
The annual passive solar heating potential (%) for the different lo-cations is shown inFig. 7c. It represents the percentage of time during the year during which the comfort is extended below the lower comfort threshold through direct solar radiation. Passive solar heating extends the comfort period by ∼14% in Chlef, which has the highest potential compared with the other locations. The lowest passive solar heating potential is obtained in Tamanrasset (1%).
4.2. Validation of the simulation model calibration
The MBE and CV(RMSE) were used for different comparisons be-tween measured and simulated data.Table 6outlines the MBE and CV (RMSE) calibration results. The model was validated usingTable 6.
Fig. 8shows the comparison between the measured and simulated indoor temperatures for the monitored periods. In the winter period, the MBE is −2% and the CV(RMSE) is 5.1%, while the admitted limit is ± 10% and ± 30%, respectively. In the summer period, the MBE is −1.5% and the CV(RMSE) is 4.9%, while the admitted limit is ± 10% and ± 30%, respectively. The model MBE and CV(RMSE) values for the hourly data are within ASHRAE-recommended hourly values. The Table 4
Indoor adaptive comfort temperatures (°C) for the eight selected locations in 2016.
No Name of City 90% Acceptability Range Jan Feb Mar Apr May Jun Jul Aug Sep Oct Nov Dec Annual
1 Algiers Max (°C) 23.6 23.4 24.3 15.2 26.2 27.3 28.3 28.4 27.6 26.7 24.8 24 28.4 Min (°C) 18.6 18.4 19.3 20.2 21.2 22.3 23.3 23.4 22.6 21.7 19.8 19 18.4 2 Guelma Max (°C) 22.9 22.9 23.9 24.6 26.1 27.1 28.7 28.1 27 26.4 24.6 23.4 28.7 Min (°C) 18.4 18.4 18.9 19.6 21.1 22.1 23.7 23.1 22 21.4 19.6 18.4 18.4 3 Chlef Max (°C) 23.6 23.5 24.8 25.6 26.8 28.9 29.5 29.4 28.2 27.3 25.1 24.1 29.5 Min (°C) 18.6 18.5 19.8 20.6 21.8 23.9 24.5 24.4 23.2 22.3 20.1 19.1 18.5 4 Setif Max (°C) 21.7 21.7 23.1 24.2 25.3 27.3 28.4 28.2 26.6 25.4 23.5 22 28.4 Min (°C) 18.4 18.4 18.4 19.2 20.3 22.3 23.4 23.2 21.6 20.4 18.5 17 18.4 5 Biskra Max (°C) 24 24.3 25.7 27 28.6 30.1 30.6 30.6 29.1 27.7 25.47 24.2 30.6 Min (°C) 19 19.3 20.7 22 23.6 25.1 26.1 25.9 24.1 22.7 20.4 19.2 19 6 Bechar Max (°C) 23.5 24.2 25.6 27.3 28.2 29.8 30.6 30.9 29.2 27.5 24.7 23.3 30.6 Min (°C) 18.5 19.2 20.6 22.3 23.2 24.8 26.2 25.9 24.2 22.5 19.7 18.4 18.4 7 Adrar Max (°C) 24.3 25.7 26.9 28.2 30.1 30.6 30.6 30.6 30.5 28.8 26.1 24.5 30.6 Min (°C) 19.3 20.7 21.9 23.2 25.1 26.3 27.2 26.9 25.5 23.8 21.1 19.5 19.3
8 Tamanrasset (in Guezzam) Max (°C) 26 27.1 29 30.1 30.6 30.6 30.6 30.6 30.6 29.6 28.4 27.2 30.6
Min (°C) 21 22.1 24 25.1 26.6 26.8 26.5 26.2 26.1 24.6 23.4 22.2 21
Table 5
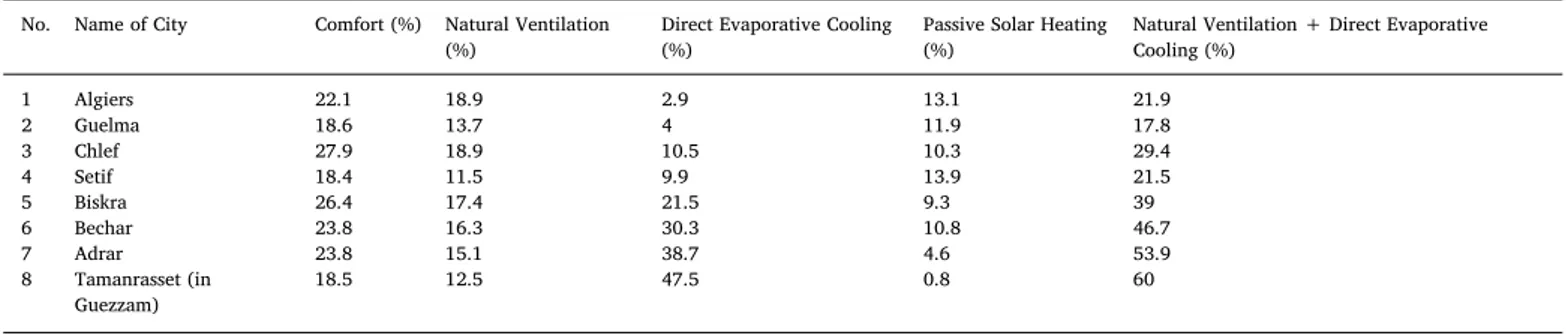
Annual potential (%) of thermal comfort and passive heating/cooling strategies for the eight selected locations. No. Name of City Comfort (%) Natural Ventilation
(%) Direct Evaporative Cooling(%) Passive Solar Heating(%) Natural Ventilation + Direct EvaporativeCooling (%)
1 Algiers 22.1 18.9 2.9 13.1 21.9 2 Guelma 18.6 13.7 4 11.9 17.8 3 Chlef 27.9 18.9 10.5 10.3 29.4 4 Setif 18.4 11.5 9.9 13.9 21.5 5 Biskra 26.4 17.4 21.5 9.3 39 6 Bechar 23.8 16.3 30.3 10.8 46.7 7 Adrar 23.8 15.1 38.7 4.6 53.9 8 Tamanrasset (in Guezzam) 18.5 12.5 47.5 0.8 60
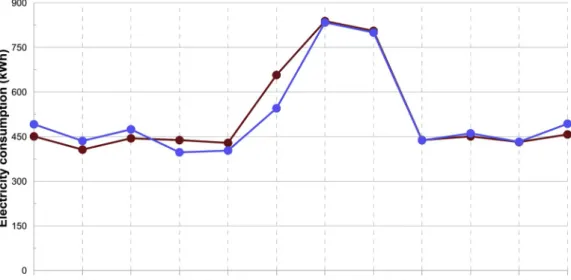
simulation model was calibrated using hourly data.
Fig. 9shows the comparison between the measured and simulated energy consumptions during the monitored periods. For the electricity consumption, the MBE is - 0.6% and the CV(RMSE) is 7.8%, while the admitted limit is ± 5% and ± 15%, respectively. For the gas con-sumption, the MBE is 0.4% and the CV(RMSE) is 6.6%, while the ad-mitted limit is ± 5% and ± 15%, respectively. The model MBE and CV (RMSE) values for the monthly data are within ASHRAE-recommended hourly values. The simulation model was calibrated using monthly data, which validate it.
4.3. Energy loads for the eight selected locations
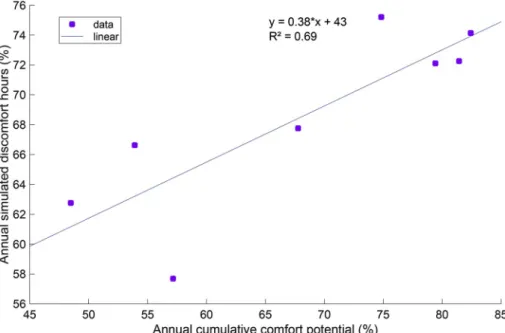
4.3.1. Annual cumulative comfort potential and simulated discomfort hours
The annual cumulative comfort potential represents the percentage of time during the year during which comfort is achieved by using passive strategies (Natural Ventilation (NV), Direct Evaporative Cooling (DEC), and Passive Solar Heating (PSH)). The annual simulated dis-comfort hours indicate the percentage of time during the year during which passive or active strategies are necessary to achieve comfort. Fig. 10shows the comparison between the annual cumulative comfort Fig. 6. Annual thermal comfort potential (%) for the eight selected locations.
Fig. 7. Annual passive design potential (%) for the eight selected locations. (a) natural ventilation, (b) direct evaporative cooling, (c) passive solar heating, and (d) natural ventilation and direct evaporative cooling.
potential (estimated potential) and annual simulated discomfort hours for the eight selected locations.
The combination of the bioclimatic strategies in Adrar has a comfort potential of 82%. This is the highest value compared with the other locations. However, the simulation result lowers the potential comfort estimation coverage to ∼75%. In fact, the simulation results indicate that Adrard, Bechar, Tamanrasset, and Biskra have a potential of 75% to passively achieve thermal comfort. On the other hand, nearly 48.5% of the total annual hours are potentially comfortable if all passive strategies would be combined in Guelma. This is the lowest value compared with the other locations. However, the simulation result in-creases the potential comfort estimation coverage to ∼63%. The comfort potential calculation and simulation analysis for Chlef and Algiers yield almost identical results, as shown inFig. 11.
To determine the correlation between the psychrometric-based and simulation-based analysis results,Fig. 12shows the results of the linear regression analysis between the annual cumulative comfort potential and annual simulated discomfort hours. The regression analysis be-tween the annual cumulative comfort potential and annual simulated discomfort hours indicates a strong correlation, with a Pearson corre-lation coefficient (R) of 0.8 and regression coefficient (R2) of 0.6 (Table 7).
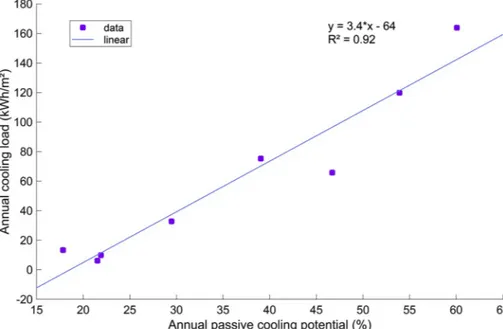
4.3.2. Annual passive cooling potential and annual cooling load
The annual passive cooling potential represents the addition of the
annual natural ventilation and annual evaporative cooling potential. This value indicates the period of time during which cooling is required and thus the cooling energy consumption.Fig. 13shows the comparison between the annual passive cooling potential (estimated cooling po-tential based on the psychrometric chart) and annual cooling load (si-mulated cooling load) for the eight selected locations. Tamanrasset has the highest annual passive cooling potential (60%) as well as the highest annual cooling energy consumption (163.9 kWh/m2) compared with the other locations. Guelma, Setif, and Algiers have the lowest passive cooling potentials (between 17.8% and 21.9%) as well as the lowest cooling loads (6.1 kWh/m2for Setif, 9.9 kWh/m2for Algiers, and 13.3 kWh/m2for Guelma).Fig. 14shows the results of the linear re-gression analysis between the annual passive cooling potential and annual cooling load for the eight selected locations. The regression analysis between the annual cooling potential and annual cooling load indicates a strong correlation, with a Pearson correlation coefficient (R) of 0.96 and regression coefficient (R2) of 0.9 (Table 7).
4.3.3. Annual passive solar heating potential and annual heating load
The passive solar heating potential indicates the period of time during which heating is required and thus the heating energy con-sumption.Fig. 15shows the comparison between the annual passive heating potential (estimated heating potential) and annual heating load (simulated heating load) for the eight selected locations. The passive solar heating potential of all locations is low and does not exceed 14%. Table 6
Summary of the validation of the calibration criteria of the simulation model.
Validation criteria Winter indoor air temperature Summer indoor air temperature Monthly electricity consumption Monthly gas consumption
MBE (%) −2 −1.5 −0.6 0.4
CV (RMSE) (%) 5.1 4.9 7.8 6.6
Setif has the highest annual passive heating potential (13.9%) as well as the highest annual heating energy consumption (180.8 kWh/m2) com-pared with the other locations. Tamanrasset has the lowest passive heating potential (0.8%) as well as the lowest heating load (5.1 kWh/ m2).Fig. 16shows the results of the linear regression analysis between the annual passive heating potential and annual heating load for the eight selected locations. The regression analysis between the annual heating potential and annual heating load indicates a strong correla-tion, with a Pearson correlation coefficient (R) of 0.88 and regression coefficient (R2) of 0.7 (Table 7).
5. Discussion
5.1. Summary of the main findings
In this study, we performed a climatic analysis of eight Algerian cities to assess the effectiveness of bioclimatic design strategies. We applied a mixed approach that combines psychometric chart analysis and building performance simulation analysis. By using recent and
high-quality weather datasets, we quantified the effectiveness of bio-climatic design strategies based on an accurate and modern approach using a recent adaptive comfort model (ASHARE 55–2017). Our study findings indicate that psychrometric chart-based bioclimatic potential analysis for all investigated locations does not correspond with the si-mulation-based energy and comfort analysis (seeTable 8). For example, the estimation of the discomfort hours in Algiers is almost identical, (57% and 58%), when calculated using both approaches. This result agrees with the results of Ali-Toudert et al. [37] who evaluated the A and D climate zones. The cumulative comfort potential analysis results (using psychrometric charts and building performance simulations) for almost all cities are almost identical, except for Setif and Guelma for which the psychrometric charts indicate a significant underestimation of the discomfort hours compared with the simulation results (see Fig. 10).
To summarize the major simulation-based findings, we list the most important and tangible outcomes of our bioclimatic analysis of the thermal comfort (seeTable 8):
•
Based on our simulation, Guelma, Setif, and Algiers have common summer discomfort hours ranging between 7% and 10%, while the winter discomfort hours range between 51% and 60%.•
Chlef, Bechar, Biskra, and Adrar have summer discomfort hours ranging between 25% and 49%, while the winter discomfort hours range between 26% and 43%.Surprisingly, Chlef, which is located in the north of Algeria (Zone B′), has the same discomfort hours per-centage as Zone D in the south of Algeria (desert).•
The percentage of summer discomfort hours in Tamanrasset is above 67%, while that of the winter discomfort hours is below 5%. This result can be explained by the solar radiation parameter, which is very high in this zone. It can exceed 7000 Wh/m2, which was con-firmed by Yaiche et al. (2014) [40].Our bioclimatic analysis results regarding the passive cooling po-tential are listed below:
•
The bioclimatic potential analysis overestimates the cooling needs of most locations, except for Adrar and Tamanrasset.•
Regarding the passive cooling, our annual cooling load calculation indicates that Adrar and Tamanrasset are the locations with the highest amounts, with cooling requirements as reported by Ghedamsiet al. (2016) [36]. Tamanrasset is followed by Bechar, Biskra, and Chlef.•
The locations with the least cooling requirements are grouped and include Algiers, Setif, and Guelma because they more easily receive humid winds from the sea (seeFig. 13andTable 8) [51].Fig. 10. Comparison between the annual cumulative comfort potential (%) and annual simulated discomfort hours (%).
Fig. 12. Linear regression of the annual cumulative comfort potential (%) and annual simulated discomfort hours (%). Table 7
Summary of the validation of the linear regression between the annual bioclimatic potential and annual energy loads.
Validation criteria R (Pearson correlation coefficient) R2(Regression coefficient)
Passive cooling potential/cooling load 0.9 0.9
Passive heating potential/heating load 0.8 0.7
Cumulative comfort potential/simulated discomfort hours 0.8 0.6
Fig. 14. Linear regression of the annual passive cooling potential (%) and annual cooling load (kWh/m2).
The direct evaporative cooling represents the most effective strategy in the south of Algeria (Zones D and D’) because the climate in the south is hot and dry (warm climate with very high temperatures during summer). The evaporative cooling potential exceeds 50%. In addition, the direct evaporative cooling potential of the climate increases as the location geographically changes from the north towards the south of Algeria. The evaporative cooling potential is very low (< 4%) in the north (Zones A and B) because these zones are exposed to the sea. However, these zones have the highest natural ventilation potential.
With respect to the passive heating potential, there is a significant difference between the potential estimation and calculation of the heating needs for Setif and Guelma. Our results indicate that the dif-ference of the bioclimatic potential between stations in the same zone is significant although some locations are in the same climate zone (see Table 8). Our bioclimatic analysis results regarding the passive heating potential are listed below:
•
The annual heating load calculation indicates that Setif has the highest heating load requirements due to its geographical location and altitude.•
Setif is followed by Algiers, Guelma, and Chlef, which form a group with similar heating load requirements.•
Bechar, Biskra, and Adrar benefit slightly less from passive heating.•
Tamanrasset is an extreme, where passive heating is the least ef-fective because Tamanrasset is influenced by solar irradiation (see Fig. 15andTable 8).•
The heating loads in the south represent 30% of the cooling loads. In contrast, the cooling loads in the north represent 11% of the heating loads, which agrees with the results obtained by Ghedamsi et al. (2016) [36], Kharchi et al. (2012) [52], and Belkacem et al. (2017) [53].5.2. Strength and limitations of the study
The strength of the study relates to the use of a recent approach that combines simple chart-based bioclimatic analysis with simulation based advanced building performance analysis. The study uses high-quality data based on a recently compiled climatic dataset for Algerian weather stations. We believe that this recent approach, which was already used by Kumar et al. (2016) and Kishore et al. (2018) [16,17] and resembles similar approaches of Attia et al. (2019) [8], Pajek et al. (2018) [12], and Ali-Toudert et al. (2017) [37], benefits from the abundance of weather station data, advancements of simulation approaches and computational power, and advancement of the definition of adaptive comfort standards for hot climates. Our study is the first study that provides an accurate estimation of the bioclimatic potential for the whole country of Algeria in contrast to previous research (Ali-Toudert et al. [37]) that focused on specific climate zones of Algeria.
The quantification of the effectiveness of the bioclimatic strategies based on recent weather provided insights into the bioclimatic design potential for the six climatic zones of Algeria. Based on the use of the calibrated simulation model, reliable results could be obtained Fig. 16. Linear regression of the annual passive heating potential (%) and annual heating load (kWh/m2).
Table 8
Summary of the findings.
Climate Zone A B B′ C D D D D′
Representative location Algiers Guelma Chlef Setif Biskra Bechar Tamanrasset (in Guezzam) Adrar
Estimation Annual passive cooling potential (%) 21.9 17.8 29.4 21.5 39 46.7 60 53.9
Annual passive solar heating potential (%) 13.1 11.9 10.3 13.9 9.3 10.8 0.8 4.6 Annual cumulative comfort potential (%) 57.1 48.4 67.7 53.9 74.8 81.4 79.4 82.4
Simulation Annual cooling load (kWh/m2) 9.9 13.3 32.8 6.1 75.3 65.8 163.8 119.8
Annual heating load (kWh/m2) 108.5 123.6 89 180.7 64.5 69.1 5.1 41
regarding the thermal building performance and associated con-sequences of active heating and cooling system requirements.
On the other hand, this study has several limitations. Our reference case does not represent different housing typologies and is not adapted to the climate of each climatic zone. In addition, the calibration period of the simulation model is only one week for indoor temperatures and one year for electricity readings using a manual trial-and-error-based calibration approach. The study could have benefited from a longer monitoring period (three to five years) and an automated calibration using annual hourly data. However, we conducted our study using the best available data.
5.3. Implications for the practice and future research
The study results help to identify which bioclimatic design strategy is the most effective in each climate zone. We believe that architects and building engineers can apply our findings to their design concepts in early design stages to improve the indoor thermal comfort using passive design solutions. The presented tables and figures allow de-signers to apply adequate bioclimatic design strategies and evaluate the need for active systems in each climate zone using an adaptive comfort model that is suitable for the hot climate of Algeria. Another important implication of our study is that it calls for the creation of a new bio-climatic comfort map with more representative weather stations. Our study confirms that the current climatic classification of Algeria is ob-solete. The National Building Efficiency Standard of Algeria must be updated. Therefore, we believe that the engagement with code officials to adopt and implement our findings and recommendations will anchor the impact of our study in the professional practice of building energy efficiency. Future research should focus on investigating the thermal comfort in each climatic zone of Algeria and developing climate specific design recommendations.
6. Conclusion
The bioclimatic potential of the six climate zones, including eight cities of Algeria, was calculated and compared using psychrometric charts and building performance simulations. A monitoring-based si-mulation model was created and calibrated for a reference case in-cluding eight Algerian cities. Despite the strong correlation between both bioclimatic potential analysis approaches (psychrometric chart-based and simulation-chart-based), the results indicate a contradictions of bioclimatic potential estimations in several heating-dominated cities such as Setif, Guelma, and cooling dominated cities such as Tamanrasset. Therefore, our study findings indicate the misleading nature of psychrometric-based bioclimatic potential analysis in all cooling-dominated cities and all heating dominated cities. Overall, Algerian cities can be classified into two major categories including cooling- or heating-dominated cities. The percentage of average dis-comfort hours in Algerian households across all climatic zones is 60%. Evaporative cooling is the most effective bioclimatic design strategy in Algeria, accounting for 60% of the hours annually in cooling-dominated cities due to their arid nature. Passive solar heating is the most effective bioclimatic design strategy in Algeria, accounting for 40% of the hours annually in heating-dominated cities due to their high altitudes. Our study confirms the need for a new bioclimatic zoning map for Algeria.
The following design recommendations characterize the bioclimatic conditions of each investigated city and provide guidance regarding the most effective passive design strategies based onTables 1 and 5:
1. Algiers has a subtropical Mediterranean climate with dry summers. Natural ventilation and direct evaporative cooling are the most ef-fective during summer and passive solar heating is the most efef-fective during winter.
2. Guelma has a Midetereanan climate and is moderately rainy with colder and longer winters than those on the coast with hot and less humid summers. Natural ventilation and passive solar heating are effective in summer and winter, respectively.
3. Chlef has a subhumid and Mediterranean climate with cold winters and hot summers. The cooling period is long, accounting for 56% of the annual hours. Natural ventilation is the most effective during summer, followed by direct evaporative cooling. In winter, passive solar heating is the most effective strategy.
4. Setif has a continental climate with hot dry summers and very cold dry winters. In winter, passive solar heating is the most effective. In summer, natural ventilation and direct evaporative cooling are the most effective.
5. Biskra has an arid climate with the high temperature disparity be-tween day and night as well as bebe-tween summer and winter. Direct evaporative cooling is the most effective strategy in the summer, followed by natural ventilation. However, passive solar heating is the most effective in the winter. The duration of the heating period is equal to that of the cooling period.
6. Bechar has an arid climate with a high temperature disparity be-tween day and night as well as bebe-tween summer and winter. Direct evaporative cooling is the most effective strategy in summer, fol-lowed by natural ventilation. However, passive solar heating is needed in winter. The duration of the heating period is the same as that of the cooling period.
7. Adrar has an arid climate with dry and very hot summers and very cold winters. Direct evaporative cooling is the most effective strategy in summer, followed by natural ventilation. However, passive solar heating is needed in winter. The heating period ac-counts for 52% of the annual hours.
8. Tamanrasset has very dry or hyperarid and sunny climate all year round. Direct evaporative cooling is the most effective strategy in summer and passive solar heating is unnecessary in winter.
Acknowledgements
We acknowledge the Algerian Ministry of Higher Education for providing a funded internship to the first author at the University of Liege through the “Programme National Exceptionnel (PNE)” under file no. 23/enseignant/Belgique/2018–2019.
This article is published with the financial support of the Fonds de la Recherche Scientifique-FNRS.
We would like to acknowledge the LACOMOFA Laboratory, University of Biskra, and the Sustainable Building Design (SBD) Laboratory at the University of Liege for the use of the monitoring equipment in this research and valuable support during the experiments and data analysis. Also, the authors thank Arch. Moussi H. for providing the technical drawings of the case study building.
Appendix A
Appendix B. Supplementary data
Supplementary data to this article can be found online athttps://doi.org/10.1016/j.buildenv.2019.106271.
References
[1] S. Attia, Net Zero Energy Buildings (NZEB): Concepts. Frameworks and Roadmap for Project Analysis and Implementation, Elsevier, 978-0128124611, 2018,https:// doi.org/10.1016/c2016-0-03166-2.
[2] F. Manzano-Agugliaro, F.G. Montoya, A. Sabio-Ortega, A. García-Cruz, Review of bioclimatic architecture strategies for achieving thermal comfort, Renew. Sustain. Energy Rev. 49 (2015) 736–755.
[3] R.J. de Dear, T. Akimoto, E.A. Arens, G. Brager, C. Candido, K.W.D. Cheong, ... J. Toftum, Progress in thermal comfort research over the last twenty years, Indoor Air 23 (6) (2013) 442–461.
[4] S. Carlucci, L. Bai, R. de Dear, L. Yang, Review of Adaptive Thermal Comfort Models in Built Environmental Regulatory Documents, Building and Environment, 2018. [5] 1 November 2018, A. Pérez-Fargallo, J.A. Pulido-Arcas, C. Rubio-Bellido,
M. Trebilcock, B. Piderit, S. Attia, Development of a new adaptive comfort model for low income housing in the central-south of Chile, Energy Build. 178 (2018) 94–106 0378-7788https://doi.org/10.1016/j.enbuild.2018.08.030.
[6] Y. Chen, Z. Tong, A. Malkawi, Investigating natural ventilation potentials across the globe: regional and climatic variations, Build. Environ. 122 (2017) 386–396. [7] GhR. Roshan, M. Farrokhzad, S. Attia, Defining thermal comfort boundaries for
heating and cooling demand estimation in Iran's urban settlements, Build. Environ. 121 (2017) 168–189 0360-1323https://doi.org/10.1016/j.buildenv.2017.05.023. [8] S. Attia, T. Lacombe, H.T. Rakotondramiarana, F. Garde, G.R. Roshan, Analysis tool
for bioclimatic design strategies in hot humid climates, Sustain. Cities Soc. 46 (2019),https://doi.org/10.1016/j.scs.2018.11.025April 2019. p 88-24. [9] Autodesk, Ecotect Weather Tool. Version 8, (2019).
[10] M. Milne, R. Liggett, R. Al-Shaali, Climate consultant 3.0: a tool for visualizing building energy implications of climates, Proceedings of the Solar Conference, vol. 1, 2007.
[11] M. Milne, Climate Consultant V6. 0, (2016).
[12] L. Pajek, M. Košir, Implications of present and upcoming changes in bioclimatic potential for energy performance of residential buildings, Build. Environ. 127 (2018) 157–172.
[13] A. Krishan (Ed.), Climate Responsive Architecture: a Design Handbook for Energy Efficient Buildings, Tata McGraw-Hill Education, 2001.
[14] S. Visitsak, J.S. Haberl, An Analysis of Design Strategies for Climate-Controlled Residences in Selected Climates, (2004).
[15] June 2012, S. Attia, E. Gratia, A. De Herde, J. Hensen, Simulation-based decision support tool for early stages of zero-energy building design, Energy Build. 49 (2012) 2–15,https://doi.org/10.1016/j.enbuild.2012.01.280378-7788.
[16] S. Kumar, J. Mathur, S. Mathur, M.K. Singh, V. Loftness, An adaptive approach to define thermal comfort zones on psychrometric chart for naturally ventilated buildings in composite climate of India, Build. Environ. 109 (11) (2016) 135–153. [17] N. Kishore, J. Rekha, A Bioclimatic Approach to Develop Spatial Zoning Maps for
Comfort. Passive Heating and Cooling, (2018).
[18] D. Watson, K. Labs, Climatic Building Design: Energy- Efficient Building Principles and Practice, McGraw-Hill. Inc., New York. NY, 1983.
[19] D.P. Gatley, Psychrometric chart celebrates 100th anniversary, ASHRAE J. 46 (11) (2004) 16.
[20] V. Olgyay, Design with Climate: Bioclimatic Approach to Architectural Regionalism-New, and expanded Edition, Princeton university press, 2015. [21] M. DeKay, G.Z. Brown, Sun. Wind. And Light: Architectural Design Strategies, John
Wiley & Sons, 2013.
[22] M. Milne, B. Givoni, Architectural design based on climate, in: D. Watson (Ed.), Energy Conservation through Building Design, McGrawHill. Inc., New York. NY, 1979, pp. 96–113.
[23] M. Milne, S. Yoshikawa, SOLAR-5: an interactive computer-aided passive solar design system, Proceedings of the 3rd Annual Passive Solar Conference. AS/ISES. San Jose. CA. January, 1979.
[24] S.V. Szokolay, Climate analysis based on the psychrometric chart, Int. J. Ambient Energy 7 (4) (1986) 171–182.
[25] P. La Roche, R. Liggett, Very simple design tools: a web based assistant for the design of climate responsive buildings, Architect. Sci. Rev. 44 (4) (2001) 437–448. [26] A.H.A. Mahmoud, An analysis of bioclimatic zones and implications for design of
outdoor built environments in Egypt, Build. Environ. 46 (3) (2011) 605–620. [27] L. Guan, M. Bennett, J. Bell, Evaluating the potential use of direct evaporative
cooling in Australia, Energy Build. 108 (2015) 185–194.
[28] M.M. Osman, H. Sevinc, Adaptation of Climate-Responsive Building Design
Strategies and Resilience to Climate Change in the Hot/Arid Region of Khartoum. Sudan, Sustainable Cities and Society, 2019, p. 101429.
[29] M.C. Katafygiotou, D.K. Serghides, Bioclimatic chart analysis in three climate zones in Cyprus, Indoor Built Environ. 24 (6) (2015) 746–760.
[30] L. Pajek, M. Košir, Can building energy performance be predicted by a bioclimatic potential analysis? Case study of the Alpine-Adriatic region, Energy Build. 139 (2017) 160–173.
[31] A.S.F. Ahmed, K.M.M.K. Khan, A.A.M.T. Oo, R.M.G. Rasul, Selection of suitable passive cooling strategy for a subtropical climate, Int. J. Mech. Mater. Eng. 9 (1) (2014) 14.
[32] GhR. Roshan, A.A. Ghanghermeh, S. Attia, Determining new threshold tempera-tures for cooling and heating degree day index of different climatic zones of Iran, Renew. Energy 101 (2016) 156–167 ISSN 0960-1481https://doi.org/10.1016/j. renene.2016.08.053.
[33] P. De Wilde, Building Performance Analysis, John Wiley & Sons, 2018. [34] M. Khoukhi, N. Fezzioui, Thermal comfort design of traditional houses in hot dry
region of Algeria, Int. J. Energy Environ. Eng. 3 (1) (2012) 5.
[35] K. Imessad, L. Derradji, N.A. Messaoudene, F. Mokhtari, A. Chenak, R. Kharchi, Impact of passive cooling techniques on energy demand for residential buildings in a Mediterranean climate, Renew. Energy 71 (2014) 589–597.
[36] R. Ghedamsi, N. Settou, A. Gouareh, A. Khamouli, N. Saifi, B. Recioui, B. Dokkar, Modeling and forecasting energy consumption for residential buildings in Algeria using bottom-up approach, Energy Build. 121 (2016) 309–317.
[37] F. Ali-Toudert, J. Weidhaus, Numerical assessment and optimization of a low-en-ergy residential building for Mediterranean and Saharan climates using a pilot project in Algeria, Renew. Energy 101 (2017) 327–346.
[38] N.K. Khambadkone, R. Jain, A bioclimatic analysis tool for investigation of the potential of passive cooling and heating strategies in a composite Indian climate, Build. Environ. 123 (2017) 469–493.
[39] DTRC3-2, Thermal regulation of residential buildings e calculating methods for determining building heat losses, CNERIB, Algiers, 1997 [in French]www.cnerib. edu.dz.
[40] M.R. Yaiche, A. Bouhanik, S.M.A. Bekkouche, A. Malek, T. Benouaz, Revised solar maps of Algeria based on sunshine duration, Energy Convers. Manag. 82 (2014) 114–123.
[41] (ClimateOne 2019),http://climate.onebuilding.org.
[42] N. Fezzioui, M. Khoukhi, Z. Dahou, K. Aït-Mokhtar, S. Larbi, Bioclimatic archi-tectural design of ksar de kenadza: south-west area of Algeria hot and dry climate, Architect. Sci. Rev. 52 (3) (2009) 221–228.
[43] B. Givoni, Comfort. climate analysis and building design guidelines, Energy Build. 18 (1) (1992) 11–23.
[44] L. Derradji, K. Imessad, M. Amara, F.B. Errebai, A study on residential energy re-quirement and the effect of the glazing on the optimum insulation thickness, Appl. Therm. Eng. 112 (2017) 975–985.
[45] DOE, EnergyPlus Energy Simulation Software, Energy Efficiency & Renewable Energy. US Department of Energy, 2019 Available at:http://app1.eere.energy.gov/ buildings/energyplus/energyplus_about.Cfm, Accessed date: 25 March 2019. [46] M.D. Colton, P. MacNaughton, J. Vallarino, J. Kane, M. Bennett-Fripp,
J.D. Spengler, G. Adamkiewicz, Indoor air quality in green vs conventional multi-family low-income housing, Environ. Sci. Technol. 48 (14) (2014) 7833–7841. [47] A.C.K. Lai, K.W. Mui, L.T. Wong, L.Y. Law, An evaluation model for indoor
en-vironmental quality (IEQ) acceptance in residential buildings, Energy Build. 41 (9) (2009) 930–936.
[48] ASHRAE, Guideline 14-2002: Measurement of Energy and Demand Savings, ASHRAE, Atlanta. Georgia, 2002.
[49] DTRC3-4, Airconditioning - Calculating Methods for Determining Building Heat Gains, CNERIB, Algiers, 1997 [in French]www.cnerib.edu.dz.
[50] ASHRAE, ANSI/ASHRAE Standard 55-Thermal Environmental Conditions for Human Occupancy, American Society of Heating. Refrigerating and AirConditioning Engineers (ASHRAE), Atlanta. GA. USA, 2017 2017.
[51] S. Sahabi Abed, A. Matzarakis, Seasonal regional differentiation of human thermal comfort conditions in Algeria, Adv. Meteorol. 2017 (2017).
[52] R. Kharchi, B. Benyoucef, F. Mokhtari, K. Imessad, Dynamic simulation of both thermal and energetic behavior for dwellings located in Algiers, J. Earth Sci. Clim. Chang. 3 (122) (2012) 2.
[53] N. Belkacem, L. Loukarfi, M. Missoum, H. Naji, A. Khelil, M. Braikia, Assessment of energy and environmental performances of a bioclimatic dwelling in Algeria's North, Build. Serv. Eng. Technol. 38 (1) (2017) 64–88.