HAL Id: hal-01901000
https://hal.archives-ouvertes.fr/hal-01901000v2
Submitted on 5 Nov 2018
HAL is a multi-disciplinary open access
archive for the deposit and dissemination of
sci-entific research documents, whether they are
pub-lished or not. The documents may come from
teaching and research institutions in France or
abroad, or from public or private research centers.
L’archive ouverte pluridisciplinaire HAL, est
destinée au dépôt et à la diffusion de documents
scientifiques de niveau recherche, publiés ou non,
émanant des établissements d’enseignement et de
recherche français ou étrangers, des laboratoires
publics ou privés.
Progressive sequential pattern mining: steerable visual
exploration of patterns with PPMT
Vincent Raveneau, Julien Blanchard, Yannick Prié
To cite this version:
Vincent Raveneau, Julien Blanchard, Yannick Prié. Progressive sequential pattern mining: steerable
visual exploration of patterns with PPMT. Visualization in Data Science (VDS at IEEE VIS 2018),
Oct 2018, Berlin, Germany. �hal-01901000v2�
Progressive Sequential Pattern Mining:
Steerable Visual Exploration of Patterns with PPMT
Vincent Raveneau*University of Nantes
Julien Blanchard† University of Nantes
Yannick Pri ´e‡ University of Nantes
Figure 1:The main interface of PPMT: (A) Information about the dataset, (B) history of the analyst’s actions, (G) information about
the state of the pattern mining algorithm and (H) discovered frequent patterns. Temporal visualization views present information from the dataset and the selected patterns: (D) overview of the data, (E) events and pattern occurrences, (F) user sessions and pattern occurrences. Analysts can select event types and users to highlight them in the temporal views. Selecting patterns adds their occurrences to the views. (C) A summary of the selections is always available.
ABSTRACT
The progressive visual analytics (PVA) paradigm has been proposed to describe visual analytics systems whose main goal is to reach a thorough coupling between the analyst and her system by getting rid of waiting periods classically encountered during data processing. PVA systems use algorithms that both provide intermediate results throughout their execution, and are steerable by the analyst to change the strategy used to perform the remaining computation. Our focus is on progressive sequential pattern mining, as in the seminal work of Stolper et al. [30]. Here we go further mainly by considering the temporal nature of patterns related to their occurrences. We propose a pattern-oriented data model, a pattern analysis task model, and guidelines for designing progressive pattern mining algorithms. We introduce PPMT, a tool to support analysts in their progressive exploration of activity traces, based on a modification of the GSP al-gorithm. We evaluate our proposal on the technical performances of our progressive algorithm, and on the effect of steering on analysts’ performances.
*e-mail: [email protected] †e-mail: [email protected] ‡e-mail: [email protected]
Index Terms: Human-centered computing—Visualization— Visualization systems and tools—Visual analytics; Information systems—Information systems applications—Data mining
1 INTRODUCTION
Even though the available computing power continuously increases, classical data analysis systems still impose waiting times to ana-lysts, due to the amount of data needed to be processed, and to the complexity of the involved algorithms. Based on incremental visual-ization, the progressive visual analytics (PVA) paradigm has been proposed by Stolper et al. [30] to alleviate these difficulties through the use of intermediate results and steerable algorithms. Several PVA systems have been proposed for various data and algorithms [4, 30]. In this paper, we focus on pattern mining techniques for PVA, and more precisely sequential pattern mining, i.e. extracting patterns from temporal data.
Sequential patterns can be viewed as sequences of events that occur frequently in temporal data. Identifying and interpreting such structures allows one to draw insights and knowledge about recur-ring behaviors in the dataset, which corresponds to the last stages of the data science pipeline (explore and communicate data) [11]. Sequential patterns were already used for PVA in the work of Stolper et al., who proposed a pattern exploration tool to illustrate the PVA paradigm. As their paper was focused on formulating a general definition of PVA, independently of the algorithmic techniques in use, they did not take into account the temporal nature of sequential
patterns, only considering them as objects described by a name and some numerical statistical attributes. However, an analyst exploring data with sequential patterns is involved in a temporal data explo-ration activity, which implies tasks such as localizing occurrences in time, checking their duration, frequency or periodicity, and many more [1, 18].
In this paper we study the design of a PVA system for exploring temporal data using sequential pattern mining algorithms, taking into account these time-related considerations. We first investigate the actions an analyst working with sequential patterns may want to perform, based on an existing temporal data analysis task model [1]. We then propose some requirements on how to design a progressive pattern mining algorithm. We also present a working progressive version of the classical GSP pattern mining algorithm. We describe PPMT, our PVA tool for activity data analytics which integrates our modified version of GSP. Eventually, we report on the results of two studies: one about the performances of the progressive algorithm, and the other about evaluating analysts’ steering interactions with the algorithm within PPMT.
In summary, our contributions are the following:
• A data and task model for an analyst exploring temporal data with patterns, instantiated from the general model of Andrienko and Andrienko [1].
• Five guidelines for designing a progressive algorithm for se-quential pattern mining.
• A pattern-based data exploration tool named PPMT, that im-plements a progressive sequential pattern mining algorithm featuring two new kinds of steering (towards sequence and time).
• An evaluation of our contribution both on the technical side of our progressive algorithm, and on the effect of steering on analysts performances, pointing towards the relatively low impact of progressiveness on execution time, and the increased rapidity of analysis for question answering.
2 RELATED WORK
2.1 Mining sequential patterns
Sequential patterns are extracted from sequential data, i.e. a col-lection of symbolic event sequences. An event has at least two properties: a type that describes the event characteristics, and a timestampstating when the event occurred. In its simplest form, a sequential pattern consists of an ordered list of event types (written ABCand the like in this paper). It has two properties: a size, the number of these event types, and a support, the number of occur-rencesof the pattern in data. Pattern mining algorithms only extract patterns that have a support at least equal to a user-given threshold, called frequent patterns. Other user-given parameters are used to constrain the search for patterns, such as their occurrences maximum durations. Since we focus on this kind of patterns, the terms pattern and sequential pattern will be used with the meaning of frequent sequential patternin this paper.
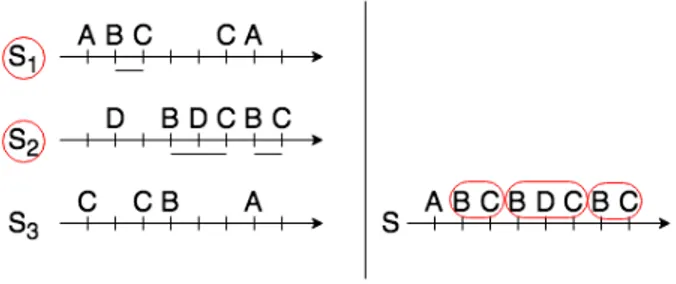
Two kinds of sequential patterns are present in the literature, differing in the data structure analyzed and the way patterns’ occur-rences are counted, as illustrated in figure 2. Sequential patterns, proposed by Srikant and Agrawal [29], are extracted from a set of sequences. Counting the occurrences of a sequential pattern consists in counting the number of sequences in which it is found, regardless of how many times it is present in each sequence. Episodes, pro-posed by Mannila et al. [20], are extracted from a single sequence. Counting the occurrences of an episode consists in counting the number of times it appears in the sequence from beginning to end.
Many pattern mining algorithms for sequential data have been proposed, that can be classified in two categories. Apriori-like algorithms, such as GSP [29], PSP [22], SPADE [33], SPAM [3],
Figure 2: Occurrences of BC as sequential pattern (left) and episodes (right). The occurrences are coloured in red. The sequential pattern BC has 2 occurrences in the left dataset, while the episode BC has 3 occurrences in the right dataset.
LAPIN [32], WINEPI [21] and MINEPI1[19] generate candidate patterns and check them by scanning data to determine if they are frequent or not. The candidates are generated by extending shorter frequent patterns with frequent event types. These algorithms can either do a breadth-first search for frequent patterns, where they will generate and check all the candidates of a given size before moving on to longer ones, or they can do a depth-first search. In this case, they will try to extend a given prefix as much as possible, before moving on to another one.
FP-Growthalgorithms, such as FreeSpan [13], PrefixSpan [26] and SLPMiner [28] build a tree-like compressed representation of the data called the FP-tree. If it fits into memory, this representation is then used to extract the frequent patterns faster than with Apriori-like approaches. The construction of the FP-tree is however time-consuming.
2.2 Interactive and visual pattern mining
Goethals et al. [10] designed a system for interactive visual pattern mining. They did not propose a steerable algorithm, but their system was interactive enough to allow the user to alternate mining sessions and pattern exploration sessions. Their approach heavily relied on statistical interestingness measures for rules and itemsets. Van Leeuwen stressed the need to integrate the analyst into the pattern mining pipeline [31]. He insisted on the importance of exploiting user feedback and learning subjective interestingness, and suggested to use pattern set mining techniques instead of classical patterns.
Other researchers worked on how to improve post-analysis of algorithms results, mainly through visualizations. Among the pro-posed solutions one can find graphs [6, 9], matrices [12, 15], or scatter plots [16]. However, only a few works deal with pattern representations, such as Liu et al. [17]. The number of work tackling pattern occurrence representations is also small, and usually in very specific cases, such as medical data with Monroe et al. [23] or Kwon et al. [14].
Note that all these works concern classical patterns but not tem-poral patterns.
2.3 Progressive Visual Analytics
Building on incremental visualization works [2, 7], Stolper et al. have proposed Progressive Visual Analytics (PVA) as a paradigm to describe visual analytics systems whose main goal is to reach a thorough coupling between the analyst [30]. PVA revolve around three core aspects, (1) designing analytic algorithms able to produce meaningful partial results during their execution, (2) being able to steer the remaining execution of these algorithms, and (3) having vi-sual interfaces allowing to manage the partial results without altering the analyst’s cognitive workflow. [30] provides some guidelines on
1WINEPI and MINEPI extract episodes, while the others extract sequen-tial patterns
how to design such systems, that have been enhanced and completed by other works [4, 25, 34].
A few progressive systems have been presented in the literature, such as Stolper et al.’s ProgressiveInsights [30] (described in the next paragraph) and Badam et al.’s InsightsFeed [4]. InsightsFeed was designed to allow an analyst to perform progressive analytics over Twitter data. It creates chunks of tweets that are processed when they reach a certain size. Several computations are performed, like sentiment classification and keyword extraction, and a map of these information is constructed using clustering (k-means) and dimensionality reduction (t-SNE projection). Users can control the execution of the algorithms by pausing them or going back to previous steps. The remaining computation can be steered by changing data chunk size, update speed, or clustering and projection parameters, the new value being taken into account for the next computation step.
To our knowledge, only Stolper et al. have used patterns in PVA [30]. Their system ProgressiveInsights allows an analyst to explore the outputs of a progressive version of Ayres et al.’s SPAM pattern mining algorithm [3]. Progressively extracted patterns are presented with a scatterplot and in lists ordered by the patterns’ properties. This limits the exploration and interpretation to these properties, the analyst being unable to get access to individual occurrences. Computation can be steered by prioritizing the search for patterns having a given prefix, or by ignoring the potential extensions of given prefixes.
As a conclusion, several ways of adding interactivity to an al-gorithm’s execution have been suggested. The interactive mining community proposed techniques where the execution runs, stops, then restarts or continues after an action from the analyst, tending to favor confirmatory analysis at the cost of potential unexpected discoveries. In PVA’s approach the algorithm is less relying on the analyst for its execution, while still offering the possibility to steer the computation at will. The only work involving patterns is an illustration of the definition of PVA [30]. However its handling of patterns does not fully take into account the temporal nature of their occurrences. In the remainder of this paper we present our work towards a better integration of such particularity in PVA.
3 PROGRESSIVE PATTERN MINING
In this section we present our vision for progressive pattern mining. Patterns are useful to understand the data they were discovered in, so we first investigate the tasks one may want to perform with patterns. We then reflect on this list, to determine how some of its elements can be part of a progressive data analysis workflow. This leads us to identify guidelines for designing progressive pattern mining algorithms.
3.1 Sequential pattern analysis tasks
Several models of the tasks an analyst can perform while working on data have been proposed [1, 5]. Andrienko and Andrienko [1] proposed a general model for high level tasks, that we instantiate considering an analyst exploring sequential patterns discovered in data. The reason we chose this specific model is that it has been designed to focus on analysis tasks one may specifically perform on temporal data. Moreover, the model is formal and exhaustive, with respect to the data representation used. We present the original general modelfrom [1], along with our pattern-oriented model. 3.1.1 Data representation
General model: A dataset is made of two types of variables, the referrersand the attributes. The referrers are the dimensions of the data, while the attributes store the values which appear at the intersection of the referrers. For each combination of values of the referrers, there is at most one combination of values for the
attributes. Thus, the data representation can be seen as a function from R1× R2× . . . Rp to A1× A2× . . . Aq where Ri is the value
domain of the ith referrer and Aiis the value domain of the ith
attribute. For example, in a demographic dataset, space and time are the referrers, respectively discretized by administrative districts and years. The attributes are the variables measured each year in each district, such as number of persons, number of unemployed persons, employment rate.
Pattern-oriented model: We identify three referrers and one at-tribute for temporal data exploration with sequential patterns:
• referrers: sequence, time and pattern. • attribute: occurrence
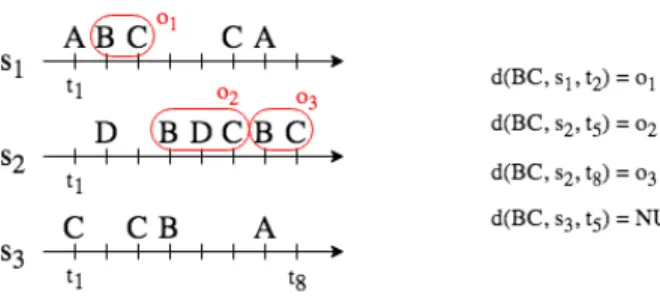
This corresponds to the basic purpose of an episode mining algo-rithm, which for any pattern searches for all its occurrences in any sequence at any time. The values of the variables sequence, pattern and occurrence can be seen as objects, referenced by an ID and described by properties allowing to designate sets of objects without indicating their IDs. For example:
• the sequences may be described by a category or their length (total duration);
• the patterns may be described by their syntax, their size (num-ber of event types), or an interest tag given by the analyst; • the occurrences may be described by their duration.
The time referrer is the usual time scale that can be continuous or discrete, with the many associated properties (day or night, weekend or not, name of the month, etc). While in our work we consider the values for this referrer to be points, we don’t see any important change when using ranges.
More precisely, in mathematical terms, the data representation for temporal datasets analyzed with patterns is this function d:
d P × S × T → O (p, s,t) 7→ o if o is an occurrence of p in s at time t whereT is the timescale, S is the set of data sequences, P is the set of all the patterns generated by the mining algorithm, andO is the set of all the occurrences identified by the mining algorithm. An example of how to use this model is given in figure 3, where three occurrences of a pattern BC are described with the d function.
Note that the representation proposed in this section encompasses not only the patterns but the whole dataset since data events can be seen as patterns of size 1. So the representation can be used both to answer questions about the dataset and the patterns that can be found inside.
Figure 3: Example of a small sequence dataset (left). On the right, some values for the data function d are given.
3.1.2 Tasks model
Andrienko and Andrienko provide an exhaustive task classification in 11 categories in their general model. All these categories also exist in our pattern-oriented model since our data representation is directly specialized from their general data model. Due to the lack of space, we do not present the 11 categories in details. We
rather provide illustrative examples related to patterns for the 6 most high-level tasks, which Andrienko and Andrienko consider to be the most performed during exploratory data analysis.
Synoptic direct lookup: Are the occurrences of pattern ABC uni-formly distributed over the sequences?
Synoptic inverse lookup: In sequence 15, during which time inter-vals does the pattern ABC occur regularly each 3 days ?
Synoptic direct comparison: Compare the temporal distributions of the occurrences of pattern ABC between sequences 1 and 2. Synoptic inverse comparison: For the sequences of the control group, compare the periods in which ABC collapses with the periods in which ADE rises.
Synoptic relation-seeking: In which sequences is the temporal distribution of ABC occurrences identical to the one in sequence 5? Connectional task: Is the activity in sequence 45 influencing the activity in sequence 71?
In theory, the 11 task categories are valid, and a system for ex-ploring temporal data with sequential patterns should support them all. However, this has to be adjusted, taking into account a strong dichotomy among the three referrers. The time values form a met-ric space, and the sequence values form a population, i.e. a set of elements that can reasonably be considered as independent (this is the usual statistical assumption). But both time and sequence allow to consider a distribution over them. For example, one may be interested in the distribution of the number of occurrences of pattern ABCover time, or over the set of sequences (this last distribution is made more readable by ordering the sequences). On the contrary, it is not appropriate to consider a distribution over the pattern referrer since patterns are clearly not independent. Larger patterns are built from the shorter ones, and some inclusion relations stand among them (e.g. AB is included into ABC), which introduces a bias into the distribution. This makes a big difference for the synoptic tasks, which consider a set of attribute values in its entirety by means of distributions (what Andrienko and Andrienko call a ”behaviour”, including temporal trends and spatial repartitions). We claim that the synoptic tasks involving a distribution over patterns are not rigorously correct in the general case, and may be misleading in practice, especially if the pattern population is not narrowly selected to avoid relations among patterns. Even though this affects the 6 synoptic task categories, all of them remain valid when consider-ing tasks involvconsider-ing a distribution over the other referrers. It will have consequences on the design of our system in section 4, by prioritizing time and sequences to structure the visualizations.
3.2 Guidelines for progressive pattern mining algo-rithms
We present guidelines for designing progressive algorithms for se-quential pattern mining. The guidelines G1, G2 and G4 directly result from the pattern-oriented model we just proposed.
G1: Extract episodes. As shown in the pattern-oriented model, the notion of occurrence is central when exploring temporal data with patterns. However, most of sequential pattern mining approaches belong to the tradition of Srikant and Agrawal works [24], which are looking for the sequences in which a pattern is found, rather than where the pattern is found in these sequences. That is why episode mining algorithms (cf. Mannila et al. [20] works) seem more ap-propriate for the exploration of a temporal dataset, as it allows to explore and analyze the context in which patterns occurrences are discovered. As episode mining deals with only one sequence, one needs to: either adapt an episode mining algorithm to read several se-quences (by summing the occurrences over the sese-quences); or adapt a sequential pattern mining algorithm to extract all the occurrences (by scanning sequences from beginning to end). The first solution is easier, but most of open source pattern mining algorithms mine sequential patterns.
G2: Save occurrences. The result of a pattern mining algorithm
is a set of frequent patterns with numbers of occurrences. More precisely, the pattern occurrences are identified and counted but not saved. For exploring temporal data by means of patterns, and in accordance with our pattern-oriented model, one needs to save the occurrences. This is a small change in the algorithm, but it largely increases the memory needs.
G3: Use a BFS Apriori-like strategy. Being able to provide inter-mediate results during the computation is mandatory for a progres-sive algorithm. With regards to pattern mining, this makes Apriori-like strategies better candidates to modification than FP-growth’s. Indeed, Apriori-like algorithms start checking candidates and gen-erating patterns right from the start of their execution, whereas FP-growth algorithms need to build the FP-tree before beginning generating any pattern. Furthermore, Stolper et al. [30] identified that breadth-first search strategies are preferable over depth-first ones for progressive pattern mining: since short patterns are the building blocks of the longer ones, focusing the early stages of the compu-tation on the extraction of short patterns gives a better overview of what can be expected later.
G4: Propose steering on patterns, sequences and time. We saw in section 3.1.1 that referrers are the access keys to the attributes. This justifies that algorithm steering should be done by letting the analyst focus on referrer values. Following the pattern-oriented task model we proposed, this means that the algorithm must be able to prioritize the occurrence search on some patterns, some sequences, or some time periods.
G5: Make the analyst aware of the algorithm activity. Since the analyst needs to interact with the algorithm, it is important that he had information at any time about what the algorithm has already done, or is currently doing. In the case of a pattern mining algorithm, important information are the current explored pattern size, the number of candidates of this size (both already checked and remaining), and whether steering is occurring or not (and its target). Other information might be of use, such as the speed at which the algorithm is performing its search for frequent patterns.
4 PPMT:APROGRESSIVEPATTERNMININGTOOL PPMT is a tool designed to assist an analyst’s exploration of activity traces. Its interface (figure 1), allows the analyst to explore the data and interact with a progressive serial episode mining algorithm running in the background. In this section we present PPMT’s architecture, our progressive pattern mining algorithm, and PPMT’s widgets related to the progressiveness of the analysis.
As activity traces originate from users interacting with a system, in this section the sequence referrer is called user, since its values are the user IDs in the data.
4.1 General architecture
PPMT is based on the architecture we proposed for progressive pattern mining algorithms [27]. In this implementation, we chose a client-server architecture, where the server is in charge of providing the data and running the pattern mining algorithm, whereas the client constructs the visualizations presented to the analyst and manages the interaction. The dataset is stored by both sides, as well as the names of discovered patterns. The server has the detailed list of pattern occurrences, the client storing only the ones that have been explicitly requested. Communication between the two sides is done through websockets, allowing both the client and the server to initiate a communication when needed.
When the analyst accesses the client, a list of available datasets is displayed. Selecting one starts the transmission of its content from the server, and establishes the websocket connection that will be used for the rest of the session. When the client has received all the data, the server starts running the pattern mining algorithm. From this moment on, communications from the client to the server are instructions to steer the algorithm, or requests for the detailed
occurrences of specific patterns. In addition to answering these queries, communications from the server to the client consist in transmitting information about the newly extracted patterns and about the algorithm’s state and progression.
4.2 Our progressive pattern mining algorithm
Our main scientific topic being interaction in PVA, we did not de-velop a progressive pattern mining algorithm from scratch, but in-stead chose to adapt an existing open source implementation as in [30]. To comply with guideline G1, we wanted to extract episode rather than sequential patterns, but no implementation of this kind of pattern mining algorithm was available at that time (in 2017; let us note that since June 2018 some are proposed in the SPMF library [8]). Instead, we selected a sequential pattern mining algo-rithm and modified it to extract episodes, by changing how pattern occurrences are counted (see 4.2.2). Other changes were made to turn the algorithm into a progressive one (see 4.2.3 and 4.2.4).
Since progressive algorithms need to communicate with the ana-lyst’s tool, we integrated a dedicated bidirectional software interface into the algorithm. On the one side this interface stores the incoming steering requests into a queue that is regularly checked during the execution. On the other side it is used by the algorithm to notify the client or other plugged in parts of the code about its current state or a newly discovered pattern.
4.2.1 Choosing a mining strategy (from guideline G3) To implement our progressive pattern mining algorithm, we chose to start from the GSP [29] algorithm, available in the SPMF library [8]. GSP is well-known (many pattern mining algorithms were actually designed as its variations) and it natively uses a breadth-first search. As a breadth-first Apriori-like sequential pattern mining algorithm, GSP computes the frequent event types in the data, then combines them to generate all the candidates of size 2. Each of these candidates is then checked to see if it is frequent or not. Infrequent candidates are discarded, and frequent ones are combined to obtain the candidates of size 3. This process continues until a user-given size limit, or when no candidates or frequent patterns are found. 4.2.2 Extracting episodes and occurrences (from G1 & G2) We modified GSP’s behavior to extract serial episodes instead of sequential patterns, by keeping track of all the pattern occurrences rather than the sequence ID they were discovered in. This change also led to use an absolute support threshold instead of a relative one to determine if a candidate is frequent or not. In addition to the support threshold, our algorithm takes the following parameters to provide boundaries for the pattern space:
• The gap (minimum and maximum) controles the number of events allowed to be found between events forming a pattern occurrence, while not being part of the pattern. This can be interpreted as a control over the level of noise allowed in the pattern occurrences.
• The maximum size, expressed as a number of event types, preventing the algorithm to search for patterns too long to carry any important meaning.
• The maximum duration of a pattern occurrence, expressed in milliseconds. This effectively acts as the time window constraint that is often found in episode mining.
4.2.3 Providing intermediate results (from guideline G5) GSP stores the frequent patterns and presents them all at once at the end of its execution. We output a frequent pattern as soon as all its occurrences are discovered so as to be able to produce intermediate results for exploration. Since intermediate results are an important part of PVA, we could have had the algorithm output a pattern as soon as enough occurrences have been found to make it frequent, and then update the number of its occurrences when new ones are
encountered. However, we decided to wait for the completion of the occurrence search process before outputting a frequent pattern. This choice was made to reduce the amount of information to process and update, and to increase the user’s confidence in the numbers displayed: users know they will not change anymore. Also, con-sidering the speed at which a single pattern is processed, it would most of the time be a very small gain, probably unnoticeable to the end user. While searching for patterns, the algorithm also regularly outputs the number of candidates that have been verified, in order to communicate about its progression.
4.2.4 Steering the algorithm (from guideline G4)
We implement steering using the previously mentioned software interface. Before checking a new candidate, a verification is made to see if a steering has been requested since the previous check. If it is the case, the current state of the pattern search (the current size and the list of unverified candidates) is saved, and the candidate verifica-tion continues depending on the required steering, as described in the next paragraphs. During the steering, since our knowledge about frequent patterns of a given size is incomplete, candidates of size n are no longer obtained by combining frequent patterns of size n − 1. Instead, candidates of size n − 1 are combined with the frequent event types to generate the size n candidates. When the steering has completed, the previously saved state of the pattern search is loaded, information about the frequent patterns found during the steering is added to it, and the default strategy resumes from this point. Steering on pattern syntax: Every candidate is compared to the syntax template, and the search for occurrences only starts if the comparison matches.
Steering on a time period: The search for a candidate’s occur-rences takes place over this period. If at least one occurrence of the candidate is found in this period, then the search is continued over the whole dataset for this candidate. Otherwise, the candidate is rejected for the current steering and the algorithm moves on to the next one.
Steering on a user: The search for a candidate’s occurrences takes place over this user’s trace. If at least one occurrence of the candidate is found in this trace, then the search is continued over the whole dataset for this candidate. Otherwise, the candidate is rejected for the current steering and the algorithm moves on to the next one.
Steering on syntax is the easiest type of steering, because a syntax constraint allows to directly filter out candidates without reading the dataset. On the contrary, even in the case of a candidate that does not satisfy the steering constraint, steering on time or user requires reading parts of the data. However, extracting all occurrences instead of just those present in the targeted period or user trace has the benefit of keeping a constant strategy to determine if a candidate is frequent. The same support threshold can be used during both the steering and non-steering phases, and all the frequent patterns discovered during a steering phase remain valid for the future. While it might be possible to devise other ways of doing it, we did not found any satisfying enough. For example, using a fraction of the support threshold (i.e. using 50% of the usual value if the steering targets half the dataset’s users) could only work if the pattern occurrences were uniformly distributed over the data.
4.2.5 Comparison with Stolper et al. [30]
In their original versions, the algorithm we use (GSP) and the one used by Stolper et al. (SPAM) differ in the order in which they discover frequent patterns. As said previously, GSP is a breadth-first algorithm while SPAM uses a depth-first strategy, but the set of patterns obtained at the end is the same. In their implementation, Stolper et al. modified SPAM to make it use a breadth-first strategy. Both our implementation and theirs also add the possibility to steer the computation towards patterns with a given prefix.
Our progressive algorithm goes further on two points. First, we offer more steering options, namely steering on a time-period and on specific users. Secondly, our algorithm allows the analyst to explore patterns’ behaviour in time, by means of the occurrences.
4.3 PPMT’s interface
As illustrated in figure 1, PPMT’s graphical interface presents many information to the analyst. On the left, the analyst is presented with (A) the selected dataset, event types and users; and (B) an history of her interactions with the system. On the right, (G) the current state of the pattern mining algorithm is displayed, along with (H) the discovered frequent patterns. Items from the lists of event types, users and patterns can be selected with a click, and (C) a summary of these selections is available. Three coordinated temporal views are available to explore the dataset and the patterns. The first is (D) an overview of the dataset, displaying an aggregated visualization of the events. A brush tool allows the analyst to select a subset of the whole dataset, that will be displayed in the other two views. The second represents (E) the dataset’s events in the selected subset, as well as occurrences of patterns selected by the analyst. Depending on the selected time span, events are aggregated or displayed individually (see figure 6). Finally, the third view displays (F) the user sessions, where each rectangle represents a period where the user was active. In this subsection, rather than presenting the whole interface, we will focus on the elements related to the patterns and to the progressive nature of the pattern mining algorithm.
4.3.1 State of the algorithm
Figure 4: Detailed information about the pattern mining algorithm presented to the analyst.
Information about the state of the pattern mining algorithm is available to the analyst as shown in figure 4. The strategy is either ”default strategy” or an indication of the current steering target. Two graphs are displaying the speed at which the algorithm has been checking candidates and discovering frequent patterns over the last minute. The table displays detailed information about the extraction of every pattern size, such as the number of candidates needing to be verified and the elapsed time. A color code is used to represent completed pattern sizes (green), the current target of the algorithm (blue) and incomplete pattern sizes (orange). This detailed view is not always displayed but a condensed version is always visible, in the top right corner of PPMT’s main interface (see figure 1, (G)). The analyst can open the detailed view by clicking on the condensed one.
4.3.2 Steering the algorithm
The analyst can request a steering of the algorithm by using three different buttons. The button to steer on a time period is located above the overview (D in figure 1), where the corresponding time period is selected with the brush. Hovering over an item in the pattern list makes a button appear on the line to request a steering using the corresponding pattern as prefix. Steering on a specific user is done in the same way, with a temporary button appearing while hovering over the user list.
4.3.3 Control over the patterns
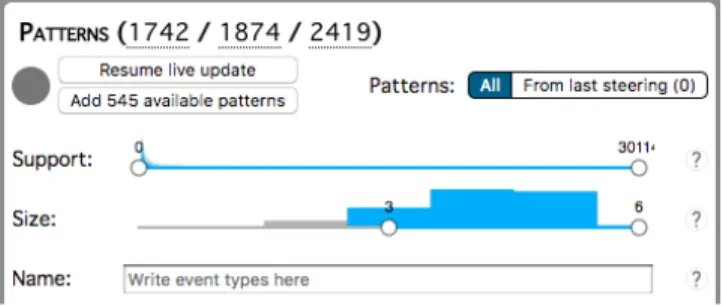
The discovered frequent patterns are displayed in a list, as shown in the lower right part of figure 1. The analyst has some control over this list, that are shown in more details in figure 5. The support and sizesliders and the name (i.e. syntax) text field are filters that can be expected from any pattern analysis tool, but the other elements are tied to the progressive nature of PPMT. Since patterns are discovered while the analyst uses the system, adding entries to the pattern list while the analyst interacts with it is problematic. To prevent this, the analyst has the possibility to toggle on or off the live update of the list. When active, any new pattern is added to the list when received. When the option is toggled off, new patterns await to be integrated into the list, and the analyst can see how many of them are available. The list is created from all the patterns, by default and before applying any filter. However, since a steering phase targets patterns the analyst is interested into, it is possible to create the list only from the patterns that have been found during the last steering phase.
Figure 5: Controls over the discovered patterns available to the ana-lyst. There are filters over the list, along with options to change the way it is constructed and updated. The numbers at the top reflect (from right to left) the total number of discovered patterns, the number of patterns used to create the list (equal to the total unless the live update is off), and the number of patterns remaining after applying the filters.
4.3.4 Patterns Visualization
Patterns are visualized in the central timeline, as illustrated in figure 6. When a pattern is selected, an overview of its occurrences’ tem-poral positions is displayed under the timeline, each black dot being an occurrence. If the analyst wants to focus on a specific occurrence, zooming in on it displays a detailed view of the individual events composing the occurrence by linking them together. This allows the analyst to observe the context of the occurrence in term of preceding and following events, which can be useful to her understanding of the data at hand. Patterns are also visible in the user session view, in the bottom central part of figure 1; sessions where a selected pattern is present are displayed in red, while blue sessions indicate its absence.
5 EVALUATION
In this section, we present the two evaluations we conducted on our progressive algorithm and on PPMT’s steering features. Both evaluations were conducted with the same dataset, collected while students were using COCoNotes2, an online video consumption and annotation platform. The data contains 201 000 events, 32 event types and 211 users, over a four months period from September 2016 to January 2017.
Figure 6: Visualizations of a pattern’s occurrences. Depending on the zoom level, the analyst can either see an overview of where the occurrences are (black dots on the top image) or a detailed view of the events composing the occurrences (linked events on the bottom image).
5.1 Effect of progressiveness & steering on the algo-rithm
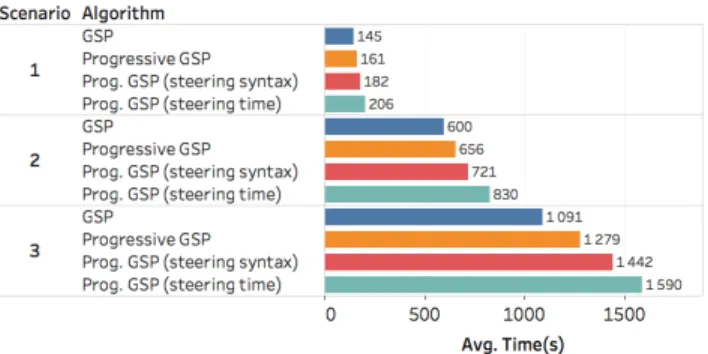
Having a progressive version of an existing algorithm may lose its interest if the original one is much more efficient, so we wanted to see how our progressive algorithm performed compared to the original GSP. The main uncertainty lies in the impact of steering on computation, so we decided to compare the following configurations: (1) the original GSP algorithm modified to extract episodes, (2) our progressive GSP, (3) our progressive GSP performing pattern syntax steering and (4) our progressive GSP performing time steering. We chose not to test user steering, because of its mechanical similarity with time steering, as explained in section 4.2.4. In configurations (3) and (4), steering on a random element (pattern or time-period) was executed once for each pattern size, which amounts to about 15 steering phases per execution. An execution lasting between 3 and 20 minutes, we believe that –though not a perfect recreation of a real use case– it is sufficient to highlight any impact the steering could have on the algorithm, and to provide relevant insights about the various configurations’ performances.
We measured the CPU time and maximum memory usage needed to extract all the patterns in the dataset. Regarding the algorithm’s parameters, we used constant values for the gap (min=0, max=2), maximum size (20) and maximum duration (30s), but used three different support thresholds, to obtain the following scenarios: Scenario 1: Min. support of 150, leading to 3492 frequent patterns Scenario 2: Min. support of 50, leading to 21731 frequent patterns Scenario 3: Min. support of 30, leading to 49121 frequent patterns Each configuration was run 20 times over each scenario, on a single dedicated CPU core, and we computed the average values for
CPU execution time (figure 7) and memory usage.
Figure 7: Results of the comparison between the different algorithms, regarding the CPU time necessary to discover every pattern.
As can be seen in figure 7, the relation between the different algorithms for CPU usage is the same for all the scenarios, with the original GSP being faster than the progressive one. While perform-ing similarly when extractperform-ing a few patterns, relaxperform-ing the parameters to obtain more patterns increases the difference in computation time between each configuration. We can also see that steering the algo-rithm on pattern syntax has less repercussions on the performances than steering on a time period. This was expected, since steering on time requires additional data reads compared to steering on syntax, as explained in section 4.2.4.
As far as memory usage is concerned, our first results show that GSP uses more memory than Progressive GSP with or without steering, which seems logical as GSP has to maintain the full list of all occurrences until the end of its execution. Our system also uses memory outside of GSP to store those occurrences, so memory usage of progressive algorithms needs further investigation.
5.2 Effect of steering on analysis tasks
5.2.1 Protocol
We focus on steering, the main interaction between the analyst and the progressive algorithm. We recruited 14 participants within our laboratory (13 males, 1 female, mean age 26.1 ± 7.05), all with some experience with data analysis. After participants signed a consent form, they were given some reminders about pattern mining and a presentation of PPMT, as well as a list of analysis questions they had to answer with PPMT. Only 7 participants had a PPMT version with which they could steer the algorithm (steering group). The questions were the following:
Q1 How many occurrences of the pattern paused played Visibili-tyChange are present in the data?
Q2 How many users have the pattern paused created played? Q3 How many patterns are discovered for the user user049, in his
session of October 5th, from 9:02am to 9:11am?
Q4 Give two patterns of a size strictly greater than 2, present both in the first session of user user153 AND in the first session of user user177 (September 18th, from 9:38am to 11:15am). Q5 We are interested in the events x that can follow or precede the
pattern M = Mdp media play played. How many patterns of the form x M or M x are found?
Questions 1, 2 and 5 were designed to encourage the use of steering on a pattern syntax, while questions 3 and 4 were more suited to steering on a time-period. The questions had to be answered in this order, and pattern mining was restarted for each question. We did not make use of user steering, because the whole evaluation session was already long enough (60 to 75 min), with participants needing to assimilate a lot of information about PPMT’s features and the dataset. For each question and each participant we collected
the duration, and the answer, graded as correct or incorrect (false or non answered).
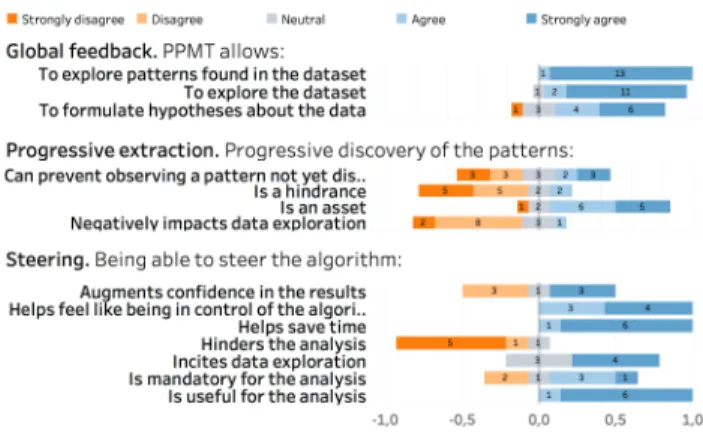
After using PPMT participants had to give their agreement with a 5-points Likert scale on 14 affirmations on their global feedback, pattern progressive extraction, and steering (only for the steering group). Then they could freely comment on their experience. 5.2.2 Results
The time participants spent on each task is presented in figure 8. We can see that participants from the steering group were faster for every question, except the first one. This was expected, since the first question was very easy to answer even without steering. We computed Wilcoxon Signed-rank test for questions 2–5 and for the whole set of questions. The non-significant results show an effect of the steering/non-steering condition on the response times with the following p-values: Q2: 5.3%, Q3: 12.8%, Q4: 5.3%, Q5: 14.1%, Q1–5: 7.2%.
Regarding the correctness of the answers, steering group partic-ipants gave 26 right answers, 8 wrong ones and did not answer 1 question. The other group gave 20 good answers, 12 wrong ones and did not answer 3 questions. On an individual basis, most of the 14 participants gave the correct answers for questions 1, 2 and 4. Only 7 correctly answered question 5, mostly because they did not answer for both syntax xM and Mx. Only 5 gave the correct answer to question 3 (see discussion).
The steering group participants used steering for almost every question. They were able to target the information needed to answer the questions in one unique steering request, but one participant did multiple steering on more and more precise time periods to answer question 3. The most notable exception to the use of steering was for question 5, where 3 out of 7 decided not to use it since it would only give them half of the answer. For questions 3 and 4, only 2 members of the steering group did not use time steering.
Figure 8: Summary of time needed for participants to perform the tasks. Graduations are in seconds.
Participants’ feedback is presented in figure 9. The steering group participants were unanimously agreeing with its usefulness for the analysis, and the fact that it allows them be be faster when they have a goal, while feeling in control of the computation.
5.2.3 Discussion
With regards to accuracy, the steering group performed slightly better, however more participants would be needed to conclude about the potential positive impact of steering on the correctness of answers.
With regards to speed, the results are encouraging as the steering group participants were globally faster than the others to answer questions. This can be associated with their feedback that steering was augmenting their confidence, helping them save time and feel in control, while being generally useful. For example, one of the participants declared that ”having the ability to steer the algorithm really makes the analysis more fluid”, while another said that ”with-out being able to steer the computation, [he] would have probably
Figure 9: Feedback from the participants after performing the tasks
given up on some questions”. This also echoes some remarks for-mulated by two of the participants of the non steering group, that had the feeling they would have wanted a way to ask for specific patterns. While the difference between steering and non-steering groups favors the steering by one or two minutes, it is important to keep in mind that we designed the questions so that both groups were able to answer them in a reasonable time. Had we chosen different questions (essentially involving longer patterns), the gap between the two groups could have been significantly larger.
An interesting observation originated from the way members of the steering group dealt with question 3. Being able to steer the computation allowed them to greatly shorten the time needed to answer, however as soon as results stopped coming in during the steering, 2 of them gave their answer without waiting for the completion of the steering.
6 CONCLUSION
We presented some guidelines for designing progressive pattern mining algorithms based on a data and task model inspired by [1]. We then introduced PPMT, our tools for progressive pattern analysis of usage traces. Our evaluation points towards both the relatively low impact of progressiveness on execution time, and the increased rapidity of analysis for question answering. More work is however needed to confirm these preliminary results by exploring the various ways analysts use pattern, time, and sequence steering during longer analysis sessions.
REFERENCES
[1] N. Andrienko and G. Andrienko. Exploratory analysis of spatial and temporal data: a systematic approach. Springer Science & Business Media, 2006.
[2] M. Angelini and G. Santucci. Modeling Incremental Visualizations. In M. Pohl and H. Schumann, eds., EuroVis Workshop on Visual Analytics. The Eurographics Association, 2013. doi: 10.2312/PE.EuroVAST. EuroVA13.013-017
[3] J. Ayres, J. Flannick, J. Gehrke, and T. Yiu. Sequential pattern mining using a bitmap representation. In Proceedings of the Eighth ACM SIGKDD International Conference on Knowledge Discovery and Data Mining, KDD ’02, pp. 429–435. ACM, New York, NY, USA, 2002. [4] S. K. Badam, N. Elmqvist, and J.-D. Fekete. Steering the Craft: UI
El-ements and Visualizations for Supporting Progressive Visual Analytics. Computer Graphics Forum, 36(3):491–502, June 2017.
[5] M. Brehmer and T. Munzner. A multi-level typology of abstract vi-sualization tasks. IEEE Transactions on Vivi-sualization and Computer Graphics, 19(12):2376–2385, Dec 2013.
[6] L. A. F. Fernandes and A. C. B. Garc´ıa. Association rule visualization and pruning through response-style data organization and clustering. In J. Pav´on, N. D. Duque-M´endez, and R. Fuentes-Fern´andez, eds.,
Advances in Artificial Intelligence – IBERAMIA 2012: 13th Ibero-American Conference on AI, Cartagena de Indias, Colombia, Novem-ber 13-16, 2012. Proceedings, pp. 71–80. Springer, 2012.
[7] D. Fisher, I. Popov, S. Drucker, et al. Trust me, i’m partially right: incremental visualization lets analysts explore large datasets faster. In Proceedings of the SIGCHI Conference on Human Factors in Comput-ing Systems, pp. 1673–1682. ACM, 2012.
[8] P. Fournier-Viger, J. C.-W. Lin, A. Gomariz, T. Gueniche, A. Soltani, Z. Deng, and H. T. Lam. The spmf open-source data mining library version 2. In B. Berendt, B. Bringmann, ´E. Fromont, G. Garriga, P. Mi-ettinen, N. Tatti, and V. Tresp, eds., Machine Learning and Knowledge Discovery in Databases, pp. 36–40. Springer, Cham, 2016.
[9] E. Glatz, S. Mavromatidis, B. Ager, and X. Dimitropoulos. Visualizing big network traffic data using frequent pattern mining and hypergraphs. Computing, 96(1):27–38, Jan 2014. doi: 10.1007/s00607-013-0282-8 [10] B. Goethals, S. Moens, and J. Vreeken. Mime: A framework for interactive visual pattern mining. In Proc. 17th ACM SIGKDD, KDD ’11, pp. 757–760. ACM, 2011.
[11] M. Gupta and J. Han. Applications of pattern discovery using sequential data mining. In P. Kumar, P. R. Krishna, and S. B. Raju, eds., Pattern Discovery Using Sequence Data Mining: Applications and Studies, chap. 1, pp. 1–23. IGI Global, 2012.
[12] M. Hahsler and R. Karpienko. Visualizing association rules in hierar-chical groups. Journal of Business Economics, 87(3):317–335, Apr 2017. doi: 10.1007/s11573-016-0822-8
[13] J. Han, J. Pei, B. Mortazavi-Asl, Q. Chen, U. Dayal, and M.-C. Hsu. Freespan: Frequent pattern-projected sequential pattern mining. In Proc. ACM SIGKDD, pp. 355–359. ACM, New York, NY, USA, 2000. [14] B. C. Kwon, J. Verma, and A. Perer. Peekquence: Visual analytics for event sequence data. In ACM SIGKDD 2016 Workshop on Interactive Data Exploration and Analytics, vol. 1, 2016.
[15] H. Lei, C. Xie, P. Shang, F. Zhang, W. Chen, and Q. Peng. Visual anal-ysis of user-driven association rule mining. In Proc. 9th International Symposium on Visual Information Communication and Interaction, VINCI ’16, pp. 96–103. ACM, New York, NY, USA, 2016.
[16] G. Liu, A. Suchitra, H. Zhang, M. Feng, S.-K. Ng, and L. Wong. Assocexplorer: An association rule visualization system for exploratory data analysis. In Proc. 18th ACM SIGKDD, KDD ’12, pp. 1536–1539. ACM, New York, NY, USA, 2012.
[17] Z. Liu, Y. Wang, M. Dontcheva, M. Hoffman, S. Walker, and A. Wilson. Patterns and sequences: Interactive exploration of clickstreams to understand common visitor paths. IEEE Transactions on Visualization and Computer Graphics, 23(1):321–330, Jan 2017. doi: 10.1109/ TVCG.2016.2598797
[18] A. MacEachren. How maps work: representation, visualization, and design. New York: Guilford Press, 1995.
[19] H. Mannila and H. Toivonen. Discovering generalized episodes using minimal occurrences. In KDD, vol. 96, pp. 146–151, 1996. [20] H. Mannila, H. Toivonen, and A. Inkeri Verkamo. Discovery of frequent
episodes in event sequences. Data Mining and Knowledge Discovery, 1(3):259–289, 1997. doi: 10.1023/A:1009748302351
[21] H. Mannila, H. Toivonen, and A. I. Verkamo. Discovering frequent episodes in sequences extended abstract. In Proc. first Conference on Knowledge Discovery and Data Mining, pp. 210–215, 1995. [22] F. Masseglia, F. Cathala, and P. Poncelet. The psp approach for mining
sequential patterns. In J. ytkow and M. Quafafou, eds., Principles of Data Mining and Knowledge Discovery, vol. 1510 of LNCS, pp. 176–184. Springer Berlin Heidelberg, 1998.
[23] M. Monroe, R. Lan, H. Lee, C. Plaisant, and B. Shneiderman. Temporal event sequence simplification. IEEE Transactions on Visualization and Computer Graphics, 19(12):2227–2236, Dec 2013.
[24] C. H. Mooney and J. F. Roddick. Sequential pattern mining – ap-proaches and algorithms. ACM Comput. Surv., 45(2):19:1–19:39, Mar. 2013. doi: 10.1145/2431211.2431218
[25] T. M¨uhlbacher, H. Piringer, S. Gratzl, M. Sedlmair, and M. Streit. Opening the black box: Strategies for increased user involvement in ex-isting algorithm implementations. IEEE Transactions on Visualization and Computer Graphics, 20(12):1643–1652, Dec 2014.
[26] J. Pei, J. Han, B. Mortazavi-asl, H. Pinto, Q. Chen, U. Dayal, and M. chun Hsu. Prefixspan: Mining sequential patterns efficiently by
prefix-projected pattern growth. pp. 215–224, 2001.
[27] V. Raveneau, J. Blanchard, and Y. Pri´e. Toward an open-source tool for pattern-based progressive analytics on interaction traces. IEEE VIS 2016 Workshop on Temporal and Sequential Event Analysis, Baltimore, MD, USA, 2016.
[28] M. Seno and G. Karypis. Slpminer: an algorithm for finding frequent sequential patterns using length-decreasing support constraint. In Data Mining, 2002. ICDM 2003. Proceedings. 2002 IEEE International Conference on, pp. 418–425, 2002.
[29] R. Srikant and R. Agrawal. Mining sequential patterns: Generalizations and performance improvements. In Proc. 5th International Conference on Extending Database Technology: Advances in Database Technology, EDBT ’96, pp. 3–17. Springer-Verlag, London, UK, UK, 1996. [30] C. D. Stolper, A. Perer, and D. Gotz. Progressive visual analytics:
User-driven visual exploration of in-progress analytics. IEEE Trans. on Visualization and Computer Graphics, 20(12):1653–1662, Dec 2014. [31] M. van Leeuwen. Interactive data exploration using pattern mining. In A. Holzinger and I. Jurisica, eds., Interactive Knowledge Discovery and Data Mining in Biomedical Informatics: State-of-the-Art and Future Challenges, pp. 169–182. Springer, 2014.
[32] Z. Yang and M. Kitsuregawa. Lapin-spam: An improved algorithm for mining sequential pattern. In Data Engineering Workshops, 2005. 21st International Conference on, pp. 1222–1222, April 2005.
[33] M. Zaki. Spade: An efficient algorithm for mining frequent sequences. Machine Learning, 42(1-2):31–60, 2001.
[34] E. Zgraggen, A. Galakatos, A. Crotty, J. D. Fekete, and T. Kraska. How progressive visualizations affect exploratory analysis. IEEE Trans. on Visualization and Computer Graphics, 23(8):1977–1987, Aug 2017.

![[PDF] Tutoriel général sur iMovie pour iPad | Cours informatique](data:image/gif;base64,R0lGODlhAQABAIAAAP///wAAACH5BAEAAAAALAAAAAABAAEAAAICRAEAOw==)