HAL Id: hal-01131027
https://hal.archives-ouvertes.fr/hal-01131027
Submitted on 12 Mar 2015HAL is a multi-disciplinary open access archive for the deposit and dissemination of sci-entific research documents, whether they are pub-lished or not. The documents may come from teaching and research institutions in France or abroad, or from public or private research centers.
L’archive ouverte pluridisciplinaire HAL, est destinée au dépôt et à la diffusion de documents scientifiques de niveau recherche, publiés ou non, émanant des établissements d’enseignement et de recherche français ou étrangers, des laboratoires publics ou privés.
Automatic Analysis of Microscopic Images in
Hematological Cytology Applications
Gloria Díaz, Antoine Manzanera
To cite this version:
Gloria Díaz, Antoine Manzanera. Automatic Analysis of Microscopic Images in Hematological Cy-tology Applications. Fabio A. González; Eduardo Romero. Biomedical Image Analysis and Machine Learning Technologies: Applications and Techniques, 2009, 978-1605669564. �10.4018/978-1-60566-956-4.ch008�. �hal-01131027�
Automatic Analysis of Microscopic
Images in Hematological
Cytology Applications
Gloria Díaz
National University of Colombia, Columbia
Antoine Manzanera
ENSTA-ParisTech, France
KEYWORDS
microscopic image analysis, blood smear, cell detection, cell classification, automatic diagnosis.
ABSTRACT
Visual examination of blood and bone marrow smears is an important tool fordiagnosis, prevention and treatment of clinical patients. The interest of computer aided decision has been identified in many medical applications: automatic methods are being explored to detect, classify and measure objects in
hematological cytology. This chapter presents a comprehensive review of the state of the art and currently available literature and techniques related to automated analysis of blood smears. The most relevant image processing and machine learning techniques used to develop a fully automated blood smear analysis system which can help to reduce time spent for slide examination are presented. Advances in each component of this system are described in acquisition, segmentation and detection of cell components, feature extraction and selection approaches for describing the objects, and schemes for cell classification.
INTRODUCTION
Traditionally, visual microscopical examination is used to perform quantitative and qualitative analysis of blood smears, which are very valuable for diagnosis of many diseases. Human visual analysis is tedious, time consuming, repetitive and has limited statistical reliability. Thus, methods that automate visual analysis tasks have been developed for enhancing the performance in hematological laboratories.
Since the end of the 80’s, commercially available systems for automatic quantification of blood cells allow to count the numbers and types of different cells within the blood (Beckman Coulter LH series, Sysmex XE-2100, Siemens ADVIA 120 & 2120). These counters use flow cytometry techniques, which measure some physical and/or chemical characteristics of blood cells going through a detector of light, fluorescence or electrical impedance, allowing to identify the type of cell. Although quantification results are very precise, some morphological abnormalities can be misidentified or not detected by the machine, and then microscopic blood smear analysis is required. The development of automated methods for classification of blood cells from digitized blood smears started in 70´s decade (Miller, 1972; Bentley & Lewis, 1975) and is now a current problem in pattern recognition. So far, fully automated microscopy systems are under development, which combine advances in image processing and machine learning for reducing the human intervention in the process (Ceelie et al., 2006).
An automatic analysis system for blood or bone marrow smears generally consists in the phases illustrated in Figure 1. First, image preprocessing of the digitized smears is applied for suppressing noise and improving luminance and contrast differences in the images. Second, a segmentation process is applied for finding and isolating the interest objects in the image. The third phase aims at characterizing the objects previously extracted to be used in the last phase, i.e. classification stage. Feature selection can be applied to reduce the redundant information. Selected features are used as input to the classification method which makes the decision about the class assignment.
Figure 1 Automatic analysis of blood and bone marrow smears
Blood Smears
Blood analysis is commonly carried out on peripheral blood smears since anomalies in blood cells are indicators of disturbances in their origin organs (Hoffbrand et al., 2006). However, in some cases bone marrow biopsies or aspirations are indicated to evaluate diseases which cannot be diagnosed and classified in peripheral blood analysis. Bone marrow is a tissue found inside the bones where the blood cells are produced, and released to the peripheral blood once reached their maturity level.
Blood smears are thin films of peripheral blood or bone marrow which are examined by a microscopist for visualizing the morphological features of the cells (Jenkins & Hewamana, 2008). A blood smear is made by placing a drop of blood or bone marrow sample on a highest purity, corrosion-resistant glass slide and then dispersed using a spreader slide (Houwen, 2000). It is then fixed and stained for highlighting morphological cell characteristics.
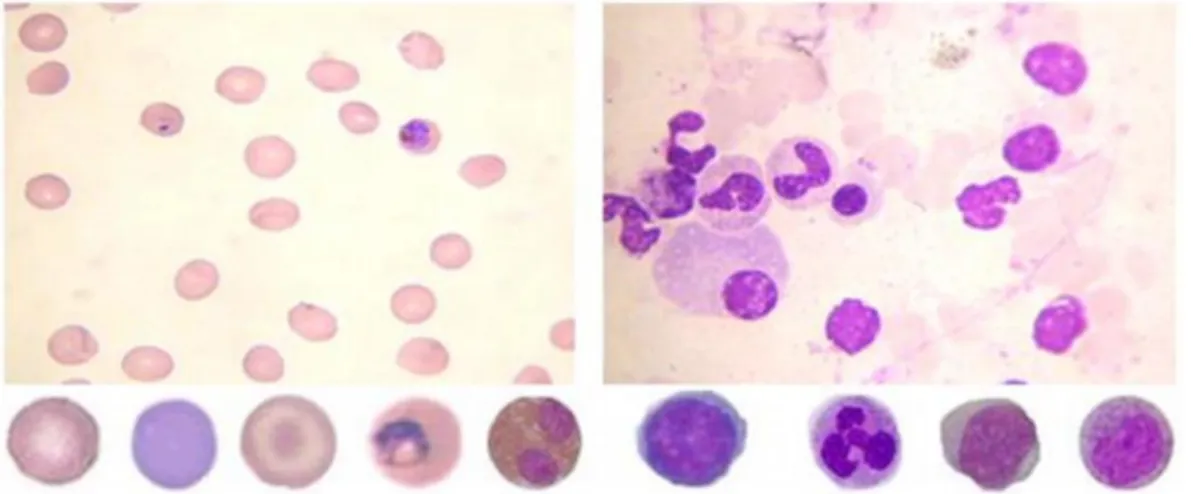
Diagnosis of blood diseases is performed by the differential discrimination of normal and abnormal cells, based on identification and quantification of changes in their visual features. Visual features of blood cells depend on smearing, staining and capturing processes. Variations in these processes can mistake the entire technique and generate different kinds of artifacts, as for instance dye remains, damaged cells or cells with poor morphology (e.g. crenated or superimposed cells). Sample images of typical peripheral blood and bone marrow smears are shown in Figure 2. (top) Although peripheral blood and bone marrow smears are visually similar, specimens of peripheral blood are observed as a homogeneous layer without any apparent structure, whereas bone marrow smears are not homogeneous and contain inner structured portions. On the bottom the same figure shows sample images of different blood cell types, from left to right: a normal erythrocyte, a retyculocyte, a target cell, an erythrocyte infected with malaria, an eosinophil, a lymphocyte, a neutrophil, a myeloblast and a myelocyte.
Figure 2 Peripheral blood and bone marrow smear samples.
Normal bone marrow contains cells at all stages of development, from the earliest precursor stem-cells to functionally mature cells, including hematopoietic stem cells which are precursors of most blood cells, mesenchymal stem cell which are considered as “gatekeeper “ cells of bone marrow, and endothelial stem cells. Provided all blood cell are derived from a common stem cell, it is impossible to establish rigid morphological distinctions between certain cells in some stages of the maturation process. On the other hand, peripheral blood normally only contains mature leukocytes, erythrocytes and platelets which have specific morphological features that allow to distinguish them. The erythrocyte is a non nucleated cell, a biconcave disk of 6-8 microns. In microscopic smear these cells are commonly viewed as a reddish circular cell, lighter towards the center. The leukocytes (9-15 microns), present a spherical shape in suspension, but take an amoeba shape inside a solid substrate. In microscopic smears, leucocytes are viewed as circular or oval cells with a blue cytoplasm and big nucleus with clumped chromatin structure. Finally, the platelets (thrombocytes) are very sparse, small, disk shaped and non-nucleated corpuscles, whose size is between 1-15 microns. In blood smears, they show up agglutinated and present a translucent clear blue part, which contains many purple stained grains. Also, infecting parasites such as the malaria parasite can be seen in a blood smear.
Automatic or semi-automatic approaches for analysis of blood and bone marrow smears have been used in many applications, such as differential counting of blood cells (Micheli-Tzanakou et al., 1997; Ongun et al., 2001; Bikhet et al., 2000; Kats,2000), hemoparasite and hematological diseases diagnosis (Di Ruberto et al., 2002; Halim et al., 2006, Tek et al., 2006; Ross et al., 2006; Sio et al., 2007; Díaz et al., 2009; Markiewicz et al., 2005; Sabino et al. 2004), and content based image retrieval systems by
supporting medical decisions (Comaniciu et al., 1998; Aksoy et al., 2002). Because features such as morphometry or visual appearance, and their relationships, cannot be modeled accurately for
distinguishing different types of cells, learning from sample approaches are commonly used as classification strategies in these applications.
This chapter exhibits a comprehensive review of how machine learning and image processing approaches are applied in automatic analysis of blood and bone marrow smears. It presents the general architecture of a general system and describes relevant techniques proposed for performing each stage. Some examples of applications of these techniques are shown.
IMAGE DIGITIZATION
The starting point of any digital image analysis system is the image capturing process. Many image analysis methods have been evaluated on images acquired in controlled conditions. However, a fully automated examination of blood and bone marrow smears requires approaches that can be used in real laboratory conditions.
Technologies for digitization of whole slides have been investigated and are commercially available (Aperio, Cellavision, Carl Zeiss). A proper visual analysis requires that images of blood and bone marrow smears should be captured with a 100x objective lens. In this magnification, a whole slide of a 15mm x 15mm tissue area results in an image of 76 GB approximately, whereby automatic selection of regions of interest is an open research topic. In some cases these regions can be single cells, for instance nucleated cells for diagnosis based on differential leukocytes. In other cases, like in hemoparasite diagnosis or differential erythrocyte analysis, a working area should be selected. A technique for optimal area detection when analyzing peripheral blood smears was proposed by Angulo et al. (2003), which firstly extracted erythrocytes from images scanned at low magnification. Then some scattering and overlapping measures are computed for defining the working area.
IMAGE ENHANCEMENT
Inherent variability of many factors such as environment illumination conditions, dye duration, film thickness or film defects result in visual artifacts, non uniform background or different image luminance and color distribution in digitized images. So, images should be enhanced for improving particular image characteristics and reducing the processing required in the latter analysis stages.
Two major problems are commonly addressed at this stage: noise reduction and feature enhancement. Traditionally, noise has been reduced by application of median filters (Micheli-Tzanakou et al., 1997; Anoraganingrum, 1999; Bikhet et al., 2000, Di Ruberto et al., 2000). While, image enhancement, has been accomplished using a range of tonal, spatial or spectral domain methods (Heijden, 1995).
The tonal domain methods are related to the redistribution of pixel grey levels. The most classical transformation is the histogram equalization: vnew NmaxR vI( old), where voldand
v
neware respectively thegrey level values before and after equalization,
N
maxis the maximal grey level value, and RI is thecumulative distribution of grey level values in image I. In some approaches, the histogram transformation is defined on a target histogram that represents a standardized image. Tek et al. (2006) proposed a
normalization procedure using an adapted grey world normalization method based on the diagonal model of illumination change. After a rough segmentation based on a threshold, the background and the
foreground values are independently processed so that every pixel value is normalized using the mean background (foreground) values.
Spatial domain methods are indeed local contrast enhancement techniques, which are classically performed by combining the image with its derivatives (unsharp mask). Typically: InewIold Iold, where
0 is a gain parameter, and I 2I/ x2 2I/y2 is the Laplacian of the image. By adjusting the width of the spatial kernel used to compute the derivatives, the local contrast enhancement techniques can be adapted to the scale of the relevant features.
Finally, the spectral domain methods refer to techniques operating in transformed domains, such as Fourier or wavelet bases. One useful operation in this category is the homomorphic filter, which allows correcting non-uniform background. Its principle is to model the background variation by a low frequency multiplicative noise, and to remove it in the log-Fourier domain:
1 (F ( (ln(F Iold)). f)) w H ne e I
where and are the direct and inverse Fourier transforms respectively, and Hf is the ideal high-pass
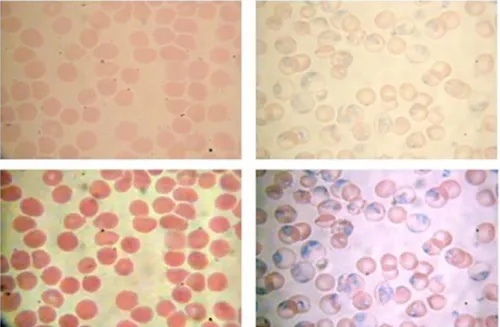
Figure 3 Image enhancement approaches. Fist row corresponds to the original images. Bottom row displays enhanced images obtained by application of an unsharp masking followed by a color median filter (left), and the color normalization process proposed by Tek et al. (right)
Figure 3 illustrates two examples of image enhancement procedures. First row corresponds to the original blood smears and bottom row displays their corresponding enhanced images. Left image is the result of applying an unsharp mask on the V component of HSV color space, followed by a color median filter computed by minimization of the L1 distance in the RGB color space. Right image corresponds to the application of the color normalization process proposed by Tek et al. (2006). Note that object properties, such as color or contrast between objects, are visually highlighted.
OBJECT SEGMENTATION
Generally, segmentation is the process of partitioning an image into disjoint regions based on a
homogeneity criterion (Lucchese & Mitra, 2001). Two main levels of segmentation are commonly used in blood smear analysis: cell level segmentation, which aims at separating the whole cells from the
background or plasma, and component level segmentation, which tries to separate the different components into the cell, such as nucleus from cytoplasm or intracell hemoparasites. Latter case is commonly used in applications in which the cell class depends on morphological features of its
components. However, when finding the boundaries between components is not feasible, analyzing the components as a whole and trying to describe these morphological features as properties of the cell can be useful (Díaz et al. 2009). In this section the most popular cell segmentation approaches will be presented.
Image segmentation approaches have been divided in two complementary perspectives: the region-based and boundary-region-based approaches. In the former the goal is to determine whether a pixel belongs to an object or not, whereas in the latter the objective is to locate the frontier curves between the objects and the background.
Region Based Segmentation
Thresholding. This is the simplest technique used to segment an image. This method allows separating the objects from the background using a pixel feature value that is compared with a threshold value in order to determine the class of the pixel. The feature generally used is the illumination value, although other feature descriptors have been used, such as gradient information (Bacus et al., 1976), entropy histogram (Bikhet et al., 2000) and intensity computed as mean of red, green and blue components from
the RGB color space (Hengen et al., 2002). Other authors have found that specific color components in different color spaces stress the differences between blood smear components. Cseke et al.(1992) found that nuclei of white cells are most contrasted on the green component of RGB color space, while differences between cytoplasm and erythrocytes are most perceptible in the blue component. This has been used by other authors for segmenting leukocytes (Katz, 2000) and hemoparasites (Le et al., 2008). The saturation component from the HSV color space also allows distinguishing the nucleated component (Di Ruberto et al. 2002; Ross et al., 2006; Wu & Zeng. 2006). Moreover, thresholds may be either global or local. In the latter case, some information relative to the pixel’s neighborhood is taken into account to perform adaptive threshold (Cseke et al., 1992; Hengen et al., 2002).
The critical issue for the performance of the threshold algorithm is a good selection value, which can be determined heuristically from the grey level histogram of the image to be segmented
(Micheli-Tzanakou et al., 1997) or computed automatically. Harms et al. (1986) found that it is possible to estimate automatically a threshold for segmenting leukocyte nucleus, using the largest color difference value from a grey level image obtained as the combination of the red, green and blue color components (R + B – 2G). A similar approach was used by Poon et al. (1992), using a subtraction of the red and blue components (R – B +128). Analysis of the histogram shape for detecting the separating value between modal peaks was used by Le for segmenting nucleated components (Le et al., 2008). A straight line is drawn from the first prominent peak to the first empty bin of the histogram; the threshold is then selected as the abscissa of the point of the histogram with maximal perpendicular distance to the line.
Clustering algorithms are used as another way of performing automatic thresholding. Originally, these algorithms assume that the image contains two classes of pixels i.e. foreground and background, and calculate the optimum threshold separating those two classes. Otsu (1979) proposes an optimal threshold by maximizing the between-class variance through an exhaustive search. This approach was adapted to multiple thresholds for separating background, cytoplasm and nucleus (Cseke, 1992; Scotti, 2006). In Wu et al. (2006), Otsu’s algorithm was applied on a circular histogram from the HSI color space; this
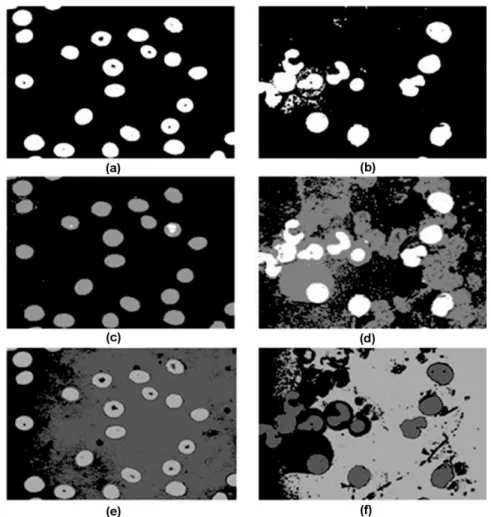
representation prevents to lose the periodicity of the hue attribute (Wu & Zeng, 2006). Figures 4a and 4b shows segmentation results of blood and bone marrow smears shown in Figures 2 and 3. In this case, automatic thresholds on the green value histograms were computed using the Otsu algorithm.
Segmentation based on threshold can work well in blood and bone marrow smears because background and foreground objects maintain constant visual feature values which constitute multimodal histograms. In particular, staining procedures highlight cell components containing DNA, such as white cell nuclei and parasites, in such a way that finding appropriate thresholds for segmenting them becomes easy. However, boundaries between cytoplasm, plasma and earlier parasite stage are harder to find (see Figure 4b). Pixel based classification. Given an input image I, the classification of a target pixel I(x,y) is performed according to a feature vector (1,...m) describing it. Strategies in this category are composed of two steps: feature extraction and pixel class identification. Intensity or chromatic features, along with supervised classification, explained in section 3.5, are commonly used approaches. Tek et al. (2006) classify the pixels in a blood smear as stained or not stained, according to a their R,G,B values using a Bayesian classifier which is trained using a set of pixels classified by an expert. Classification of whole color space was proposed by Díaz et al. (2007) for reducing the image segmentation time. This method is based on a classification process that labels all components of a color space in one of the three classes: background, erythrocytes and parasites. Then, the labeled color space is used as a look-up-table for defining the class of each pixel in the images. The combined choice of a color space representation and a particular classifier was evaluated, showing that a normalized RGB color space together with a K-nearest neighbor (K-nn) classifier obtained the best performance. Images in Figures 4c and 4d show results of pixel classification for images of Figure 2. A K-nn classifier (k set to 15) was trained for separating the normalized RGB color space in three classes. In Figure 4c, parasites, erythrocytes and background were segmented. In Figure 4d, classifier was trained for distinguishing nuclei cells from cytoplasm (erythrocytes and leukocytes) and background.
Region Growing. These are classical algorithms for which a set of regions are defined, each one initially constituted by a single pixel, and then an iterative growing procedure is performed according to a
homogeneity criterion. Main issues of region growing are: to establish a criterion that decides whether a neighbor pixel is similar to the seed, and to find the suitable seed.
Region growing algorithms have been used in segmentation of leukocytes. Pixels inside nuclei, which are easily identified, are used as seeds, and cytoplasm are segmented by growing region; once nucleus is located, cytoplasm is detected by iterative growing of a ring surrounding the nucleus, and a gradient threshold is used as stopping condition (Kovalev et al., 1996). Lezoray et al. (1999) proposed a leukocyte segmentation approach based on region growing in which region seeds are found by prior knowledge on color information of nucleus pixels. Then a growing procedure is applied based on color homogeneity and gradient information.
Figure 4 Segmentation result samples. (a,b) Segmentation obtained by applying the Otsu algorithm on the green value histograms. (c,d) segmentation using a pixel classification approach. (e,f) Segmentation by k-means clustering.
Region clustering. Region clustering approaches are similar to region growing, but the region clustering focuses on the region directly without any seed. In contrast with pixel based classification strategies these approaches identify coherent regions instead of classifying single pixels independently. The k-means algorithm is a well-known clustering method. In (Sinha & Ramakrishnan, 2003), pixels represented by a vector of 3 components from the HSV color space were automatically clustered, using k-means algorithm, for identifying leukocyte nucleus, cytoplasm and background. Then results were further refined by an
Expectation-Maximization algorithm. In (Thera-Umpon, 2005), fuzzy k-means algorithm was proposed as an over segmentation algorithm applied on grey level image for detecting regions corresponding to nucleus in leukocytes. Comaniciu & Meer (2001) proposed a method, which detects clusters in the L*u*v* color space and delineates the border cells using the gradient ascent mean shift procedure. Segmentations obtained by application of the k-mean algorithm on green value component of previous images are presented in Figures 4e and 4f.
Morphological Segmentation – Watershed transform. The watershed transform is the fundamental tool of the mathematical morphology for segmentation of images. For a complete review of this topic we refer the reader to (Dougherty, 2003). The watershed concept comes from considering the image as a
topographic surface, in which grey levels correspond to terrain altitudes. Segmentation is performed by flooding or rain falling simulation, and the resulting catchment basins (which correspond initially to the regional minima of the image) form the final segmentation. Classical watershed transform is applied to a gradient image, generally presenting many regional minima, which leads to oversegmentation.
In order to overcome this problem many strategies have been proposed. An extended watershed approach for color images was proposed by Lezoray et al. (1999, 2002), in which color information is used for extracting the markers and for defining a function that combines the color gradient module with the mean color value of the region for determining whether one point is inside the region. Likewise, markers were extracted from bone marrow images by a mean shift procedure, and used as the seed in a watershed segmentation applied on the color gradient image (Pan et al., 2003). Multiple markers within the same object can be obtained when they are extracted by thresholding. Then, a unique marker is associated to one object by performing a morphological closing on the markers so that they touch each other. The parameters used for these operations are related to the maximum object size which can be previously determined from a granulometric analysis (Mahona Rao & Dempster, 2002). In addition, watershed region merging was also used for enhancing the watershed segmentation by Wang et al. (2006). For doing this, a series of rules on surface, depth and volume of adjacent watershed regions were used as merge criteria.
Boundary Based Segmentation
Edge detectors. Classical edge detection approaches are based on detection of abrupt neighborhood changes in the pixel values. In many cases, the boundaries between cells and their components are not clearly defined, and then edge detection performs poorly on these images (Wu & Zeng, 2006). Even so, edge operator performance can be improved when it is combined with other techniques. The Teager energy filter and morphological operators were proposed for segmenting leukocytes (Kumar, 2002). Similar scheme was used by Piuri et al. (2004), but the Canny edge operator was used.
Deformable contour models or active contours. A deformable model is a curve that evolves toward boundary contours using local information of the image. Two main models of active contours have been proposed: explicit models (snakes) and implicit models (level sets).
Explicit models aim at minimizing the energy attached to a curve describing the contour of the object. The optimization function is defined as a linear combination of external forces (computed from the image properties) and internal forces (defined by elasticity and stiffness of the curve). Ongun et al. (2001b) proposed a snake for segmenting leukocytes, for which external forces are computed from the intensity and gradient magnitude of the image and a corner force attraction. Likewise, a gradient flow vector was used to define these external forces in (Theerapattanakul et al., 2004; Zamani & Safabakhsh, 2006). This approach was also used by Yang et al. (2005) but the gradient flow vector was computed from the L*u*v* color space (this was also used by Tuzel et al., 2007).
Implicit models represent the evolving object contour through a function of higher dimension defined over the image area, which is positive inside the region, negative outside and zero on the boundaries. The deformation of the contour is generally described by a partial differential equation (PDE). Level sets can be viewed as region or boundary based approaches. In boundary based methods, the function determining
the evolution of the contour (stopping function) is based on the gradient of the image. Nilsson & Heyden (2001; 2005) used this scheme to segment leukocyte components. For nuclei segmentation, the stopping function is defined by a threshold value on the RGB color space, while the image gradient is used for cytoplasm segmentation. On the other hand, region based level sets define the contour derivative as a function that depends on the stiffness of the curve and an energy term, which is minimum if inside and outside regions are homogeneous. Dejmal et al. (2005) proposed a linear combination of region and boundary criteria for segmenting erythrocytes.
Active contours are useful in segmentation of clusters of cells, however they require a relatively high computational cost, and resulting contours do not correspond with the exact borders of the cells. Then, they are not appropriate in differentiation process based on the contour shape, like in erythrocyte classification.
Segmentation Improvement
After segmentation, an image can be thought of as a binary map of background and foreground objects. In some cases, this initial segmentation is not satisfactory, as holes and artifacts can appear. Improving the segmentation results can be done through a set of operations based on a priori knowledge. Morphological operators are commonly used for this purpose.
Basic morphological operators are often used after segmentation process for reducing artifacts, filling holes or removing border objects (Anoraganingrum, 1999; Sabino et al., 2004; Jian et al., 2006, among others). Binary erosion shrinks image regions and eliminates small objects, whereas binary dilatation enlarges image regions, allows connecting separated blobs and fills small holes.
Segmented objects that are not interesting for the analysis can be removed using connected operators, such as the opening by reconstruction or the area opening. These operators are filtering techniques that eliminate some regions without modifying the boundaries of the remaining regions. Connected operators implemented as pruning strategies of a tree representation was presented by Díaz et al. (2009) for removing staining artifacts and border touching cells.
SPLITTING OF CLUMPED CELLS
An important problem in analysis of blood and bone marrow smears is the clumped or touching cells. Many approaches have been proposed for separating them, some of them included as part of the
segmentation and other specifically dedicated to separate superposed cells. For instance, some leukocytes segmentation approaches working on a sub-image that are extracted from the original image, cutting a square around the segmented nucleus (Kovalev et al., 1996; Jiang et al, 2003, Sinha & Ramakrishnan, 2003; Theerapattanakul et al., 2004; Zamani & Safabakhsh, 2006). Under the assumption that each sub-image has only one white cell, other a priori are included for segmenting it. Kovalev et al. (1996) and Katz (2000) introduce circle-shaped restrictions, whereas color information is used for performing
clustering around the detected nucleus by Jiang et al. (2006) and by Sinha & Ramakrishnan (2003). On the other hand, restrictions included into the fitness function of deformable models allow to deal with
overlapped cells (Liu & Sclaroff, 2001; Theerapattanakul et al., 2004; Zamani & Safabakhsh, 2006). Single and complex morphological operators have proved useful for the segmentation of touching blood cells. Opening operator was applied for separating leukocytes (Kumar, 2002; Dorini et al., 2007; Pan et al., 2003). Hence, a series of morphological operations was applied for splitting composite erythrocytes by Di Ruberto et al. (2002). This procedure was composed of a morphological opening by a flat disk-shaped structuring element, followed by a morphological gradient, an area closing and a thinning operator.
Distance transform (i.e. a function associating to every pixel of a binary image its distance to the border) of the segmented clumped shape is also used in some clump splitting approaches. The maxima in the distance image can be used as markers for subsequent segmentation of the original image by the watershed algorithm (Malpica et al. 1997; Angulo & Flandrin, 2003a, Nilsson & Heyden, 2005) or another region growing approach (Hengen et al., 2002). But the watershed segmentation can also be applied
directly on the distance image for separating circular shapes (Lindbland, 2002). These approaches present good results for splitting clumped cells with small overlaps, but they fail when the overlapping area is too important. An improved approach which introduces geometrical restrictions on the distance function was presented by Pan et al. (2006a). The purpose of these restrictions is to improve the segmentation accuracy and to reduce the computational cost of the watershed computation. Figure 5 shows an example of splitting clumped cells using the watershed transform applied on distance transform. On the segmented image (Fig.5b), the Euclidean distance transform is computed (Fig.5c) and the regional maxima of the distance transform (Fig.5d), are used as markers of the watershed transform (Fig.5e).
Figure 5 Clump splitting using distance transform and watershed segmentation.
Other approaches for separating clumped cells are based on a concavity analysis, which assume that superimposed objects can be separated by one line joining two specific cut points where the boundary curvature abruptly changes. Concavity analysis is commonly composed of three sequential steps: detection of concavity points, detection of candidate split lines and selection of best split lines. Poon et al. (1992) presented a method for splitting clumped cells that uses the difference of the tangent angles between neighborhood boundary pixels for finding two cut points on the boundary which are then joined by a line for separating the shape. This approach separates pairs of cells but cannot handle clusters of multiple cells.
An approach that allows separating complex clumped cells proposed by Kumar (2002) was used in (Sio et al., 2007). In this approach, cut points are detected by measuring the concavity depth, defined as the distance from the boundary point to the convex hull border. Then candidate split lines are selected from those obtained by joining all possible pairs of concavity pixels, based on the distance and alignment of points. Finally a “measure of split” is computed for selecting the best split lines (Kumar, 2002). The drawback of these methods is that they depend on implicit conditions about cell shape or size. Morphological operations are limited by the overlapping degree between cells since two shapes can be separated if their centers are separated (Serra, 1982). Whereas, concavity analysis demands very accurate segmentation in order to detect the cut points.
Template matching strategies attempt to find parts in the image which correspond to predefined shapes named templates, without any other a priori information. These approaches have two important
components: the template definition and the matching strategy, which is commonly formulated as an optimization problem. Halim et al. (2006) proposed a template matching strategy for detection of
erythrocytes. A healthy erythrocyte represented by a gray scale template was constructed from the original image, based on cross correlations between the predefined binary templates and the image. Then, cross correlation was also used as optimization criterion in order to detect the actual erythrocytes. On the other hand, Díaz et al. (2007a) proposed a matching strategy based on superposition of the chain code
representation of the clumped shape contour and an ideal erythrocyte, estimated from the original image by an Expectation-Maximization algorithm. Although these strategies can overcome the drawbacks previously described, they are computationally expensive and are applicable only for separating shapes that do not present large shape and size variations.
FEATURE EXTRACTION AND SELECTION
Differential analysis of blood and bone marrow smears is feasible thanks to the capacity of visual system to distinguish image patterns, which are associated to specific cell classes. Thereby, the challenge of automatic image analysis systems is to carry out computational methods to calculate objective cell measures related to those visual patterns. The aim of feature extraction step is to obtain a set of descriptors, which will be further separated in different classes by a classification procedure.
The feature extraction can be formally defined as a function , which maps the original image I onto a feature vector x, i.e. f I: x ( ,x x1 2,...,xd), where d is the number of features used for characterizing
the image.
Visual Descriptors
Computational visual descriptors can be classified as chromatic, textural and shape measures. Chromatic features are related to the color image information, textural features provide statistical information on the local structures in the image, and shape measures describe geometrical information of objects like perimeter, area, circularity, etc. In the rest of this section we discuss some common measurements used for describing the blood and bone marrow cells.
Chromatic features
These features describe the grey-level or color distribution of the images, which are the most
discriminative features of blood and bone marrow cells. Let R{ ,p p1 2,...,pn} be a set of pixels that
belong to a segmented object (nucleus, cytoplasm, parasite or complete cell). Intensity and chromatic features are computed from histograms of R. Color histograms can be represented by one single multi dimensional histogram or multiple separate 1-D histograms.
Considering an image as a stochastic process where every pixel value is modeled as a random variable, the histogram can be regarded as the probability density function of grey level or color distribution. The most used measures from a histogram h are provided by its moments: mean, variance, standard deviation, kurtosis and skewness, which describe the histogram shape and are computed as1:
2 3 3 3 4 4 4 : ( ) : ( ) ( ) : : ( ) ( ) : ( ) ( ) 3 : ( ) ln( ( )) k k k k k Mean kh k Variance v k h k Standard Deviation v Skewness k h k Kurtosis k h k Entropy e h k h k
The standard deviation is a measure of dispersion of the histogram, whereas the skewness and kurtosis respectively measure the dissymmetry and flatness (or peakedness) of the distribution.
An important issue in chromatic descriptors is the color space used for representing the color in the images. Traditionally, images are acquired using the RGB color model, in which each color pixel is represented by its three components: R(Red), G(Green) and B(Blue). But the statistical distributions of
1In some cases only mean and standard deviation are utilized together with features from other categories such as texture or
those three components are highly correlated, and then, many decorrelated models have been proposed for digital image processing (Plataniotis & Venetsanopoulos, 2001) and some of them have been used for blood and bone marrow cells description.
Discrimination of platelets, red and white cells in peripheral blood smears has been correctly
accomplished using only the average intensities of R, G and B color components and cell size (Lin et al. 1998). Nevertheless, discrimination of subclass cells as leukocyte or erythrocyte types usually requires other features, such as textural or geometrical measures.
Leukocyte classification systems have used chromatic statistical measures as part of a feature vector. Kovalev et al. (1996) used standard deviation of red and green intensities for describing chromatic features of leukocytes. R, G and B components and color ratios green/red and green/blue were used by Katz (2000), together with the nucleus area and perimeter, for the same purpose. Similar features were used by Song et al. (1998) and by Sinha & Ramakrishnan (2003). Likewise, RGB color histograms computed from original and gradient images, were used along with many other features (Siroic et al., 2007). On the other hand, CieLab and HSV transformations have also been used in leukocyte color characterization (Ongun et al, 2001; Comaniciu & Meer, 2001; Angulo & Serra, 2002).
Chromatic features have also been used for distinguishing live stages of hemoparasites, particularly malaria. HSV color model histograms were used for describing segmented parasites which were classified as mature and immature throphozoites (Di Ruberto et al., 2002). For the authors, parasites in these live stages are differentiated by their nucleus and spot of chromatins, which are evident in the hue and saturation components. Statistical features derived from the red, green, blue, hue and saturation
components were part of a set of features used by Ross for classifying malaria parasites into different live stages (Ross et al., 2006). Same measures computed from the normalized RGB color model, were used for classifying erythrocytes as healthy or infected at any infection stage by Díaz et al. (2009).
Shape descriptors
Another important feature to the human visual system is the shape. Many shape measurements have been proposed in the literature. A comprehensive review of general purpose shape descriptors was published in (Zhang & Lu, 2004). In hematological applications, the geometrical or “simple” shape descriptors are the most popular because they are easy to compute, but indiscriminative for small dissimilarities. Other used descriptors include geometrical moments, structural representations and spectral features.
Geometrical features. Geometrical features describe different aspects of the cell or component structure, such as size or shape. In hematological applications they are widely used because various cells differ greatly by their size or nucleus shapes. Geometrical features are computed on a region of interest R, which has a well defined closed boundary composed of a set of consecutive pixels S{ ,s s1 2,..., }sn .
Simplest geometrical features are area, perimeter, centroid, tortuosity (area/perimeter) and radius. The area feature is computed as the number of pixels enclosed by the cell boundaries (Bacus, 1976),
{ ( )}
A card R . The perimeter, 1
1 1 1
| n | ni | i i |
P s s
s s , corresponding to the total distance betweenconsecutive points of the boundary . The centroid is the average of coordinates of all points of R: ( , ) 1 i i i x y R x x A
, ( , ) 1 i i i x y R y y A
. The radius is measured by averaging the length of the radial line segments defined by the centroid and border points
1 1 | ( , ) | n i i R s x y n
. Other features for describing shape structure
include measures of major and minor axis, which are provided by the eigenvalues of the second order moments matrix; the circularity or elongation (Thera-Umpon & Gader, 2002), computed as the ratio of the square of the perimeter to the area ( ); the eccentricity, defined as the ratio between the major and minor axes (Sinha & Ramakrishnan, 2003); the symmetry, calculated from the distance between lines perpendicular to the major axis and the cell boundary (Stanislaw et al., 2004; Markiewicz & Osowski, 2005); and the spicularity, proposed by Bacus et al. (1976), spicules are defined as the points where chain code derivate change of sign.
In addition, other specific features have been proposed, which are more strongly linked with blood cell analysis. For example, the nucleus and cytoplasm areas ratio and the number and structure of nucleus lobes are prominent features used for identifying the class of the leukocytes (Beksak et al., 1997, Sinha & Ramakrishnan, 2003, Hengen et al., 2002, Ballaro et al., 2008). Likewise, number of chromatin dots, and the ratio between parasite area and cell area have been used for identifying the infection stage and class in malarial image analysis (Ross et al, 2006).
The main drawback of the geometrical features is that their application demands accurate segmentation of the region of interest, and then they are commonly used together with other features more robust to segmentation errors, such as texture or chromatic descriptors.
Structural based representations. Structural methods decompose the shape or contour region into parts that are geometrically meaningful for the image. A structural representation widely used is the convex hull (de Berg et al., 2000), corresponding to the smallest convex polygon H containing the region R ( RH). Once computed the convex hull, shape can be represented by a string of concavities as chain code representations or by measures based on convex hull such as its area or region compactness
computed as cell area/convex hull area ratio (Mircic & Jorgovanovic, 2006; Ballaro et al, 2008). Region skeleton it is another shape representation that allows to encode both boundary and region information for every object (connected component). Many algorithms for generating skeletons have been proposed. Di Ruberto et al. (2002) applied the sequential thinning process for representing segmented malarial parasites as connected thin lines. The end points of the obtained skeletons are used as shape descriptors for distinguishing either immature disk-shaped parasites or mature irregularly-shaped parasites.
Spectral based features. In order to provide descriptors less sensitive to noise and boundary variations, several authors have proposed to use a representation of pattern shapes in frequency domain. Those spectral features include Fourier descriptors and wavelet descriptors, which are usually derived from spectral transform on shape signatures (functions derived from the shape boundary points).
Features obtained from the direct application of the discrete Fourier transformation are not invariant to geometrical transformation, and then different extensions have been proposed. Elliptic Fourier descriptor (EFD) proposed by Kuhl & Giardina (1982) was used for characterizing nuclei shapes of leukocytes (Comaniciu et al., 1999) and megakaryocytes (Ballaro, et al., 2008). EFD is a Fourier expansion of the chain coding contour, which is represented as a composition of ellipses defined as contour harmonics that result from expanding separately the components and in the complex function of coordinates
. The EFD corresponding to any closed curve S with Euclidean length l and composed of k points is described by the nth harmonics given by:
Where
i j j i s s 1, is the length of the first i vectors,
2 2 i i i x y s , xi
xixi1
and
1
yi yi yi . The coefficients of the EFDs are normalized to be invariant with respect to the size, rotation, and starting point, using the ellipse of the first harmonic.
l ns l ns s y n l d l ns l ns s y n l c l ns l ns s x n l b l ns l ns s x n l a i i k i i i n i i k i i i n i i k i i i n i i k i i i n 1 1 2 2 1 1 2 2 1 1 2 2 1 1 2 2 2 sin 2 sin 2 2 cos 2 cos 2 2 sin 2 sin 2 2 cos 2 cos 2 Another extension of the Fourier descriptor used as cell shape feature is the UNLF (Universidade Nova de Lisboa, Portugal) descriptor. The UNLF descriptor is computed by applying 2-D Fourier transform on the image curves transformed to the normalized polar coordinates. The main advantage of this descriptor is that it is able to handle open curves, lines and patterns composed of parametric curves as well as cells with interior components. Kyungsu et al. (2001) used it as shape descriptor of erythrocytes in order to include information about its concavity, observed as holes in a binarization process. The main drawback of UNLF descriptor is that it produces feature vectors of high dimensionality, and then feature selection approaches should be applied.
The use of wavelet transformation has been proposed as shape descriptor in many applications in order to achieve description of shape features in a joint spatial and frequency space. However, they have not been much used for cell description. In Sheik et al. (1996) only, largest wavelets coefficients were used for classifying cells as platelets, white or red cells.
Textural features
Traditional machine vision and image processing approaches assume uniformity of intensities in local image regions, but some objects present a repeated pattern as principal visual feature, which is called texture. In hematological applications the texture property has proved valuable for distinguishing some abnormal cells and parasite presence and evolution.
Texture analysis is generally applied on a grey scale representation of the image. However, as in segmentation approaches, different color models have been used for textural analysis. Hengen et al. (2002) perform the texture analysis in H component of HSI model (Hengen et al. 2002). Ongun et al. (2001) use an image distance as input for computing a grey level co-occurrence matrix which is computed as the distance between the pixel color and coordinate origin in the CIELab model. Finally, Angulo and Serra (2002) extend the texture analysis to all RGB channels that are then integrated to compose one single texture feature (2002). Methods for extracting textural measures can be classified as: statistical, model based and geometric.
Statistical approaches: these are the most popular texture analysis methods, in which the texture can be defined by its statistical features, related to the pixel gray level conditional probability given its
neighborhood. The goal of these methods is to deduce statistical properties of this function from observed data (gray levels value of pixels). These methods are easy to implement, which is their main advantage. The gray-level co-occurrence matrix (GLCM) is a second order statistics, which is defined as follows:
( , ) #{( , ) {0, 1} {0, 1}, ( , ) ( , ) )} / ( * ) d x y GLCM i j x y W H I x y i I x d y d j W H
where d (d dx, y)is a displacement vector, W and H are the width and height of the image I, and #S is the cardinality of set S. Hence, GLCMd(i,j) is the probability of finding two pixels separated by vector d,
which have respective grey values i and j. Many feature vectors can be computed from the GLCM
(Haralick, 1979, Tuceryan & Jain, 1998). For example, Sinha and Ramakrishnan used the entropy, energy and correlation of the GLCM for characterizing the cytoplasm in leukocytes (Sinha & Ramakrishnan, 2003). Additionally, Sabino et al. (2004a) used the contrast feature for recognition of leukocyte. The main drawback of the GLCM approach is that their calculation is computationally expensive even if the grey level values are quantized. Sum and difference histograms are a modification of GLCM in which two histograms are calculated counting grey level differences and sums for all the pixel couples separated by vector d. In hematological applications this method has been used in the differentiation of blood cells type (Siroic et al., 2007) and the classification of leukemia blast cells (Stanislaw et al., 2004; Markiewicz & Osowski, 2006).
Another statistical approach used to characterize blood cells is the autocorrelation coefficients (Sinha & Ramakrishnan, 2003); this second order statistic may be calculated as:
1 1 2 1 1 ( , ) ( , ) * ( , ) , 1 , 1 ( )( ) ( , ) W p H q i j W H i j I i j I i p j q W H ACC p q p P q Q W p H q I i j
where are neighborhood size parameters.
Model based approaches. These approaches are based on the assumption that the texture corresponds to instances of mathematical models, in which parameter models should be found. Feature extraction based on the Markov random fields (MRF) is a representative model based approach. It is a generalization of Markov chains in 2-dimensional space, where the time index is replaced by spatial indexes and the Markov restriction is applied into the neighborhood of each pixel. Hence, texture is characterized by the parameters that define the MRF for observed pixel values and a certain topology, defining the local dependencies. According to the Hammersley-Clifford theorem, solving this problem is equivalent to estimating the parameters of a Gibbs distribution if the MRF has translation invariance and isotropic properties, which is assumed in image processing applications. MRFs have been used as feature descriptor of leukemia blast cells (Stanislaw et al., 2004; Markiewicz & Osowski, 2006).
Other model based approaches used in blood cells characterization are the autoregressive models, which were used for characterizing bone marrow cells for differential counting analysis (Ongun et al., 2001) and malignant lymphomas and chronic lymphocytic leukemia in peripheral blood smears (Comaniciu et al., 1999; Comaniciu & Meer, 2001). The autoregressive model of order n+2 is a time series of order n, in which the time variable is defined in a 2D spatial domain. The other 2 parameters correspond to the mean and variance of a white noise added to the model. Maximum likelihood estimation is commonly used for inferring the model parameters.
Geometric approaches. Texture features may also be derived from geometric models. In these approaches, texture is defined as a repetitive pattern composed of texture element named textons. Granulometry analysis was proposed as a texture feature for describing nucleus granules, in order to characterize different kinds of leukocytes. Angulo & Serra (2002) applied the granulometry analysis for calculating texture features used in cell retrieval and leukocyte classification systems. A similar work was presented by Theera-Umpon and Dhompongsa in classification of leukocytes (Theera-Umpon, 2007). A texture descriptor based on resulting regions of a watershed segmentation was proposed in (Hengen et al., 2002). A cell nucleus is segmented applying standard watershed and then the ratio between the interior area (i.e. without boundary) of watershed regions and the area of the whole nucleus is computed. ( 1 /
n
i nucleus
i A A
with n= number of watershed regions).Recently, image analysis approaches based on analogy with syntactical document analysis have been proposed. In texture description, the idea of a texton element associated to a visual word was used by Tuzel et al. (2007) for characterizing cell nucleus and cytoplasm. A texton dictionary is generated from a set of training images of each class. For this, a filter bank was designed, composed of two rotationally symmetric filters (Gaussian and Laplacian of Gaussian) and 36 edge and bar filters with different scales and orientations. Then filter responses inside the segmented images were clustered using the k-means algorithm and the cluster centers were the selected textons. Using the resulting texton dictionary, the new cells are represented with their texton histograms.
Feature selection
Feature selection is a process commonly used in pattern recognition, which allows determining the most relevant, discriminating and uncorrelated features of a classification task, while reducing the
dimensionality of vectors associated to objects. Although original feature vectors extracted from blood and bone marrow cells are usually large, feature selection processes are not often applied in published studies.
There are many techniques of feature selection, which can be classified into three categories: filter methods, wrapper methods and embedded methods (Molina et al., 2002; Saeys et al., 2007). In the first category, feature selection is based on quantitative measures of how well the features discriminate the classes, independently of a specific classification algorithm. In the wrapper approaches, the contribution performance of every component is taken into account by the classifier algorithm. Embedded methods refer to classification procedures that include the feature selection as a step in the whole classification procedure, for example decision trees. Wrapper models outperform other models because they are optimized for the specific classification approach, but they are computationally feasible only for small feature vectors.
Another relevant issue in the feature selection processes is the search strategy which can be exhaustive (brute-force or complete search), heuristic (sequential) or non-deterministic (randomized) (Molina et al., 2002). Exhaustive search generates the optimal subset of n features in a search space of possible subsets. Heuristic approaches select features that maximize a criterion function. Sequential forward selection starts selecting the best single feature and successively adds one feature at the time, whilst sequential backward selection starts with the whole set of features and then deletes one feature at the time.
In hematological applications, comparison of several feature selection approaches has been performed. Markiewicz et al. (2006) evaluated two filter approaches (correlation analysis, mean and variance
measures) and one wrapper of linear support vector machine (SVM) for selecting features from a vector of 164 dimensions, in order to distinguish 10 classes of leukocytes. The best approach was the correlation between the feature and the class as well as the linear SVM ranking. Likewise, a wrapper method with sequential forward search strategy applied on a naive Bayes classifier was used in (Sabino et al., 2004a). 12 relevant features were selected exploring morphometry, texture and color feature sets separately, i.e. 4 features for each one.
Genetic algorithms have been proposed as a feature selection process in (Siroic et al., 2007). In this approach, each set of possible features is represented as chromosomes and genetic operators such as mutation and crossover are applied in order to find the best solution(s) according to a fitness function, defined as the classification error on the validation data set when a SVM is used as classifier algorithm. From reported results, features selected with this approach proved better classification performance than the ones selected by wrapper of linear SVM.
On the other hand, some approaches called by many authors “feature selection”, do not properly perform a selection of features, but carry out a reduction of dimensionality by projection or combination of them. Principal component analysis (PCA) is the most popular technique for dimensionality reduction. The aim of the PCA is to find a set of orthogonal vectors in feature space corresponding to directions along which the data present the maximal variance. Dimensionality reduction is performed projecting the data from their original space onto the orthogonal subspace. Kyungsu et al. (2001) used PCA for reducing a 76d vector in order to classify erythrocytes and leukocytes, achieving dimension reductions between 12% and 50%. A non-linear extension of PCA, called kernel-PCA, which maps input data into high dimension feature space using the kernel trick was employed by Pan et al. (2006)
SINGLE CELL CLASSIFICATION
Once the cell features are extracted and selected, they should be input into a process that classifies the cells according to hematological concepts. An automatic classification system should be able to identify these concepts within the context of real images, i.e. noisy images with visual differences between concepts, which are variable. This problem may be addressed from two different perspectives: analytic and inductive. The analytic standpoint requires a deep understanding of the way the low-level features are combined to structure concepts. The inductive standpoint automatically builds a model of concepts based on a number of training samples, a framework commonly used through several machine learning
approaches.
Many learning approaches have been used to classify blood cells. The simplest model is the Bayesian classification (Aksoy, 2002; Sabino, 2004; Theera-Umpon, 2004), which is based on applying the Bayes theorem with independence assumptions between features. In the training step the a priori probabilities of
each class are computed, and then used for estimating the class of new instances by the maximum a
posteriori rule. Despite its simplicity, Bayesian classification can perform accurate classifications if
features are discriminative. Conversely, k-NN classifies unlabeled samples based on their similarity with samples in the training set without any knowledge of a priori class probabilities. Given the knowledge of N prototype features and their correct classification into M classes, the k-NN rule assigns an unclassified pattern to the class that is most heavily represented among its k nearest neighbors in the pattern space, under some appropriate metric. k-NN was used by Tek et al. (2006) to classify stained regions as parasites or not. Likewise, Comaniciu et al. (1999) use this technique for distinguishing lymphoproliferative disorders.
Artificial neural networks (ANN) are the most used classifiers in hematological applications. ANNs are networks of simple processors that emulate the behavior of human brain. Many network architectures and training algorithms have been proposed and are well described in literature (Bishop, 1995). The most popular learning algorithm is the multilayer back propagation (ML-BP), which was used in many studies (Lin et al, 1998; Kim et al., 2001; Mircic & Jorgovanović, 2006; Ross, 2006; Theera-Umpon & Gader, 2002). Other algorithms used in the literature include ALOPEX (Lin et al., 1998), Radial basis function – (RBF, Djemal et al., 2005) and Linear Vector Quantization (Ongun et al., 2001).
Recently Support Vector Machines (SVM) approaches have received increasing interest because they have outperformed other methods in several pattern recognition problems. The SVM is based on the mapping of the input vectors into a high dimensional feature space, induced by a kernel function chosen a priori. In the feature space the learning algorithm produces an optimal separating hyperplane between two classes. In principle, a SVM is a linear discriminator; however it can perform non-linear discrimination thanks to the fact that it is a kernel method. The multi-class classification problem is solved constructing several binary classifiers and combining them. The most used strategies are against-one and one-against-all combinations. In the former, a binary classifier is trained for all combinations of classes and final decision is made by majority rule among the classifiers (Stanislaw et al. 2004; Ramoser et al., 2005; Markiewicz et al, 2005; Guo et al., 2006; Siroic, 2007; Tuzel, 2007). In the latter, for each class a binary classifier is trained by labeling the samples from the class as positive examples and samples from the other classes as negative examples, the final decision is assigned to the class having maximum decision function among all classes (Pan, 2006).
An important issue found in hematological applications is the fact that cells can be classified using hierarchical classifier structures, which take advantage of morphological taxonomy of the blood cells for extracting the most discriminative features in each classification level. Kim et al. (2001) proposed a two stage structure of ANN for classifying erythrocytes according to their shape features. Firstly, the most varied shapes were discriminated, and then circular shapes were classified as normal, target, spherocyte or stomatocyte. The same strategy was used by Ross (2006) in the classification of infected erythrocytes; a first stage decides whether erythrocyte is infected or not and a second stage defines the infection stage. Similar strategy was used by Díaz et al. (2009), but based on a SVM classifier.
CASE OF APPLICATION
To conclude this chapter with an application case, we briefly present in this section the application of the general framework to the analysis of malarial infected blood smears. More details can be found in Díaz et al. (2009). The main goal of analysis of malarial infected smears is to estimate the infection level of each smear. For this, we need to count the number of infected and non-infected erythrocytes but also to
estimate the life stage of each parasite. As shown in Figure 6, discrimination of these cells is very difficult due to the slight differences between consecutive life stages.
Figure 6 Single erythrocyte samples. From left to right: two healthy erithrocytes, two erythrocytes infected with ring stage parasites, two erythrocytes infected with throphozoite stage parasites and two erythrocytes infected with schizont stage parasites.
Image Acquisition
Images were digitized using a Sony high resolution digital video camera, which was coupled to a Carl Zeiss Axiostar Plus microscope. Use of intermediate lens and a 100 power objective yielded a total magnification of 1006. Optical image corresponded to 102 76 m
2 for a 640 480 image size, resulting in a resolution of0.0252 m
2.Image Preprocessing
Original images presented luminance variations mainly due to film inhomogeneities and varying
illumination condition of acquisition devices. In order to correct the background inhomogeneities, a local low-pass filter was applied on the luminance channel from the YCbCr color space i.e. a low pass filter applied on sub-windows of approximately the larger size of erythrocytes in the image, and smoothed out using a moving window whose size was adjusted in order to eliminate the tiling effect of the filter. Figure 7b shows an example of application of this procedure.
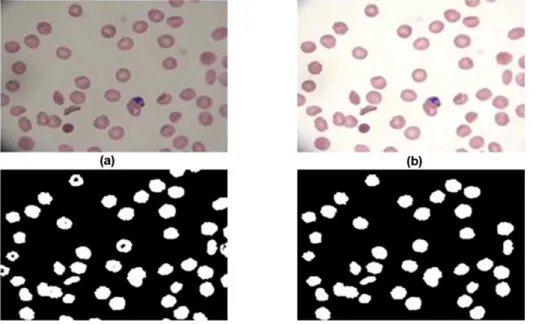
Figure 7 Processing results of malarial infected blood smear images. (a) Original Image. (b) Pre-processed Image. (c) Pixel-based classification result. (d) Result after filtering by inclusion-tree representation.
Erythrocyte segmentation
Automatic quantification of malarial infected blood smears has been designed on the base of detecting parasites and erythrocytes independently, and to locate the former into the latter to quantify the infection level. However, in early infection stages, the boundaries are not clearly defined, and segmentation is very difficult. So, the analysis of the erythrocyte-parasite as a whole was proposed as an alternative procedure. This stage tries to extract single erythrocytes from the background as follows: first, a pixel classification
allows labeling each image pixel as either background or foreground, based on its color features. Then, segmentation is improved using an Inclusion-Tree structure, which is simplified to satisfy the restrictions imposed by the erythrocyte morphological structure and its spatial organization. This simplification allows removing artifacts generated at the staining or digitization processes. Figure 7c shows an example of an image segmented with pixel classification procedure and its corresponding result after filtering process is shown in Figure 7d.
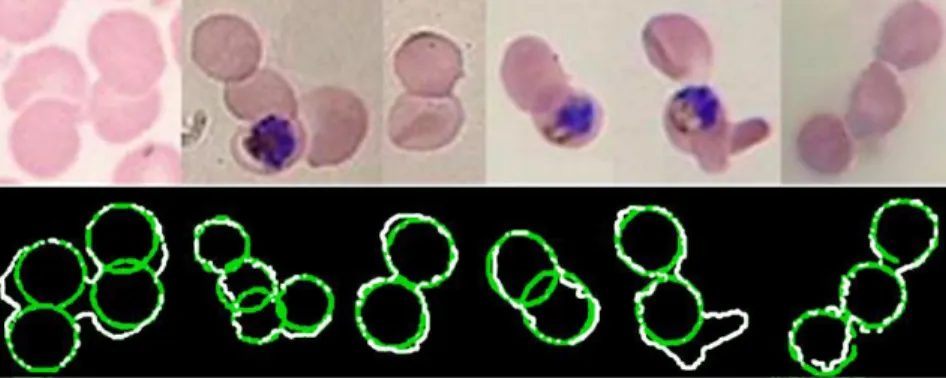
Figure 8 Splitting of clumped cells. Top: Original overlapped cells. Down: splitting results. In white image edges, in green cells found by the proposed approach (Díaz et al. 2009).
As the presence of clumped cells affects the automation of erythrocyte quantification, splitting was achieved by a template matching strategy that searched for the best match between a chain code
representation of the clumped shape contour and an ideal erythrocyte, estimated from the original image by an Expectation-Maximization algorithm. This approach attempts to find cells in clumped shapes similar to erythrocytes found in the same image.
Feature Extraction
Visual features of erythrocytes were described by the moments (mean, variance, standard deviation, kurtosis and skewness) of a set of histograms that represent the probability density function of the color, saturation, intensities, texture and edges inside the whole cell. So, an image was represented by 25 features that characterize the five histograms.
Cell Classification
Erythrocyte classification was carried out by learning from samples approach composed of a hierarchical (two levels) ensemble of classifiers. At first level, a classifier was trained for deciding whether or not an erythrocyte was infected. Once an erythrocyte classified as infected, a second level determined the stage of infection using a set of classifiers, composed of four learning models: one model for each class and one more for detecting possible artifacts. The erythrocytes that were misclassified into none, two or more classes were ruled out and left to the user for a later visual decision. Training algorithm for any learning model was selected by evaluation of their performance using a one-against-all strategy, resulting in an array of: one polynomial SVM, two radial basis function SVM and a neural network training models.
The performance of classification task was evaluated using a Fmeasure, which is related to
effectiveness. Parameter allows assigning relative weights to the true positive and precision rates for dealing with class imbalance problem. A set of 12,557 erythrocytes composed of 11,844 healthy ones, 521 in ring stage infection, 109 in trophozoite stage infection and 83 in schizont stage infection, was used, which were automatically extracted from malarial infected blood smears. The whole set was randomly divided into training (40%), validation (30%) and test (30%) sets. Training and validation sets were used for parameter tuning of the classifiers while the test set was used for the final evaluation of the method performance.
Using the strategy of classification presented above, this approach achieves good performance in classification of the different stages of infection on single erythrocytes extracted from malarial blood