Review of Streamer Dynamics and Surface Charge
Accumulation on Ice Surfaces
M. Farzaneh, I. Fofana
*International Research Centre on Atmospheric Icing and Power Network Equipment (CENGIVRE) at Université du Québec à Chicoutimi, Quebec, Canada, G7H 2B1
Abstract
This paper reviews the main contributions of the CIGELE research team to the dynamics of streamer discharges along ice surfaces. These investigations were mainly performed under lightning impulse voltage, in atmospheric air. High-speed streak photography techniques were used to observe the streamers propagating between a rod-plane configuration half-submerged in ice bulk. The dynamics of streamer were investigated as influenced by the voltage characteristics, gap configuration, freezing water conductivity, and surrounding temperature. In addition to ice surface, corona discharge was also studied at insulator surface and at the air gaps between the electrodes in order to assess the role played by ice surface on discharge inception and propagation processes. The paper is not restricted to previously published work but contains a substantial amount of new material with a view to closing some major gaps in the present state of ice surface flashover knowledge.Keywords
Outdoor Insulation, Surface Charge, Streamer Propagation, Atmospheric Icing1. Introduction
The investigation of the discharges along ice surfaces is of considerable fundamental and practical interest[1, 2]. Indeed, it is important to know the parameters influencing the propagation of streamer discharges over ice surfaces in order to understand how the streamer characteristics could be influenced. This could be used to predict the interaction of these discharges with outdoor insulators, with eventual prospects at prevention. Although a large amount of experimental data on surface flashover has been accumulated[1-8], a comprehensive physical understanding of ice surface discharge has not yet been achieved. Owing to these observations and the necessity for knowledge development in this area, a research program was initiated at the NSERC / Hydro-Quebec / UQAC Chair on Atmospheric Icing of Power Network Equipment CIGELE at Université du Québec à Chicoutimi (UQAC) to investigate flashover processes over ice-covered insulator surfaces.
In some of these studies, the physical phenomena involved in ice surface flashover processes were examined, which allowed to quantify the way in which ice surfaces interact with propagating dis charges [3-6], thus permitting to determine the parameters influencing flashover process on an ice surface[7]. Those inves tigations were mostly
* Corresponding author: ifofana@uqac.ca (I. Fofana)
Published online at http://journal.sapub.org/eee
Copyright © 2012 Scientific & Academic Publishing. All Rights Reserved
performed using a highly sensitive, high-resolution, high-speed streak camera. The voltage and luminosity associated with streamer discharge were recorded simultaneously. Experiments were performed using a rod-plane setup under lightning impulse voltage. The basic properties of streamers were described in terms of the electric field required for their inception and the associated propagation velocity. Several parameters that strongly influence the phenomena have been considered, including gap configuration, freezing water conductivity, and surrounding temperature. Based on elements derived from the inception parameters, empirical models have been proposed to account for corona streamer propagation velocity and inception voltage/field on an ice surface. Several aspects of the discharge process at air-ice interface were shown to be different from those in the air. The streamer has also been simulated using a simplified streamer model[8].
In spite of works that have been accomplished, surface corona discharge still requires further investigation. The objective of this contribution is to review the accumulated research on the dynamics of streamer propagation over an ice surface. In addition, space charge formation on ice surfaces is investigated. Such investigations will be of high importance for increasing the reliability of insulators under icing conditions, and for closing major gaps in the present state of ice surface flashover knowledge.
2. Review of Streamer Dynamics on Ice
Surfaces
Streamer propagation determines the breakdown characteristics of many electrode configurations, including ice-covered HV insulators. A number of investigations have been performed in this area within the framework of the CIGELE[2-7]. To that purpose, high-speed streak photography techniques were used to observe the streamers propagating between a rod-plane configuration half-submerged in ice bulk. Under lightning impulse voltage, in atmospheric air, the propagation of a corona streamer along an ice surface was studied.
The effects of several experimental parameters, such as freezing water conductivity and HV electrode radius, on the streamer inception parameters of an ice surface have been examined. In addition to the ice surface study, corona discharge was also studied at insulator surface (PTFE) and, at the air gaps between the electrodes[3-7].
The obtained results allowed to quantify the way by which ice surface interact with the propagating discharge[3-6] and to determine the parameters that influence the flashover process on an ice surface[7]. The following parameters have been derived:
• Freezing water conductivity, • Pre-contamination,
• Electrode shape,
• Electrode axis orientation, • Arcing distance,
• Applied voltage characteristics (shape and polarity), • Surrounding air temperature, pressure and humidity, • Nature and types of ice deposits (hard or soft rime, glaze),
• Ice surface uniformity (roughness, presence of air gaps …).The possible influence of space charge accumulation on ice surfaces during the flashover process is still unclear.
Some investigations have been devoted to designing empirical models based on elements derived from the inception parameters to account for corona streamer propagation velocity and inception voltage/field on an ice surface[6]. Furthermore a simplified model has been proposed that suitably simulates streamer propagation along an ice surface for particular experimental conditions[8].
In this section, a review of the present state of knowledge of the corona streamer along an ice surface will be presented.
2.1. Streamer Inception
Basically, three conditions must be met to obtain streamer inception: i) a free electron, ii) a field applied above the so-called critical field strength, Ecr, and iii) a sufficient or
critical distance, dcr. The initial electrons may emerge from
natural ionization sources and/or residual charges from previous discharges. Initially, the total number of electrons is small, but as they move from the cathode to the anode, their number increases exponentially by electronic avalanche.
If an electric field is applied to a rod-plane configuration half-submerged in ice bulk, with electrode clearance of d, sufficiently high field streamers are initiated. It is assumed
that a few electrons are always present around in the gap, either through the action of cosmic rays or else as a consequence of field emissions from asperities on the surface, in the vicinity of which electric fields are strongly enhanced.
Prediction of the onset of streamer discharge along an ice surface is of general interest in the design of HV outdoor insulators covered with ice. In previous contributions[5, 6], empirical equations were determined on the basis of measurements performed on a rod-plane configuration half-submerged in ice bulk, with electrode clearance, d. These allowed predicting the corona inception field on an ice surface as a function of freezing water conductivity, ..and electrode radius r:
(
− σ)
=(
α( )
+β) (
− σ)
=Aexp B lnr exp B
Einc (1)
where Einc is expressed in kV/cm. The constants A (in kV/cm)
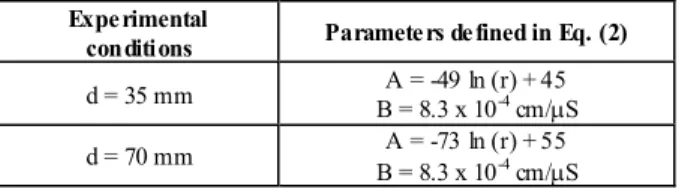
and B (in cm/µS) depend on the HV electrode radii r (cm) and the inter-electrode distance, d, as shown in Table 1.
Table 1. Parameters A and B as a function of the gap geometry Experimental
conditions Parameters defined in Eq. (2) d = 35 mm B = 8.3 x 10A = -49 ln (r) + 45 -4 cm/µS
d = 70 mm B = 8.3 x 10A = -73 ln (r) + 55 -4 cm/µS
However, further investigations are necessary to generalize this empirical equation, allowing a wider range of values.
2.2. Streamer Propagation
Once an avalanche has developed into a space charge cloud of positive ions, the local field may be sufficiently strong to start a new avalanche closer to the cathode. It is believed the required initial electron originates from photo-ionization.
Whether or not this process will go on until the cathode is reached depends on the applied field strength. If the streamer head ceases to propagate for some reason, the space charge will diffuse and recombine. The current will drop to zero and the discharge will fade out. To sustain stable advancement of a single streamer, an electric field must be applied and whose strength will depend on the energy supplied for initiating the streamer.
The presence of an ice layer between the electrodes modifies the spacing capacitance. Several factors may affect the streamer propagation and, so to speak, its velocity on an ice surface. The most direct explanation would be the electric field enhancement caused by permittivity. Since the ionization rate is a function of the local electric field, an enhancement of the field at the tip of the streamer will increase the coefficient rate[6].
A physical mechanis m which might plays an important role in the streamer propagation process is the release of electrons from the ice surface due to various mechanisms, including photo-ionization.
subject of many studies[9-11] and the ice surface melting phenomenon is well documented. Our understanding of the melting of the ice surface is based on the modern theory of premelting[9-11]. Surface premelting refers to a less familiar, but no less common, process whereby a liquid film, known by various names as the quasi-liquid layer, liquid-like layer, surface melting layer, or premelting layer, is present at the ice surface at temperatures below the bulk melting transition. The film thickness is extremely sensitive to temperature and to the amount of dopant[9-11]. Using infrared spectroscopy techniques, Sadtchenko and Ewing[11] determined the thickness of this water film for ice surface temperatures ranging from -28℃ to -0.02℃ (Figure 1).
At temperatures around -10℃, the presence of a liquid component on the ice surface becomes evident. Previous studies on ice surface discharges[7] have shown the major role played by the presence of a water film and high surface conductivity on the breakdown voltage.
Using a two-active-electrode system of radius r = 6 mm, half-submerged in the ice system, and separated by a distance d = 18 mm, it was found that the breakdown voltage decreases with increasing temperature.
Figure 1. Quasi-liquid layer thickness as a function of ice surface temperature, reproduced from[11]
It has also been acknowledged that during the freezing process, impurities are rejected from the solid part towards the liquid portion of drops or droplets[12]. Because the impurities are non-volatile and insoluble in ice, small amounts of them can move to the surface increasing the surface conductivity and decreasing the activation energy[10]. Indeed, it is known that the impurity incorporation process influences the surface structural phase transitions by reducing the surface energy[9, 10]. The conductivity of this liquid-like water film, can reach values as high as ten times those of the freezing water conductivity[12].
From the range of atoms and molecules that may be found at the head of the streamer, NaCl and derived Na atoms have almost the lowest ionization energy[9, 13, 14]. The liquid or liquid-like film is an electrolyte solution containing, for example, monovalent ionic species such as NaCl. Salts give
strong electrolytes when dissolved in water. At temperatures below the melting point, the surface conductivity increases rapidly with rise in temperature, with an increase in the mobility of the different kinds of ions in the solution, thus causing a corresponding increase in the conductivity. This temperature effect on conductivity is opposite to that observed in most electric conductors.
Melting, therefore, tends to reduce the interfacial free energy. This is also supported by the observation that the mechanical disturbance of an ice surface increases the surface conduction since it produces many lattice defects and electrically-mobile ion states in the surface region. Avalanche growth and streamer propagation on an ice surface could, therefore, be controlled by increasing the ionization coefficient, because molecules in such a layer are more mobile and electrically active defects are more abundant. Increased ice surface conductivity could also lead to a much faster streamer development. The process of ionization involves the dissociation of molecules or ionic crystals into ions when the surface melts. It is to be emphasized that photo-ionization in air results only from photons of energy higher than the following ionization threshold: hν ≥ 12.08 eV for oxygen molecules and hν ≥ 15.58 eV for nitrogen molecules. Comparing the energy for the photo-ionization with the work function of NaCl and derivate atoms, it is found that the former value is about 1.5 – 3 times larger than the latter. It is obvious that the surface discharge develops closely on the ice surface; therefore, the sources of photons must be very close to the surface. This suggests that in the case of ice surface discharge development, the produced photons irradiate the ice surface which in turn emits electrons. In a previous study[3], a phenomenological sketch has been proposed giving a better idea of the streamer propagation on an ice surface (Figure 2).
Figure 2. Basic processes contributing to ionization and attachment in a streamer propagating along an ice surface: (a) positive ion capture by electrostatic forces; (b) electron capture in surface traps; (c) photoelectron extraction contributing to collisional ionization
Since the propagation velocity is a power function of the electric field, its value has been expressed in terms of the inception voltage.
b inc str aU
v = (2) where the constants a and b, depend on the material between electrodes[6].
Another possible physical mechanis m which might add to the effect of the release of electrons from the ice surface is the accumulated charge on the ice surface. The presence of excess ions on the surface will increase both the charge injected and the mean radius of the corona, attributable to increased streamer discharges activities[6]. The most important effect of excess ions on the surface is to provide ‘seed’ electrons for streamer propagation, following ion detachment in the field of advancing streamer tips. Specific investigations have been performed on the possibility of ice surface charging are presented in the section IV of this paper.
2.3. Corona Development Comparison between Ice Surface, Insulator Surface and Air
The presence of an ice or insulator surface can interact with the discharge process, making it different from the discharge observed in the presence of air gaps alone, and thus remarkably affecting the dielectric strength[e.g. 15, 16]. Along an insulating surface a streamer system propagates with a surface and air component. The velocity of the surface component is higher than that for propagation in air alone. The higher propagation velocity along an insulating surface other than air supports the argument that there is an enhancement of the ionization close to the insulator caused by photo-electron emission from the surface[15]. However, the dependence of the propagation velocity on the material suggests that this mechanism is a function of the nature of the insulating material. Then the streamer propagation process becomes considerably more complex, especially in the absence of a comprehensive physical understanding of the dielectric material surface discharges. The presence of such a surface material (insulator/ice) leads to a significant decrease in breakdown voltage. In general, the dry ice surface shows a behavior similar to PTFE. Previous studies[3-7], while emphasizing the understanding of ice surface characteristics and/or physical processes leading to discharge initiation and ice surface flashover, have revealed the major differences between discharge propagation along ice and other solid surface materials. These major differences are summarized here:
a) The conductivity of the ice surface, which can reach values as high as ten times those of freezing water conductivity[12]; this increase in surface conductivity is caused by the rejection of impurities from the solid part into the liquid portion of drops or droplets during the solidification/freezing process, and by pollution of the water and ice surface;
b) The presence of a liquid or liquid-like film at the air/ice interface at subfreezing temperatures; this film is an electrolyte solution containing, for example, a monovalent ionic species such as NaCl. Its thickness becomes arbitrarily large as the temperature rises towards the bulk melting temperature, that is, from 0.3 to 17 nm, for temperatures ranging from -28℃ to -0.02℃[11]. Because the impurities are non-volatile and insoluble in ice, s mall amounts of impurities contained within the ice will increase surface
conductivity, depending strongly on temperature, and decrease activation energy.
2.4. Simplified Model
Although considerable efforts have been made to characterize ice surface flashover, relatively little progress has been accomplished in developing a comprehensive model of ice surface streamer discharge. In a recent contribution[8], a simplified mathematical model has been proposed to simulate the dynamics of streamer discharge along an ice surface. An advancement step of the conducting channel consists of the development of an ionization zone at the head of the conducting channel and its subsequent transition into a new conducting channel section. The basic scheme of a gap with a propagating corona discharge is shown in Figure 3[8].
At each time step, the model calculates the net positive charge ∆Q associated with the discharge advancement. ∆Q is evaluated in a simpler way, using the differential capacitance concept depicted in Figure 3.
Figure 3. Simplified description of the potential distribution in the rod–plane gap at various times during the propagation of a streamer discharge by the differential capacitance concept[8].
tip tip s s
dC
Q U
C U
l
dl
∆ =
∆ =
∆
(3)The differential capacitance dC/dlS is determined by the
geometry of the gap, the discharge length lS and the
equivalent radius R of the space charge formed around the conducting channel by the ionization zone. A cylinder-over-plane configuration is a reasonable first approximation[8].
An advancement step ls of the channel corresponds to the
addition of a partial capacitance ∆C charged to the discharge tip potential Utip i.e. to the charge[8]:
( ) ( )
22
ln
1
o r s s sf
dC
C
l
l
dl
h
h
R
R
πε ε
∆ =
∆ =
∆
+
−
(4) Some of the results for a 35 mm point to plane geometry∆US Uap Utip lS 2R 2rS ∆lS ∆U = εU
are presented in Figures 4 and 5, where Tinc and TB represent
respectively the discharge inception time and time to breakdown.
Figure 4. image-converter streak photographs at an ice surface (for a d = 35 mm, rp = 6 mm, T= -12°C and σ = 80µS/cm), (a) experimental and (b)
model[8]
Figure 5. image-converter streak photographs in air (for a D = 35 mm, Rp
= 6 mm, T= -12°C), (a) experimental and (b) model
In Table 2, the computed evaluations of discharge mean velocities and the experimental measurements are compared. Table 2. Comparison of the computed mean propagation velocity with the experimental ones. rp is expressed in mm and σ in µS/cm
Vstr (kms-1) rσp = 1.5 f= 2.5 rp = 3 σf= 30 rp = 6 σf= 80 rp = 9 σf= 80 Model 1400 1666.7 1750 1458 Experiment 1658±549 1701±415 2144±684 2208±755
Comparison with experimental data indicates good agreement. The authors are currently engaged in a study to further improve this simplified mathematical model, and they expect to publish their results in a near future.
3. Ice Surface Charge Accumulation
The surface of an insulator can accumulate charge by a variety of means, including frictional electrification, deliberate charging by means of an ion beam, an electron beam or a corona source, exposure of a satellite insulator to the ambient plasma, adventitious charging due to point discharges in high-voltage systems, and surface injection from electrodes in contact with the insulator[17].The surface charge accumulation plays a significant role in HV insulation. It changes the pre-breakdown conditions, i.e. the designed Laplace field distribution, and causes field distortions midway at the insulating surface to initiate a flashover[17-20]. It can also influence the flashover dynamics by its pre-energy on a surface and may enhance the electron gain coefficient to prematurely provoke a breakdown.
Figure 6. Schematic diagram of the capacitive probe.
Under a unidirectional voltage, charge may accumulate, by a variety of means, and be retained on the dry ice surface for long periods of time due to the high resistivity of the latter. Experimental investigations on ice surface discharge using streak photography techniques suggest that both the initiation and the propagation of surface discharges could be affected by some accumulated surface charge[7]. Since little information can be found in the literature about the flashover of ice-covered insulators surface with accumulated surface charge, a comprehensive investigation has been conducted in that direction. This was motivated by some experimental
recordings using streak camera when monitoring ice surface discharge for a 14 mm point to point geometry (Figure 6). The discharge was initiated midway, far from the active electrodes.
The purpose of the present section is to investigate the possibility of surface charge accumulation on an ice surface. There are several techniques for measuring the charge distributions[17-21]. The technique used to study ice surface charging phenomena is the capacitive probe method[21] depicted in Figure 7.
The probe, cable, and insulating spacer can be represented by the simple capacitive equivalent circuit shown in Figure 8.
Figure 7. Schematic diagram of the capacitive probe
Figure 8. Equivalent circuit of the probe assembly
Where C1 represents dielectric capacitance beneath the
probe, C2 represents the gap capacitance between the probe
and spacer surface, and C3 represents the measuring circuit
input capacitance and cable capacitance, and where V1 is the
spacer surface potential and V3 the probe sensor measured
potential.
The overall capacitance C between the spacer surface and earth is given by:
2 3 1 2 3 C C C C C C = + + v (5) So that if A is the effective area of dielectric “seen” by the probe and σ is the surface charge density, then:
σ =A CV1 (6) 3 1 2 1 3 2 A V C C C C C σ = + + (7)
The measured probe potential is then:
By writing C2 = Aεo/d and C1 = Aεrεo/t, where d is the
spacing between the probe and the surface, t the thickness of the spacer, εr the relative permittivity of PTFE or ice bulk and
εo the permittivity of free spacer (i.e. 8.854 10-12 F.m-1), then
equation (8) becomes: 3 3 3 o r r C C d V A t A t ε ε ε σ = + + (8)
Numerical evaluation of the charge density σ on the PTFE or ice surface is clearly possible from the measured values of V3 once all the terms within the bracket in equation (8) are
known. Details concerning the calibration procedures can be found in[21]. The measurement principle assumes that the electric field in the space between the probe head and the spacer (PTFE or ice) surface is uniform, i.e. that d/t is small. The sensitivity and accuracy of the capacitive probe measurement depends on the spacing between the probe and the charged spacer surface. An optimum spacing of 2 mm between probe and material surface was thus considered[21]. Figures 9 and 10 provide examples of charge patterns on PTFE and ice surfaces. Surface charge deposition was achieved by applying a 25 kV standard positive lightning impulse voltage to a retractable corona needle electrode.
Figure 9. Charge distribution on an insulating surface (Teflon) after a positive impulse voltage, Up = 25 kV
Figure 10. Charge distribution on an ice surface after a positive impulse voltage, Up = 25 kV 0 1 2 3 4 5 0 2 4 6 40 50 60 70 80 90 100 X (cm) Y (cm) C har ge ( pC ) 0 1 2 3 4 5 0 2 4 6 20 30 40 50 60 X (cm) Y (cm) C har ge ( pC ) V1 C2 C3 V3 C1
The top area of the material sample exposed to charge accumulation was 45 x 45 mm2. Figure 11 provides an overview of it in the (x, y) coordinates.
Figure 11. Overview of the grided material top surface The deposited surface charge was then measured by the retractable capacitive probe (Figure 6). From these figures, it can be seen that, under similar conditions, the PTFE spacer can accumulate more charges in comparison with ice surface. The reason behind this could be due to the presence of a quasi-liquid layer on the ice surface (Figure 1), which can capture a part of the deposited charges or enable chemical reactions.
4. Conclusions
In this paper, a review of the main contributions of the CIGELE research team to the understanding of the dynamics of streamer discharges along an ice surface was presented. Interpretation of the results was facilitated by the parallel use of synthetic insulators as means of comparison with ice surfaces and air gaps.
Although considerable effort has gone into the characterization of ice surface flashover, relatively little progress has been made. Further investigations are necessary to explore the fundamental mechanisms of corona streamer inception and propagation. To close gaps in the present understanding of ice surface flashover process, studies were undertaken to measure surface charge accumulated on ice/PTFE surfaces. Under similar experimental conditions, it was found that less charge is accumulated on an ice surface than at PTFE. The reason behind this finding could be the presence of the liquid or liquid-like film on the ice surface even at temperature below the melting point. Obviously, there is plenty of scope for the continuation of those studies to gain more accurate understanding of the discharge on ice surface.
ACKNOWLEDGEMENTS
This research was carried out within the framework of the NSERC/Hydro-Quebec Industrial Chair on Atmospheric Icing of Power Network Equipment (CIGELE) and the Canada Research Chair on Atmospheric Icing Engineering of Power Network (INGIVRE) at the Université du Québec à
Chicoutimi. The authors would like to thank Professor K. D. Srivastava for useful discussions and all the sponsors of the project for their financial support. Our thanks are extended to M. H. Hemmatjou and I. Ndiaye for their participation in the experiments.
REFERENCES
[1] CIGRE Task Force 33.04.09, "Influence of ice and snow on the flashover performance of outdoor insulators, part I: Effects of Ice", Electra, No. 187, pp. 91-111, Dec. 1999. [2] M. Farzaneh, "Ice accretion on high voltage conductors and
insulators and related phenomena", Phil. Trans. of the Royal Soc. vol. 358, No. 1776, pp. 2971-3005, 2000.
[3] M. Farzaneh, I. Fofana, I. Ndiaye and K. D. Srivastava, "Experimental investigations of Ice Surface discharge into the Inception and development", Inter. Journal of Power and Energy Systems (at press).
[4] I. Ndiaye, “Étude de l’apparition et de la propagation de décharges couronnes à la surface de la glace”, Mémoire présenté à l’Université du Québec à Chicoutimi comme exigence partielle à l’obtention de la Maîtrise en ingénierie, Mars 2003.
[5] M. Farzaneh and I. Fofana, "Study of Insulator Flashovers caused by Atmospheric Ice Accumulation", Journal of Iranian Association of Electrical and Electronics Engineers, Iran, Vol. 1, no. 1, printemps, pp. 10-23, 2004.
[6] M. Farzaneh and I. Fofana, “Experimental Study and Analysis of Corona Discharge Parameters on an Ice Surface", J. Phys. D: Appl. Phys. Vol. 37, pp. 721–729, 2004.
[7] S. Brettschneider, Contribution à l’étude de l’apparition et du développement des décharges visibles à la surface de la glace. Thèse présentée à l’Université du Québec à Chicoutimi comme exigence partielle du doctorat en ingénierie, Octobre 2000.
[8] I. Fofana and M. Farzaneh, "A Simplified Model of Corona Discharge Development on an Ice Surface", in Proc. 2004 Annual Report, IEEE Conference on Electrical Insulation and Dielectric Phenomena, Boulder, Colorado, USA, pp. 667-670, October 17-20th 2004.
[9] P. V. Hobbs, Ice Physics (Clarendon Press, Oxford, 1974). [10] J. S. Wettlaufer, "Ice surfaces: macroscopic effects of
microscopic structure", Phil. Trans. R. Soc. Lond. A 357, 3403–3425, 1999.
[11] Vlad Sadtchenko and George E. Ewing, "A new approach to the study of interfacial melting of ice: infrared spectroscopy", Can. J. Phys. Vol. 81: pp. 333–341, 2003.
[12] M. Farzaneh and O. T. Melo, "Properties and effect of freezing rain and winter fog on outline insulators", Cold Regions Science and Technology, Vol. 19, pp 33-46, 1990. [13] R. D. Lide and H. P. R. Frederikse, Handbook of Chemistry
and Physics, 77th Ed. (CRC Press, 1996).
Sources Sci. Technol., 9, 517-527, 2000.
[15] I. Gallimbertti, I. Marchesi and L. Niemeyer, "Streamer corona at an insulating surface", in Proc. 7th Int. Symp. on High Voltage Engineering, Dresden (Germany), paper 41.10, August 1991.
[16] T. S. Sudarsham and R. Dougal, "Mechanisms of surface flashover along solid dielectrics in compressed gases, a review", IEEE Trans. on Elec. Insul., 21, pp. 727-746, 1986. [17] H. J. Wintle, "Interpretation of Atomic force microscope
(AFM) signals from surface charge on insulators”, Meas. Sci. Technol., Vol. 8, pp. 508-513, 1997.
[18] D. C. Faircloth and N. L. Allen, "High resolution measurements of surface charge densities on insulator
surfaces, IEEE Trans. on Diel and Elec. Insul., Vol. 10, No. 2, pp. 285-290, 2003.
[19] M. Yashima and T. Kawamoto, "Principle of surface charge measurement for thick insulating specimens", IEEE Trans. on Diel and Elec. Insul., Vol. 5, No. 4, pp. 497-504, 1998. [20] T. Jing, "Surface charge accumulation: an inevitable
phenomenon in dc GIS", IEEE Trans. on Diel and Elec. Insul., Vol. 2 (5), pp. 771-8, 1995.
[21] J. Zhou, A study of charge accumulation and spacer flashover in compressed gas insulation, PhD Dissertation, University of British Columbia, June 1991.
![Figure 1. Quasi-liquid layer thickness as a function of ice surface temperature, reproduced from[11]](https://thumb-eu.123doks.com/thumbv2/123doknet/7691437.243895/3.893.105.438.520.780/figure-quasi-liquid-thickness-function-surface-temperature-reproduced.webp)
![Figure 3. Simplified description of the potential distribution in the rod–plane gap at various times during the propagation of a streamer discharge by the differential capacitance concept[8]](https://thumb-eu.123doks.com/thumbv2/123doknet/7691437.243895/4.893.467.830.489.747/simplified-description-potential-distribution-propagation-discharge-differential-capacitance.webp)


