ÉCOLE DE TECHNOLOGIE SUPÉRIEURE UNIVERSITÉ DU QUÉBEC
MANUSCRIPT-BASED THESIS PRESENTED TO ÉCOLE DE TECHNOLOGIE SUPÉRIEURE
AND
NATIONAL UNIVERSITY OF SCIENCE AND TECHNOLOGY “MISIS” (CO-TUTORSHIP)
IN PARTIAL FULFILLMENT OF THE REQUIREMENTS FOR THE DEGREE OF DOCTOR OF PHILOSOPHY
Ph. D.
CO-TUTORSHIP RUSSIA-QUÉBEC
BY
Alena KREITCBERG
IMPROVEMENT OF THE FUNCTIONAL PROPERTIES OF NANOSTRUCTURED Ti-Ni SHAPE MEMORY ALLOYS BY MEANS OF
THERMOMECHANICAL PROCESSING
MONTREAL, 4 DECEMBER 2014
This Creative Commons licence allows readers to dowload this work and share it with others as long as the author is credited. The content of this work may not be modified in any way or used commercially.
BOARD OF EXAMINERS (THESIS PH.D.) THIS THESIS HAS BEEN EVALUATED BY THE FOLLOWING BOARD OF EXAMINERS
Mr. Vladimir Brailovski, Thesis Supervisor
Département de génie mécanique at École de Technologie Supérieure
Mr. Sergey D. Prokoshkin, Thesis Co-supervisor
Department of Plastic Deformation of Special Alloys at National University of Science and Technology “MISiS” (Moscow, Russia)
Mr. Omar Chaallal, Chair, Board of Examiners
Département de génie de la construction at École de technologie supérieure
Mr. Victor Songmené, Member of the jury
Département de génie mécanique at École de technologie supérieure
Mr. Mohammad Jahazi, Member of the jury
Département de génie mécanique at École de technologie supérieure
Mr. Sylvain Turenne, External Evaluator
Département de génie mécanique at École Polytechnique de Montréal
THIS THESIS WAS PRENSENTED AND DEFENDED
IN THE PRESENCE OF A BOARD OF EXAMINERS AND THE PUBLIC 27 NOVEMBER 2014
ACKNOWLEDGMENTS
First and foremost, I would like to express my sincere gratitude to my research supervisors, Vladimir Brailovski and Sergey Prokoshkin, for their assistance, guidance, continuous support, understanding, attention to detail and involvement in every step throughout the process. Over these past years, I have enjoyed working with you.
I would also like to show my gratitude to Drs. Karine Inaekyan, Elena Ryklina, Irina Khmelevskay and Andrey Korotitskiy for their helpful discussions during the various stages of this study.
To the entire team at École de technologie supérieure: Charles Simoneau, Yann Facchinello, Jonathan Rivard, Simon Lacasse, Pierre-Luc Vachon, Jean-René Poulin and Victor Urlea, thank you for the friendship, as well as personal and professional support during this time. It was a pleasure working together.
I am grateful to my colleagues at the National University of Science and Technology “MISIS”: Kristina Vachiyan, Vadim Sheremetiev, Yulia Zhukova, Sergey Dubinskiy and Victor Komorov, who were always open for discussions and made my time in the Ph.D. program more fun and interesting.
Most importantly, none of this could have happened without my family. My sincere thanks to my parents for their understanding, endless love and for supporting me spiritually throughout my life.
And finally, a big thanks you to my love, Charles, who was worried about me during all this time. Your love, support and good humor made that period of my life more enjoyable.
AMÉLIORATION DES PROPRIÉTÉS FONCTIONNELLES DES ALLIAGES À MÉMOIRE DE FORME Ti-Ni NANOSTRUCTURÉS À L’AIDE DE TRAITEMENTS
THERMOMÉCANIQUES Alena KREITCBERG
RÉSUMÉ
Les méthodes de déformation plastique sévère sont fréquemment employées pour la mise en forme d’alliages à mémoire de forme (AMF) Ti-Ni nanostructurés. Toutefois, ce type de traitement thermomécanique augmente les risques d’endommagement du matériau et a donc pour effet de détériorer leur résistance en fatigue. Conséquemment, l’objectif principal de ce projet est d’étudier l’influence des conditions des traitements thermomécaniques (TMT) sur la microstructure, les propriétés fonctionnelles et l’endommagement des AMF Ti-Ni durant ces traitements. En d’autres mots, il est attendu que l’optimisation des conditions des TMT de ces alliages peut améliorer leurs propriétés en fatigue.
Les premiers travaux de cette thèse ont porté sur l’étude de la microstructure et des propriétés en fatigue des AMF Ti-Ni assujettis aux différentes combinaisons de TMT : laminage à froid sévère (CR), laminage à tiède (WR), recuit intermédiaire (IA) et recuit post-déformation (PDA). Les résultats obtenus ont permis de démontrer que tout comme la diminution de l’intensité du CR, l’introduction du WR et du IA au sein des différents TMT a pour effet d’augmenter la durée de vie en fatigue de l’alliage, conséquence d’un endommagement moins important. Une accentuation de la densité d’une texture favorable à la réalisation de l’effet de mémoire de forme (austénite-B2) a également été notée. Néanmoins, les modifications apportées aux TMT (température plus élevée et moins grande intensité de laminage) ont eu pour effet de grossir la microstructure, ayant comme conséquence directe d’affecter négativement la stabilité des propriétés fonctionnelles durant le cyclage thermomécanique. De plus, au terme de ces travaux, il n’était pas possible de séparer l’influence des différentes caractéristiques liées aux TMT sur les propriétés fonctionnelles des alliages Ti-Ni : la taille des grains et sous-grains, la texture et le niveau des défauts induits par le TMT.
Dans le but d’isoler la contribution de la taille des grains et sous-grains de la contribution liée à la texture sur les propriétés fonctionnelles des AMF Ti-Ni, la limite théorique cristallographique de déformation récupérable obtenue après différents TMT (menant aux différentes textures) a été calculée et comparée avec les résultats expérimentaux. Cette analyse comparative a permis de démontrer que les facteurs structuraux (la taille des grains et sous-grains) ont prévalence sur la texture. Par conséquent, afin de maximiser les propriétés fonctionnelles des Ti-Ni, il est nécessaire d’avoir une structure exclusivement nanocristalline et donc d’employer les techniques de déformation plastique sévère (SPD) à froid. Enfin, étant donné que la déformation plastique sévère à froid augmente le risque d’apparition des défauts lors de la mise en forme, il a été jugé nécessaire de comparer la tolérance aux dommages des alliages Ti-Ni avec une taille de grain/sous-grains différente, allant de quelques dizaines jusqu’à quelques centaines de nanomètres.
À cet effet, une analyse détaillée de l’interaction entre la durée de vie en fatigue des alliages Ti-Ni et leur niveau d’endommagement lors du laminage à froid sévère et/ou à tiède (caractérisé par la taille et la densité des microfissures en bordure des échantillons) a été réalisée. Cette étude a démontré que l’alliage avec une taille nanométrique de grains (structure nanocristalline) offre une meilleure tolérance à la propagation des petites fissures comparativement à son équivalent avec une taille nanométrique de sous-grains, ce qui devrait lui offrir une meilleure performance en fatigue. Aussi, afin de pouvoir obtenir les structures nanocristallines tout en diminuant la quantité de défauts de fabrication, il a été jugé essentiel d’étudier la déformabilité de ces alliages à différentes températures.
Afin d’approfondir les connaissances de la déformabilité des AMF Ti-Ni, une étude de sensibilité du taux de déformation a été conduite. Différentes microstructures possédant des grains allant de grossiers à ultrafins ont préalablement été créées à l’aide de la technologie d’extrusion dans les canaux déviés (ECAP). Ces dernières ont ensuite été assujetties à une analyse de sensibilité du taux de déformation. Ces travaux ont prouvé que peu importe la température de déformation, une microstructure à grains ultrafins comparée à une autre à grains grossiers démontre une meilleure déformabilité. Par ailleurs, il a été aussi établi que plus petite est la taille des grains, plus basse est la température et plus élevé est le taux de déformation qui mènent à la superplasticité. En se basant sur ces résultats, une séquence technologique incluant l’ECAP à température élevée, permettant d’affiner la microstructure et donc d’améliorer la déformabilité de l’alliage, suivi par laminage à froid sévère, permettant d’obtenir une structure nanocristalline, a été proposée et validée.
Contributions scientifiques
Ce projet a contribué à l’avancement des connaissances dans le domaine des alliages à mémoire de forme (AMF) Ti-Ni principalement au niveau de l’interaction entre les traitements thermomécaniques, la structure et les propriétés fonctionnelles de ces alliages. Les conclusions principales de ce projet doctoral peuvent être résumées comme suit :
• L’amplitude et la stabilité des propriétés fonctionnelles d’alliages Ti-Ni avec une taille nanométrique de grains (nanocristallins) sont supérieures à celles d’alliages avec une taille nanométrique de sous-grains. Le principal facteur affectant la durée de vie en fatigue d’alliages nanocristallins est leur endommagement lors de la mise en forme.
• Lorsque comparée à la texture, la structure d’alliages Ti-Ni joue un rôle plus significatif dans la réalisation de leur potentiel de fonctionnement.
• En termes de résistance en fatigue, la structure nanocristalline est moins sensible à la propagation des petites fissures par rapport à celle avec sous-grains de taille nanométrique.
• Le raffinement de la taille de grains permet d’améliorer la déformabilité des AMF Ti-Ni et ce, peu importe la température de déformation.
• Dans le but de minimiser le risque d’apparition des défauts lors de la mise en forme des AMF Ti-Ni nanostructurés, une nouvelle séquence de traitement thermomécanique à trois étapes est proposée (ECAP+CR+PDA): 1) raffinement des grains par déformation plastique sévère à haute température (ECAP), 2) création d'une structure amorphe par déformation plastique sévère à basse température (CR) et 3) obtention d’une structure nanocristalline par recuit post-déformation (PDA).
Mots-clés : alliage à mémoire de forme, laminage, extrusion dans les canaux déviés, structure nanocristalline, superplasticité.
IMPROVEMENT OF THE FUNCTIONAL PROPERTIES OF NANOSTRUCTURED Ti-Ni SHAPE MEMORY ALLOYS BY MEANS OF THERMOMECHANICAL
PROCESSING Alena KREITCBERG
ABSTRACT
Severe plastic deformation (SPD) is commonly used for nanostructure formation in Ti-Ni shape memory alloys (SMAs), but it increases the risk of damage during processing and, consequently, negatively affects functional fatigue resistance of these materials. The principal objective of this project is, therefore, to study the interrelations between the processing conditions, damageability during processing, microstructure and the functional properties of Ti-Ni SMAs with the aim of improving long-term functional performances of these materials by optimizing their processing conditions.
First, microstructure and fatigue properties of Ti-Ni SMAs were studied after thermomechanical treatment (TMT) with different combinations of severe cold and warm rolling (CR and WR), as well as intermediate and post-deformation annealing (IA and PDA) technological steps. It was shown that either when WR and IA were introduced into the TMT schedule, or CR intensity was decreased, the fatigue life was improved as a consequence of less processing-induced damage and higher density of the favorable B2-austenite texture. This improvement was reached, however, at a price of a lower multi-cycle functional stability of these materials, the latter being a direct consequence of the microstructure coarsening after higher-temperature lower-intensity processing. At the end of this study, however, it was not possible to distinguish between contributions to the functional performances of Ti-Ni SMAs from different processing-related features: a) grain/subgrain size; b) texture; and c) level of rolling-induced defects.
To be capable of separating contributions to the functional properties of Ti-Ni alloys from grain/subgrain size and from texture, the theoretical crystallographic resource of recovery strain after different TMTs and, therefore, different textures, were calculated and compared with the experiment. The comparative analysis showed that the structural factors (grain/subgrain size) strongly dominate the texture contributions, and therefore, there is no real alternative to having nanocrystalline Ti-Ni alloys, if one needs to maximize the Ti-Ni alloys functional properties. Since the creation of such a microstructure requires the use of severe cold deformation techniques and neither of these techniques can be completely exempt from defects, it was deemed necessary to compare the damage tolerance of nanocrystalline Ti-Ni alloys to that of their nanosubgrained and mixed nanocrystalline/nanosubgrained counterparts.
With this objective in mind, a detailed analysis of interrelations between the level of the CR/WR-induced damage (edge microcrack size and concentration) and the fatigue life of Ti-Ni SMAs was carried out. It was shown that nanocrystalline structure provides higher tolerance to small-crack propagation than nanosubgrained or mixed nanocrystalline/
nanosubgrained structures, and that low-temperature deformability of these alloys has to be improved to benefit from the property-enhancement potential of nanocrystalline structure. To broaden our knowledge in the field of Ti-Ni alloy deformability, the strain-rate sensitivity of these alloys was studied. Different microstructures, varying from the coarse- to ultrafine-grained, were created by means of equal-channel angular pressing (ECAP) and subjected to strain-rate sensitivity testing. As a result, the material with ultrafine-grained microstructure demonstrated an improved deformability as compared to the coarse-grained structure, at any deformation temperature. Moreover, it was determined that the smaller the grain size, the lower the temperature and the higher the strain-rate at which superplasticity occurs. Based on the results obtained, combined thermomechanical processing (ECAP at elevated temperatures followed by CR) was proposed and validated in terms of structural refinement with reduced level of processing-induced defects.
Scientific contributions
This thesis contributes to the advancement of knowledge in the field of Ti-Ni SMAs’ processing-structure-properties interactions, and the main conclusions of this study can be summed-up as follows:
• Nanocrystalline Ti-Ni alloys significantly outperform nanosubgrain Ti-Ni alloys in terms of the absolute values and stability of their single- and multiple-cycle functional properties (superelasticity and shape memory characteristics). The main factor limiting the number of cycles to failure of the nanocrystalline alloys is the processing-related damage.
• The structure of Ti-Ni alloys plays significantly higher role in the realization of their functional potential that does their texture.
• In terms of fatigue life, the nanocrystalline structure has lower small-crack sensitivity than does the nanosubgrained structure.
• Grain refinement makes it possible to improve deformability of Ti-Ni alloys at any temperature.
• To produce nanocrystalline Ti-Ni SMAs free of processing-induced-defects, a novel three-step processing is proposed (ECAP+CR+PDA): grain-refining severe plastic deformation at elevated temperatures (ECAP), followed-up by amorphizing SPD at low temperatures (CR), and ended-up by nanocrystallizing post-deformation heat treatment (PDA).
Keywords: shape memory alloys, rolling, equal-channel angular pressing, nanocrystalline structure, superplasticity.
TABLE OF CONTENTS
Page
INTRODUCTION ...1
CHAPTER 1 LITERATURE REVIEW ...5
1.1 TMT of Ti-Ni SMA by rolling ...6
1.1.1 Cold rolling ... 6
1.1.2 Warm rolling ... 8
1.1.3 Structural analysis of Ti-Ni alloy ... 8
1.1.4 Thermomechanical characterization of nanostructured Ti-Ni alloy ... 10
1.1.5 Effect of TMT by rolling on the texture and properties of Ti-Ni SMAs .. 12
1.2 TMT of Ti-Ni SMA by ECAP ...18
1.2.1 Formation of the ultrafine-grained structure ... 21
1.2.2 Formation of nanostructures ... 23
1.3 Functional properties of Ti-Ni alloys after ECAP and CR processes ...24
1.4 Research objectives ...25
1.5 Methodology ...27
1.5.1 Materials and thermomechanical treatments ... 27
1.5.2 Mechanical and microstructural characterization ... 31
CHAPTER 2 ARTICLE #1: MICROSTRUCTURE AND FUNCTIONAL FATIGUE OF NANOSTRUCTURED Ti-50.26 at.%Ni ALLOY AFTER THERMOMECHANICAL TREATMENT WITH WARM ROLLING AND INTERMEDIATE ANNEALING ...35
2.1 Summary ...35 2.2 Abstract ...36 2.3 Introduction ...36 2.4 Methodology ...38 2.5 Experimental results...43 2.6 Discussion ...56 2.7 Conclusions ...59 2.8 Acknowledgments...60 2.9 References ...60
CHAPTER 3 ARTICLE #2 ROLE OF THE STRUCTURE AND TEXTURE IN THE REALIZATION OF THE RECOVERY STRAIN RESOURCE OF THE NANOSTRUCTURED Ti-50.26 at.%Ni ALLOY ...65
3.1 Summary ...65 3.2 Abstract ...66 3.3 Introduction ...66 3.4 Experimental ...70 3.5 Results ...79 3.6 Discussion ...102
3.7 Conclusions ...104
3.8 Acknowledgments...108
3.9 References ...108
CHAPTER 4 ARTICLE #3 INFLUENCE OF THERMOMECHANICAL TREATMENT ON STRUCTURE AND CRACK PROPAGATION IN NANOSTRUCTURED Ti-50.26 at.%Ni ALLOY ...113
4.1 Summary ...113 4.2 Abstract ...114 4.3 Introduction ...114 4.4 Experimental ...116 4.5 Experimental results...122 4.6 Discussion ...130 4.7 Conclusions ...134 4.8 Acknowledgments...135 4.9 References ...136
CHAPTER 5 ARTICLE #4 EFFECT OF THE GRAIN/SUBGRAIN SIZE ON THE STRAIN-RATE SENSITIVITY AND DEFORMABILITY OF Ti-50 at.%Ni ALLOY ...141
5.1 Summary ...141 5.2 Abstract ...142 5.3 Introduction ...143 5.4 Experimental methodology ...145 5.5 Results ...148 5.6 Discussion ...161 5.7 Conclusions ...163 5.8 Acknowledgments...163 5.9 References ...164 CONCLUSION ...169 RECOMENDATIONS ...171
APPENDIX I EFFECT OF INITIAL RECOVERY STRESS ON THE FATIGUE LIFE OF Ti-50.26 at.%Ni ALLOY ...173
LIST OF TABLES
Page Table 1.1 ECAP conditions and the proposed deformation mechanisms that
occurred during processing of Ti-49.8 at.%Ni alloy [4] ... 21
Table 1.2 Structure and functional properties of Ti-Ni alloys after various treatment [4, 43, 46] ... 25
Table 1.3 Samples designation and corresponding TMT routes ... 27
Table1.4 Specimens designation and corresponding processing routes ... 31
Table 2.1 Samples designation and corresponding TMT routes ... 40
Table 2.2 Crack parameters after different TMT routes ... 50
Table 2.3 Results of the stress-free recovery testing: recovery strain in 1st cycle (Δε1), recovery strain degradation rate for the first 500 cycles ( 500 r ε Δ ) and number of cycles to failure (Nf) ... 51
Table 2.4 Results of the constrained recovery testing: recovery stress generated in 1st cycle (Δσ1) recovery stress degradation rate for the first 500 cycles ( 500 tr σ Δ ), and the number of cycles to failure (Nf) ... 52
Table 2.5 Results of superelastic testing: transformation yield stress in 1st cycle ( 1 tr σ Δ ); transformation stress evolution rate and irrecoverable strain accumulated during the first 1000 cycles ( 1000 tr σ Δ and ε ), and 1000 number of cycles to failure (Nf) ... 53
Table 3.1 Designations and schemes of treatments ... 71
Table 3.2 Martensite lattice parameters and the maximum lattice strain upon the martensitic transformation of the Ti-50.26 at.%Ni alloy (measurements at room temperature) ... 86
Table 3.3 Relative pole density <100>, (110> and <111> and the corresponding crystallographic resource of the recovery strain of the Ti-50.26 at.%Ni alloy after different regimes (calculated according to [20]) ... 91
Table 3.4 Resource of the recovery strain of the polycrystalline Ti-50.26 at.%Ni alloy calculated by different methods ... 92
Table 3.5 Characteristics of the recovery strain of the Ti-50.26 at.%Ni SMA depending on the regimes of TMT and total induced strain εt (%) ... 96
Table 3.6 Parameters of the loading-unloading diagram of the Ti–50.26 at.%Ni SMA after TMT according to different regimes ... 101 Table 5.1 Specimen designation and corresponding processing routes ... 145 Table 5.2 Strain-rate sensitivity exponent m measured by the strain-rate-jump
compression test ... 155 Table 5.3 Yield stresses of B2-austenite at 400 and 500°С (0.2% offset). ... 157 Table 5.4 Strain-rate sensitivity exponent m measured by stress-jump creep
LIST OF FIGURES
Page Figure 1.1 Grain size of Ti-Ni SMA as a function of the strain rate and
temperature (adapted from [5]) ... 7 Figure 1.2 TEM images of Ti-50.26 at.%Ni alloy after different TMT routes:
a) route CR(e=1.2), b) route CR(e=0.3)+WR(e=0.9); c) CR(e=1)+IA+CR(e=0.2); and d) WR(e=1)+IA+WR(e=0.2). From left to right: bright-field image, dark-field image, microdiffraction pattern [9] ... 9 Figure 1.3 Stress-strain plots: a) stress-free recovery testing and b) constrained
recovery testing; both for N=1 (Ti-50.26 at.%Ni alloy after CR(e=1.2)+PDA 400°C, 1h) [3] ... 11 Figure 1.4 Influence of the TMT on the texture components and recoverable
strains (adapted from [19]) ... 18 Figure 1.5 Schematic representation of the ECAP processing: (a) 90°-angle
ECAP; (b) schematic representation of the angle determination [26, 27] ... 19 Figure 1.6 (a) Cross-section of billet [45] and (b) TEM image of Ti-49.8 at.%Ni
alloy after ECAP at room temperature and PDA at 400°C [4] ... 23 Figure 1.7 Typical tensile stress-strain plot to failure ... 24 Figure 1.8 Four-high FENN laboratory rolling mill ... 28 Figure 1.9 Schematic view of the: a) rolling mill and pulling tension system;
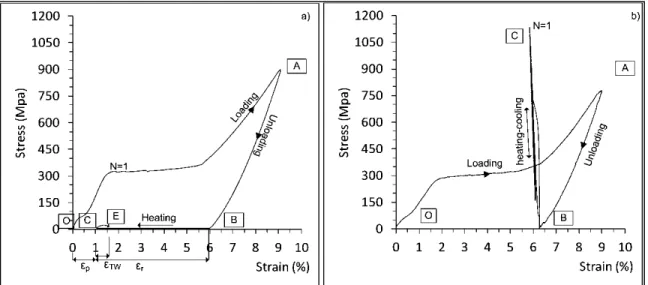
b) electric heating system [9] ... 29 Figure 1.10 Representation of the infrared sensor-wire alignment device [8] ... 30 Figure 2.1 Stress-strain plots (Ti-50.26 at%Ni alloy after e=1.2CR+PDA 400°C,
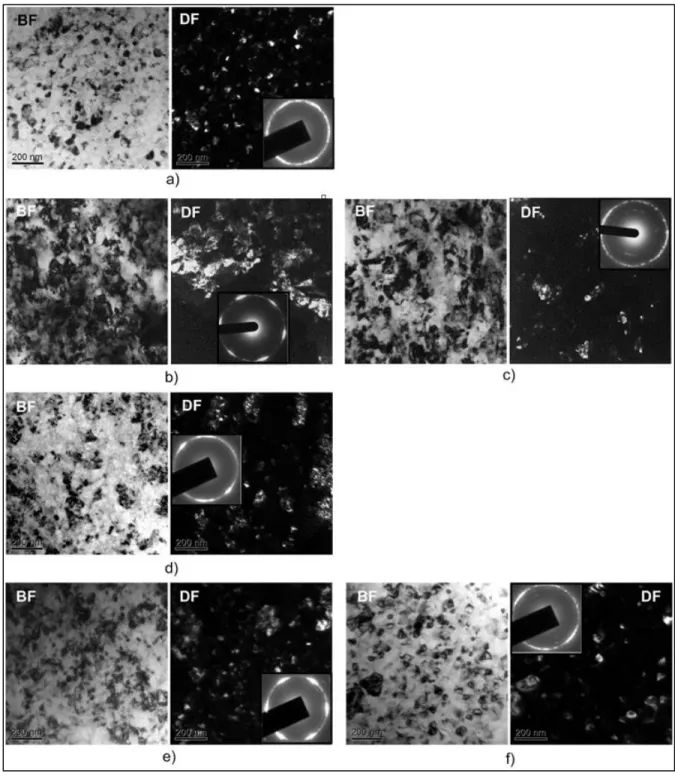
1h): (a) stress-free recovery testing and (b) constrained recovery testing; both for N=1 cycle; and (c) superelastic testing ... 42 Figure 2.2 Structure of Ti-50.26%Ni alloy after selected TMT routes: a)
CR(1.2); b,c) CR(0.75); d) WR(1)+IA+WR(0.2); and e,f) CR(1)+IA+WR(0.2). Left to right: bright-field image, dark-field image, electron diffraction pattern ... 46 Figure 2.3 ODF section at φ2=0 and 90° for six processing routes ... 47
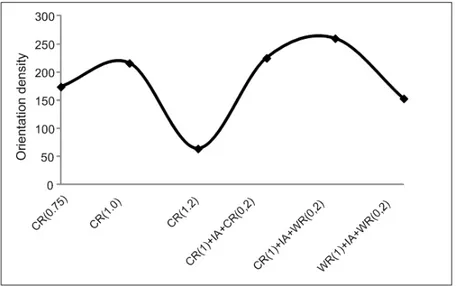
Figure 2.4 Inverse pole figures corresponding to the normal direction (ND) and rolling direction (RD) for all the processing routes. х – [uvw] pole, о – [011]B2 pole ... 48 Figure 2.5 Orientation density of {100}<110>B2 texture component as a result
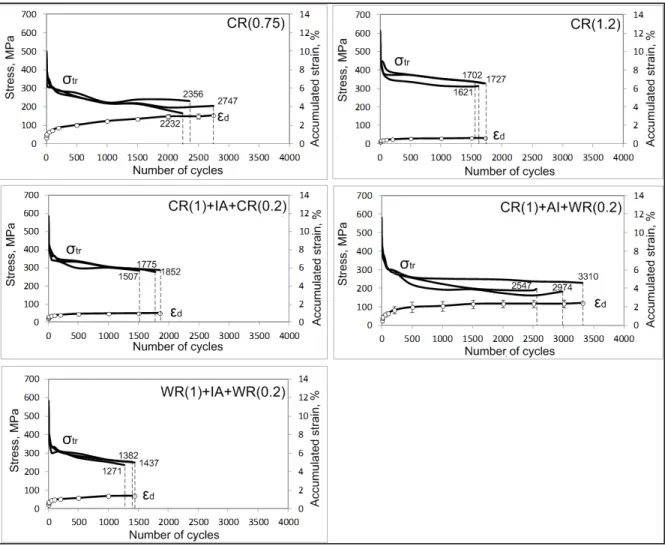
of different TMT routes applied to Ti-50.26at.%Ni alloy ... 49 Figure 2.6 Loading-unloading diagrams during superelastic testing after
different TMT routes ... 54 Figure 2.7 Evolution of transformation yield stress and accumulated strain (for
the longest test for each TMT route) during superelastic testing ... 55 Figure 2.8 (a) Processing-induced damage (crack size, plain bars, and
concentration, hatched bars) after different processing routes, and fatigue functional properties obtained by (b) stress-free recovery, (c) constraint recovery stress generation, and (d) superelastic testing (number of cycles to failure, plain bars and stability, hatched bars) ... 58 Figure 3.1 Crystallographic relationships corresponding to the changes in the
systems of translations upon the transformation of the tetragonal cell of the B2-austenite into an orthorhombic cell with a monoclinic distortion of the B19’-martensite ... 73 Figure 3.2 Scheme of the determination of the maximum deformation of the
martensite transformation in polycrystalline austenite. Subscripts 1 and 2 correspond to two different grains of the polycrystal and to two (of equivalent length) sequential segments in the direction
<uvw>εmax of a single crystal ... 75
Figure 3.3 Inverse pole figure of the B2-austenite of the Ti-50.26 at.%Ni alloy after thermomechanical treatment according to the regime WR(1)+IA+WR(0.2) (see Table 3.1) ... 76 Figure 3.4 (a) Scheme of the determination of the parameters of the
loading-unloading diagram of a sample of the Ti-50.26 at.%Ni alloy and (b) of the maximum recovery strain
ε
rmax and the maximum completely recoverable strainε
rmax,1 ... 78Figure 3.5 Structures of Ti-50.26 at.%Ni alloy after TMT under different conditions: (a, b) CR(0.75); (c) CR(1.2); (d) CR(1)+IA+CR(0.2); (e, f) CR(1)+IA+WR(0.2); (g) WR(1)+IA+WR(0.2). Left-hand panel: bright-field images; right-hand panel: dark-field images with the diffraction patterns in the insets ... 82
Figure 3.6 Widths of the XRD lined {110} and {211} of the austenite of the
Ti-50.26 at.%Ni alloy as function of the regime of TMT ... 85
Figure 3.7 φ2 = 0° and φ2 = 90° sections of the ODF for different regimes of thermomecanical treatments ... 87
Figure 3.8 Inverse pole figures corresponding to the direction of the normal to the rolling plane (ND) and to the rolling direction (RD) for different regimes of TMT. О - the position of the pole [011]В2; х - the position of the maximum of the ODF ... 88
Figure 3.9 Orientation density of the textural component {100}<110>B2 and the calculated (by different methods) resources of the recovery strain of the Ti-50.26 at % Ni alloy after TMT under different conditions ... 89
Figure 3.10 Characteristic loading-unloading diagrams of the Ti-50.26 at.%Ni alloy after different regimes of TMT ... 94
Figure 3.11 Variations in the induced (εi), recovery (εr) and residual (εf) strains of the Ti-50.26 at.%Ni SMA with an increase in the total induced strain (εt) after TMTs. The regimes of the TMT are indicated in the appropriate figures ... 97
Figure 3.12 Comparison of the experimental values of the recovery strain (Table 3.5), its theoretical resource (calculated by different methods, Table 3.4), and recovery stress (borrowed from [24]) after TMT under different conditions ... 99
Figure 4.1 Schematic representation of the three processing routes ... 118
Figure 4.2 Example of sample width reduction ... 119
Figure 4.3 Example of crack measurement after CR(1.2)+PDA ... 120
Figure 4.4 Stress-strain plots for the N=1 and Nth cycles of Ti-50.26%Ni samples: a) superelastic testing after CR(1.2)+PDA (400°C, 1h), and b) stress generation-relaxation testing after CR(1.0)+IA+WR(0.2)+PDA (400°C, 1h)... 121
Figure 4.5 Structure of Ti-50.26%Ni alloy after selected TMT routes: a, b) CR(0.75); c) CR(1.2); and d, e) CR(1)+IA+WR(0.2). Left to right: bright-field image, dark-field image, electron diffraction pattern ... 124 Figure 4.6 Texture of Ti-50.26 at.%Ni after CR(1.2), CR(0.75), and
normal direction (ND) and rolling direction (RD): x - [uvw] pole, o - [011]B2 pole ... 125 Figure 4.7 Variation of crack length and concentration after mechanical
polishing of Ti-50.26 at.%Ni samples processed by different TMTs: CR(0.75), CR(1.2) and CR(1)+IA+WR(0.2) ... 126 Figure 4.8 Distribution of crack length of Ti-50.26 at.%Ni alloy after CR(0.75),
CR(1.2) and CR(1)+IA+WR(0.2): a) as-processed; b) after polishing to a 1.0 mm width ... 127 Figure 4.9 Fatigue life of Ti-50.26 at.%Ni samples as a function of the sample
width (mechanical polishing): (a) superelastic testing; b) constrained recovery testing ... 128 Figure 4.10 Evolution of crack length of the Ti-50.26 at.%Ni 1mm-width
CR(0.75), CR(1.2) and CR(1)+IA+WR(0.2) - processed samples: a) before superelastic cycling; b) after 500 cycles of superelastic cycling ... 130 Figure 4.11 Schematic representation of a mixed nanocrystalline (NC) +
nanosubgrained (NS) structure ... 131 Figure 4.12 Number of superelastic cycles to failure as a function of the average
crack length (to facilitate the observation, this figure is obtained from Figure 4.9a using only the average values of crack length and the numbers of cycles to failure). ... 133 Figure 5.1 Plane-strain compression testing specimen at various preparation
stages: a) ECAP-processed billet; (b) specimen before testing and (c) specimen after testing ... 146 Figure 5.2 Alloy structure after TMT: a) RQ (optical microscopy); b)
ECAP-400, c) ECAP-500 and d) ECAP-400 after creep test at 400°C (electron microscopy). In b, c and d: bright-field images are on the left, dark-field images on the right; SAED patterns are inserted into the dark-field images ... 150 Figure 5.3 DSC plots after reference quenching and different TMT routes ... 151 Figure 5.4 X-ray diffractions at RT (a) and 150°C (b) after RQ, ECAP-400 and
ECAP-500 ... 153 Figure 5.5 Strain-rate-jump tensile diagrams at 20, 150, 250 and 400°C in the
[10-3 – 10-4] s-1 strain rate range: RQ (a) – (d) and ECAP-400 (e) – (h) ... 154
Figure 5.6 Strain-rate-jump compression diagrams: RQ (a, d); ECAP-500 (b, e); ECAP-400 (c) ... 155 Figure 5.7 Stress-jump creep test diagrams: RQ (a, d), ECAP-500 (b, e), and
ECAP-400 (c) ... 157 Figure 5.8 The log(σ) vs log( ) plots after RQ (a, d), ECAP-500 (b, e), and
ECAP-400 (c) ... 158 Figure 5.9 Microcracking after additional cold rolling. (a) Average length and
concentration of microcracks for RQ and ECAP-400-processed specimens subjected to final CR(ε=2); microcrack views: (b) after RQ+CR(ε=2) and (c) after ECAP+CR(ε=2) ... 160 Figure 5.10 Strain-rate sensitivity exponent m as a function of strain rate and
LIST OF ABREVIATIONS SMA Shape Memory Alloy
at.% Atomic percent
B2 CsCl lattice
B19’ Monoclinic lattice
R Rrhombohedral lattice
A Austenite M Martensite
bcc Body-centered cubic lattice
Ms Start temperature of the direct martensitic transformation
Mf Finish temperature of the direct martensitic transformation
As Start temperature of the reverse martensitic transformation
Af Finish temperature of reverse martensitic transformation
Tm Melting temperature
SE Superelastic effect
SME Shape memory effect
TWSM Two-way shape memory effect ND Normal to the rolling plane
RD Rolling direction
TD Transverse direction
PF Pole figure
IPF Inverse pole figure
SST Standart stereographic triangle
TMT Thermomechanical treatment
PDA Post-deformation annealing
IA Intermediate annealing
RT Room temperature
SPD Severe plastic deformation
CR Cold rolling
WR Warm rolling
HR Hot rolling
CGS(CG) Coarse-grained structure
UFG Ultrafine-grained structure
NSS(NS) Nanosybgrained structure NCS(NC) Nanocrystalline structure
DSC Diffraction Scanning Calorimetry SEM Scanning Electron Microscope
TEM Transmission electron microscopy
BF Bright field image
DF Dark field image
ECAP Equal channel angular pressing HTP High pressure torsion
LIST OF SYMBOLS
e (ε) True strain
σy Yield stress
σcr Critical stress for martensite reorientation σtr Transformation yield stress
σr (σrmax) Recovery stress (maximum recovery stress)
∆σr500 Degradation rate of recovery stress during first 500 cycles
∆σtr1000 Degradation rate of transformation yield stress during first 1000 cycles εt, % Total induced strain
εi, % Induced strain
εr (εrmax) Recovery strain (maximum recovery strain)
∆εr500 Degradation rate of recovery strain during first 500 cycles
max 1 ,
r
ε
Maximum completely recoverable strainεrSME Recovery strain of shape memory effect εrSE Recovery strain of superelastic effect εTW Strain of two-way shape memory effect
εf (εp) Residual (permanent) strain
εd (ε1000) Accumulated residual strain to failure (during first 1000 cycles)
max
poly
ε
Maximum macroscopic deformation of isotropic polycrystal (resource of recovery strain for polycrystal)max mono
ε Crystallographic resource of recovery strain in single-crystal
uvw i
ρ Lattice defect concentration
Nf Number of cycles to failure (fatigue life)
Nc Crack concentration
Bhkl X-ray peak mid-high width
∆Kth Fatigue threshold
dw Average size of weighted structural element R Relative density of orientation
Eunload Elasticity modulus of unloading branch of deformation diagram
m Strain-rate superplasticity exponent
INTRODUCTION
Ti-Ni shape memory alloys (SMAs) are used as heat-sensitive elements and thermomechanical actuators (shape memory property), and medical implants and tools (superelasticity effect). These applications require extended fatigue life and adequate stability of the SMAs’ functional properties. It has been shown that obtaining nanocrystalline structures can significantly improve the functional properties of Ti-Ni SMAs [1].
One of the methods of obtaining such structures consists of severe cold rolling (CR) followed by post-deformation annealing (PDA). This technique finds its limits in terms of the alloys’ fatigue life because of the processing-induced material damage [2]. It was hypothesized that the problem of forming nanocrystalline structures in Ti-Ni alloys, while decreasing damage during processing, can be solved by using warm plastic deformation and intermediate annealing technological steps [3].
It was hypothesized also that the introduction of warm rolling (WR) and intermediate annealing (IA) technological steps will create a specific texture in the material, which will improve further functional properties of the alloy. As a consequence, the possible control over the texture formation in Ti-Ni alloys and the detailed analysis of the texture–functional property interrelations were the first problems which were deemed necessary to address.
Second, an in-depth analysis of deformability of Ti-Ni SMAs can be the key to successful manufacturing of nanocrystalline structure formation with a limited number of processing-induced defects. It was hypothesized that preliminary structural refinement of Ti-Ni alloys can improve their deformability. Equal-channel angular pressing (ECAP) appeared to be the suitable technique for such a preliminary structural refinement since it does not modify the sample cross-section, which is an asset for subsequent processing.
From this point of view, the principal research objectives of this project were to study a) the interaction between the thermomechanical treatment (TMT), structure/texture and functional
properties of Ti-Ni SMAs; and b) to optimize the technological parameters of this thermomechanical treatment with the aim of obtaining the best combination of static and dynamic (fatigue) functional properties of Ti-Ni SMAs.
According to the principal research objectives, the work presented in this thesis is focused on the influence of TMT conditions on the microstructure, damageability, static and fatigue functional properties of Ti-Ni SMAs. First, it studies the particularities of structure and crystallographic texture formation in Ti-Ni alloys under conditions of severe CR and/or WR with the objective to obtain the best combination of their static and fatigue functional properties. It investigates next the influence of the microstructure resulting from this processing on the resistance of these alloys to small-crack propagation. Finally, comparing the strain-rate sensitivity and deformability of Ti-Ni SMAs with coarse- and ultrafine-grained microstructures at different temperatures and strain rates, the author proposes a new sequence of thermomechanical processing of these alloys capable of improving their deformability at low temperatures, and, therefore, their capacity to be nanostructured with the minimum risk of the processing-induced damage.
Thesis organization
The main results of the research have been published in four journal articles and are presented in Chapters 2, 3, 4, 5. Then, the important points of this research and some recommendations are presented in the conclusion. Annex I includes the detailed analysis of the fatigue life dependence on the initial recovery stress under recovery stress generation-relaxation tests.
Part 1: The influence of TMT including CR/WR and intermediate, PDA on the structure, texture, functional fatigue properties and processing-induced defects.
This part is presented in Chapter 2 of this thesis. It contains the first article entitled: “Microstructure and functional fatigue of nanostructured Ti-50.26 at.%Ni alloy after
thermomechanical treatment with warm rolling and intermediate annealing” by A.
Kreitcberg, V. Brailovski, S.D. Prokoshkin, Y. Facchinello, K. Inaekyan and S.M. Dubinskiy, and published in the journal Materials Science and Engineering A, 2013, v. 562, pp. 118-127.
Part 2: The contributions from structure and texture to the single-cycle recovery strain value of nanostructured Ti-Ni alloys.
This part is presented in Chapter 3 of this thesis and contains the second article entitled: “Role of the structure and texture in the realization of the recovery strain resource of the
nanostructured Ti-50.26 at.%Ni alloy” by A.Y. Kreitcberg, S.D. Prokoshkin, V. Brailovski,
A.V. Korotitskiy, and published in the journal The Physics of Metals and Metallography, 2014, v.115, no.9, pp. 926-947.
Part 3: An analysis of interrelations between the processing-induced microcracks, structure and fatigue life of nanostructured Ti-50.26 at.%Ni alloy.
This part is presented in Chapter 4 of this thesis and contains the third article entitled: “Influence of thermomechanical treatment on structure and crack propagation in
nanostructured Ti-50.26 at.%Ni alloy” by A. Kreitcberg, V. Brailovski, S. Prokoshkin, K.
Inaekyan, and published in the journal Metallography, Microstructure, and Analysis, 2014, v. 3, no. 1, pp. 46-57.
Part 4: The finding of the processing parameters such as deformation temperature, strain-rate and initial structure to improve manufacturability of Ti-Ni alloys.
This part is presented in Chapter 4 of this thesis and contains the fourth article entitled: “Effect of the grain/subgrain size on the strain-rate sensitivity and deformability of Ti-50
Khomutov, K. Inaekyan, and published in the journal Materials Science and Engineering A, 2015, v. 622, pp. 21-29.
CHAPTER 1 LITERATURE REVIEW
Fundamental functional characteristics of SMAs are recoverable strain and recovery stress, both characteristics depending on the alloys’ structure and texture.
Thermo and thermomechanical treatments (TMTs) of Ti-Ni alloys make it possible to form in these alloys nano- and ultrafine-grained structures thus to improve their functional properties. One of the TMT techniques is a combination of severe plastic deformation (SPD) and post-deformation annealing (PDA). The ideal SPD+PDA processing of Ti-Ni SMA should allow: (1) creating of uniformly distributed nano- and ultrafine-grained structures; (2) processing of large-size specimens; (3) minimizing the risk of material damage during processing.
There are a number of SPD techniques which allow the nano- and ultrafine-grained structures to be obtained, such as rolling, high pressure torsion (HPT), equal-channel angular extrusion or pressing (ECAP), multiple forging, etc. In this work, we will consider two of the most frequently used SPD methods for nanostructure formation: rolling and ECAP.
Marforming and ausforming
Depending on the Ti-Ni alloy transformation temperatures, it can be deformed in either martensitic (marforming) or austenitic (ausforming) states. The process of SPD has three main stages.
During stage I of marforming, elastic deformation of martensite occurs. During stage II, detwinning of martensite occurs, favoring growth of some variants at the expense of others. During stage III, plastic deformation of the reoriented martensite and martensite stabilization take place; the latter is caused by high dislocation density stored in the material. During stage
I of ausforming, elastic deformation of austenite occurs. During stage II, stress-induced martensitic transformation takes place. During stage III, plastic deformation of martensite occurs as in the case of marforming. When either ausforming or marforming of Ti-Ni SMAs are performed with sufficiently high strain levels, partial material amorphization takes place [4].
1.1 TMT of Ti-Ni SMA by rolling 1.1.1 Cold rolling
Deformation by rolling at room temperature followed by post-deformation annealing (CR + PDA) represent the simplest sequence of TMT applied to Ti-Ni SMAs to refine their microstructure and improve functional properties. Concurrent SPD technologies imply deformation at higher temperatures using more complex processing techniques: HPT and ECAP. Figure 1.1 illustrates the influence of the deformation intensity and temperature on the grain size of Ti-Ni SMAs after post-deformation annealing.
Figure 1.1 Grain size of Ti-Ni SMA as a function of the strain rate and temperature (adapted from [5])
After moderate CR (up to e=1.0), the austenite structure after PDA is mainly a polygonized substructure with a small fraction of nanocrystalline structure. Severe cold plastic deformation leads to the strain-induced grain refinement and amorphization [6, 7], and the greater the deformation, the greater the quantity of the amorphized material (Figure 1.1). When CR (e>1.0) is followed by PDA, the nanograins grow, the amorphized phase crystallizes, and the material consists of nanosize grains almost entirely exempt of dislocations.
The formation of the nanocrystalline structure in Ti-Ni alloys leads to higher transformation yield stresses (1500-1600 MPa), than in the case of the polygonized substructure (1100-1200 MPa). The difference between the yield and the transformation onset stresses in the case of
Inten sity o
f defor mation (l
nanocrystalline structure is also higher [1]. These factors determine higher values of reactive stresses and recoverable strains. However, the negative side of this processing consists in a higher level of defects created in the material during severe CR, and, as a consequence, a decreased fatigue life of the processed material. Therefore, to increase the number of cycles to failure, authors [8, 9] suggested cold rolling to be replaced by warm rolling. Since the cited works are precursors to my thesis, a short summary of the results obtained are given in sections 1.1.1.2 to 1.1.1.4.
1.1.2 Warm rolling
Generally, WR is carried out at TWR=0.25...0.5*Tm , where Tm [K] is melting temperature
[10]. For Ti-Ni SMAs, melting temperature is 1200°C; therefore TWR corresponds to
300-600°C. A previous study [9] showed that limiting Ti-50.26 at.%Ni WR temperature to 150oC (~0.15*Tm) and thickness reduction to e=1.2 allows the manufacture of mainly
nanocrystalline (but partially nanosubgrained) material, while decreasing the processing-induced damages (microcracks).
1.1.3 Structural analysis of Ti-Ni alloy
In [9], structure of Ti-Ni alloy after SPD was investigated by transmission electron microscopy (TEM). Ti-50.26 at.%Ni alloy samples were rolled down with pulling tension corresponding to 10% of the material’s yield stress at the roll mill entry. The total cumulative deformation corresponded to e=1.2. Temperature of the PDA was chosen as 400°C.
The purpose of this section is to discuss the structural changes caused by warm rolling, WR (TWR=150°C) and intermediate annealing, IA (400°C, 1h). The CR(e=1.2) route is selected as
a reference for processing leading to nanocrystalline structure. The results of TEM are presented in Figure 1.2.
Figure 1.2 TEM images of Ti-50.26 at.%Ni alloy after different TMT routes: a) route CR(e=1.2), b) route CR(e=0.3)+WR(e=0.9); c) CR(e=1)+IA+CR(e=0.2); and d) WR(e=1)+IA+WR(e=0.2). From left to right: bright-field image,
dark-field image, microdiffraction pattern [9]
According to Figure 1.2a, after CR(e=1.2) and PDA (400°C), the structure of Ti-50.26 at.%Ni alloy is a mixed nanocrystalline (NC) and nanosubgrained (NS) structure. The size of the NC grains is 15-70 nm (Figure 1.2a). From the dark field, the quantity of the NS structure corresponds to 10-15% with mean subgrain size up to 150 nm [9].
Combination of CR and WR, CR(e=0.3)+WR(e=0.9), creates grains with size up to 80-150 nm. The quantity of the NS structure is greater than the NC structure (Figure 1.2b). Intermediate annealing at 400°C, CR(e=1)+IA+CR(e=0.2), leads to 60-120 nm grain size (Figure 1.2c), which is 1.5-2 times larger than after reference processing. Quantity of the NS structure is limited, because it is not detectable on the bright- and dark-field images and on the microdiffraction pattern [9].
Finally, structure after WR(e=1)+IA+WR(e=0.2) is mostly NS with grain size up to 200 nm (Figure 1.2d). However, NC structure is also present. An increased density of dislocation can be mentioned, and this structure is characterized as a polygonized dislocation substructure.
Accordingly, different combinations of CR and WR and IA create the mixture of NC and NS structures. Although changes in grain size are observed, this structure remains in a NC and NS size range. Therefore, WR at 150°C and IA at 400°C can be applied to obtain nanocrystalline structures and to study their influence on the mechanical properties and fatigue life of Ti-Ni SMA. This methodology will be used in this work for testing.
1.1.4 Thermomechanical characterization of nanostructured Ti-Ni alloy
Stress-free recovery testing
Stress-free recovery testing was carried out using Enduratec ELF 3200 (Bose) testing equipment [3, 9]. The sample was first strained up to 9% (Figure 1.3a: O-A). Stress was then released to allow elastic springback (A-B). The initial strain was then set at about εi = 6-7%
for all the processing routes. When state B was reached, the sample was heated up to a 100°C (complete shape recovery) (B-C). After the sample was free air-cooled down to RT (C-E), the test was repeated up to the sample’s failure.
Figure 1.3 Stress-strain plots: a) stress-free recovery testing and b) constrained recovery testing; both for N=1 (Ti-50.26 at.%Ni alloy after
CR(e=1.2)+PDA 400°C, 1h) [3]
Stress-free recovery testing was carried out for Ti-50.26 at.%Ni alloy using the six following routes: CR(e=1.2), CR(e=1)+WR(e=0.2), CR(e=0.3)+WR(e=0.9), CR(e=1)+IA+CR(e=0.2), CR(e=1)+IA+WR(e=0.2), WR(e=1)+IA+WR(e=0.2).
The recoverable strain remains constant (around 5.5%) for all the cases. However, the greater heat energy supplied to the material during processing, the higher the two-way strain εTW.
Also, it is worth noting that the number of cycles to failure increases with processing routes containing WR or IA. The highest number of cycles to failure is observed after CR(e=1)+IA+WR(e=0.2) and WR(e=1)+IA+WR(e=0.2), whereas the lowest number of cycles is observed after reference processing, CR(e=1.2) [9].
Constrained recovery testing
Constrained recovery testing was carried out on a custom testing bench [9] using the same processing routes. Sample was strained up to 9% (Figure 1.3b: O-A), then released to allow elastic springback (A-B). The initial strain was then set at εi=6-7%. After that, the sample
was heated from room temperature to 200°C to allow the almost complete reverse martensitic transformation (B-C) and finally air-cooled to room temperature.
As in the previous test, the number of cycles to failure increases with increasing heat energy provided to the specimen during processing, but at the expense of the functional stability. The greatest fatigue life was observed after WR(e=1)+IA+WR(e=0.2), 2028 cycles, which is 2.5 times higher than after reference processing CR(e=1.2), 782 cycles. However during cycling, recovery stress after WR(e=1)+IA+WR(e=0.2) decreased more that after CR(e=1.2) (degradation rate of 24% towards 17%). The exact mechanism of this influence is not clear and may be a combination of stress relaxation resulting from IA and a specific deformation texture created by deformation of the mainly nanosubgrained material and also the greater damage of Ti-Ni alloys after entirely cold rolling.
1.1.5 Effect of TMT by rolling on the texture and properties of Ti-Ni SMAs
The shape memory effect in Ti-Ni alloys also depends on texture; therefore, the texture formation and its influence on the functional properties (recovery strain) is described in this chapter.
Texture forms when there is a preferential orientation of the external forces acting on the sample, for example in cases of plastic deformation, compacting and other technological processes [11]. Depending on the sequence of the technological processing, three types of texture could be considered: recrystallization (generally taken as a reference texture), deformation texture and annealing textures [12].
Effect of CR on the austenite texture
Authors [12] in their study identified the recrystallization texture of Ti-Ni austenite after heat treatment at 500°C and subsequent quenching in water at room temperature such as {110}<110>, where {hkl} is a rolling plane and <uvw> is rolling direction (RD).
The low-intensity CR does not affect this recrystallization austenite texture; after CR up to 30%, austenite texture remains {110}<110>B2 [12-14]. However, during CR and PDA, other texture components can appear. For example, after 30% of CR and thermal treatment at 500°C (30 min), two components of austenite texture were observed in Ti-49 at.%Ni alloy: principal {110}<110> and secondary {001}<110> [14].
Severe CR contributes to the appearance of a multicomponent texture. For example, α-fiber II B2-texture – {110}<110> + {111}<110> – was obtained in a Ti-45Ni-5Cu sample after multiple-pass CR with IA at 500°C (10 min) and final annealing at 500°C (1.5 h) [15]. The {110}<110> component intensity and density were higher than those of the {111}<110> component, which allows the obtained texture to be identified as mainly {110}<110>B2.
Effect of the heat treatment temperature after CR on the austenite texture
Rolling and annealing affect the deformation texture as well as the recrystallization texture. Usually heat treatment temperature for shape memorization is slightly below the recrystallization temperature, which is about 500°C. In this case, heat treatment only causes recovery without changing the crystallite orientation distribution appreciably, so that the deformation texture remains and affects the shape memory characteristics of the rolled plates. Since the rolled plates are generally subjected to multiple IA, the annealing texture is also involved in the technological process. Therefore, control of the annealing texture is also of importance for the purpose of tailoring the final texture of TiNi-based SMA rolled plates [16].
As said, PDA after a low level of CR (up to 30%) does not change austenite texture. But when CR intensity is higher, texture depends on the PDA temperature. There are three levels of temperature to be considered: below, above and around the recrystallization temperature (~500°C).
In [16], the influence of the annealing temperature on the austenite texture was analyzed. Texture of the Ti-50.5Ni-0.4Fe alloy samples after CR and annealing at 400°C was identified as being similar to the γ-fiber {111}<110>+{111}<112> texture. 400°C is below the recrystallization temperature, so that the deformation texture with high dislocation density, thermally rearranged by recovery, was retained.
Increasing the temperature up to 600°C, led to the {221}<110>B2-texture formation. 600°C is slightly higher than the recrystallization temperature, and sub-micron sized grains were formed in this situation [16]. After subsequent heating at 1000°C, texture was composed of two components {332}<110> and {111}<011>, and this texture formation was accompanied by intensive growth of recrystallized grains.
Effect of hot rolling on the austenite texture
The authors [17] found {112}<110> texture in the parent phase of Ti-50.0 at.%Ni subjected to hot rolling (HR).
{111}<110> austenite texture was measured in Ti-49.2 at.%Ni alloy after annealing at 400°C and final recrystallization annealing after 50% of HR [13].
Ti-50.5 at.%Ni samples after HR at a temperature not exceeding 1000°С and then annealed, rolled at 500°С and quenched from 800°C in water had a recrystallization B2-phase texture of {110}<110> [18].
Combined influence of CR and HR on the austenite texture
The deformation mechanisms which operate in austenite during HR are related to the deformation mechanisms in martensite during CR by a specific orientation relationship [13, 19]. For example, after HR of Ti-50.4 at.%Ni alloy at 850°C, annealing at 800°C (30 min) and CR at room temperature, austenite texture was an α-fiber I like texture: {001}<110>+{112}<110>,{111}<110>, extended from the orientation (885)[110] to (112)[110], the fiber axis [110] being parallel to the RD, and the maximum orientation density of 7.15 at (885)[110] orientation [20, 21].
Effect of annealing time on the austenite texture
Long annealing changes the austenite texture. For Ti-51.5 at.%Ni alloy, rolled and annealed at 820oC (10 min) and then aged at 500oC (1.5 h), B2-texture was {111}<112>, but after annealing for 500°C (5 h) and aging under the same conditions, B2-texture was {111}<213> [22]. Texture of Ti-50.45 at.%Ni alloy after HR and aging at 500°C (10 h) was {112}<110> and {001}<110> [19].
The single-component texture is more likely to occur after the one-step deformation process. In particular, {110}<110> and {111}<110> (α-fiber II texture) is generally observed after CR of Ti-Ni SMAs. The higher the rolling intensity, the greater the chances that both textures appear at the same time. The more complicated the processing route is, the more components could be present in the austenite texture.
Martensite texture evolution during CR
Martensite lattice is monoclinic, and therefore texture analysis is complex. To simplify the martensite texture analysis, pole figures are frequently compared with the standard projection of the cubic system, which contributes to error and incorrect texture definition [23, 24].
As known, 12 martensite variants correspond to one crystal of austenite. Therefore, even when austenite texture doesn’t change, martensite texture may be evaluated. For example, martensite texture changes in the case of conventional (low-intensity) CR contrary to the austenite texture. For example, B19`-martensite texture containing the following variants: 3, (120)[211], and 5, (120)[002], after CR was replaced by 2, (102)[211], 4, (102)[211] and 6, (102)[020] after PDA [12]. All these martensite texture components correspond to the single {111}<110> component of the austenite texture.
Texture versus properties for polycrystalline Ti-Ni SMAs
Based on the results of the literature review, a generalized austenite texture in Ti-Ni SMAs might be represented by the following components: {110}<110>, {111}<110>, {001}<110> and {112}<110>.
Texture component {110}<110> (recrystallization texture according to [12]) occurs more frequently than other components in Ti-Ni SMAs. One can observe it after recrystallization annealing, CR and HR. However, the more complicated the thermomechanical processing is, the more probable the appearance of other texture components.
{110}<110> austenite texture leads to the highest transformation (lattice) strain corresponding to maximum deformation of the crystallographic lattice [15, 25]. But taking into account the grain accommodation phenomena in polycrystalline material, very high planar anisotropy results from this texture with very low recoverable strain in rolling direction (RD), ~3% [19]. No experimental results related to the {110}<110> single-component austenite texture were found.
Texture component {111}<110> is the next one after {110}<110> in the order of frequency in textured Ti-Ni alloys. Authors [23] called the {111}<110> texture the deformation texture of B2-austenite. In fact, it is present after complex deformation processes: for example, after
moderate and severe cold or hot deformation with IA, when temperature doesn’t exceed the recrystallization temperature (~500°C). According to the calculation, {111}<110> leads to high lattice (8.4%) and recoverable (~5.5%) strains with moderate anisotropy [15, 19]. However, no experimental confirmation was found for this case.
Texture component {001}<110> has not been observed as a single-component austenite texture. It was always present in combination with other texture components, after complex deformation routes, such as CR and HR and aging. The theoretically predicted recovery strain for this texture doesn’t exceed 5.5% at 0 and 90° to RD, and there is a drop to 3.1% at 45° to RD (<010>) [19]. Thus, this texture leads to high planar anisotropy of recoverable strain.
Texture component {112}<110> was observed after HR, as well as after combined CR and HR plus aging. Frequently, this component accompanies the {001}<110> texture after HR and aging. No any calculated transformation (lattice) strain values were not found for this case: neither for single crystals, nor for polycrystalline materials. At 0° to RD, the measured recoverable strain was close to 5.5%, similar to this value for {111}<110> and {001}<110> components. This texture leads to a significant anisotropy of measured recoverable strains: at 90° to RD (<111>), recoverable strain was about 7%, whereas at 45°, it was around 3.5% [19].
Based on the literature data, the following scheme could be used to illustrate the influence of the thermomechanical processing on the texture components and recoverable strains in RD (Figure 1.4).
Figure 1.4 Influence of the TMT on the texture components and recoverable strains (adapted from [19])
1.2 TMT of Ti-Ni SMA by ECAP
Equal channel angular pressing is the SPD process that permits application of a large amount of uniform strain without a reduction in a cross-section area. ECAP is superior to other techniques because of the formation of uniform microstructures, control over the development of grain morphology and texture. This method realizes deformation of massive billets via pure shear. Figure 1.5 shows a schematic representation of the ECAP process. The cross-section of the billet can be a circle, square or rectangle cross-sections. The billet is pressed down by a plunger from the top of the vertical channel and it is deformed in the shear zone and extruded from the horizontal channel with the same diameter. The angle between two intersected channels ranges between 90 and 120°. In the case of hardly-deformed materials, the deformation can be carried out at high temperature and/or greater extrusion angle. Every pass at angle of 90° corresponds to a total strain equal to 1, which is equivalent to 70% of CR.
Figure 1.5 Schematic representation of the ECAP processing: (a) 90°-angle ECAP; (b) schematic representation of the 90°-angle determination [26, 27]
To calculate the accumulated shear strain applied to a billet during N-pass ECAP processing, the following formula can be used [26]:
2 ( / 2 / 2) cos ( / 2 / 2) 3 N ctg ec e = N φ +ψ +ψ φ +ψ (1.1)
where N – number of passes; φ – inner angle; ψ – outer angle.
The ECAP treatment is controlled through five process parameters:
1. Angle between the channels; 2. Temperature during treatment; 3. Pressing rate (strain per pass); 4. Number of passes; Plunger Billet Channel Die
a
5. Rotation of the material between passes.
Rotation of the material between pressings is possible because the material retains its initial cross-section. The following routes can be considered: (1) billet orientation remains constant for each pass (route A); (2) after each pass, the billet is rotated around its longitudinal axis by 90° (route B); (3) after each pass, the billet is rotated around its longitudinal axis by 180° (route C) [28]. Authors [29] showed that for pure titanium, a uniform microstructure with high quality of surface forms after 2n or 4n passes (n – whole number) in the case of route B. Shear deformation during uneven pass of route B leads to grain elongation, although every even pass returns a cubic element in the working piece to its original cubic shape. It provides uniform equiaxed structure [30].
Influence of the ECAP strain rate on the Ti-Ni alloys’ deformation mechanisms
Experiments at high strain rates lead to shear localization arising from adiabatic heat dissipation and local thermal softening of the material [4, 28, 31-33]. Localized shear is an important mode of deformation. It results in catastrophic failure during high strain-rate deformation. Consequently, one of the purposes is to control strain-rate and, correspondingly, localized shear deformation and formation of shear bands. Also, at high strain-rates, strong local heating can occur and, consequently, strain-induced austenite formation (in the case of the marforming process) provokes appearance of macroshear bands. Observed transformation bands lead to a strong deformation localization and to strong local heating.
Therefore, during marforming (deformation of martensite structure), the pressing rate is generally kept sufficiently small to minimize deformation heating. At higher temperatures (ausforming), where no martensite/austenite transformation can occur, the rate can be higher. And if the specimen has been heated in a furnace and then placed in the ECAP die, the specimen temperature decreases with time at a low strain-rate, which should be taken into account. For example, authors [4] carried out ECAP at room temperature in martensite state
with extremely small rate (0.127 mm/s) to avoid local heating. The increase of ECAP temperature up to 450°C allowed application of strain-rates as high as 8 mm/s [4, 34-43]. A combined influence of the strain-rate and temperature on the deformation mechanisms (one ECAP pass with 90° angle) of Ti-49.8 at.%Ni alloy is presented in Table 1.1.
Table 1.1 ECAP conditions and the proposed deformation mechanisms that occurred during processing of Ti-49.8 at.%Ni alloy [4]
Processing temperature Initial phase Pressing rate (mm/s) Deformation mechanisms
RT martensite 0.127 Martensite reorientation and plastic deformation by dislocation slip
50°C (close to As) martensite 0.25 Dislocation slip in martensite and local
formation of strain-induced B2 phase 150°C austenite 0.25 Stress-induced martensite formation and
plastic deformation by dislocation slip
Influence of ECAP parameters on the Ti-Ni alloys’ microstructure
The stress-strain state during ECAP differs from the stress-strain state during rolling; one should therefore expect different microstructures after the same level of total deformation strain. In the case of ECAP, along with tensile and compression strains, shear strain contributes to the structure formation.
1.2.1 Formation of the ultrafine-grained structure
The microstructure formation is affected by the processing temperature and total ECAP strain. The higher the pressing temperature, the higher the total strain required for achievement of the desired microstructure.
Microstructure of Ti-50.2 at.%Ni alloy after ECAP at 450°C with total strain e = 0.81 showed reduction of grain size down to 600 nm compared to the as-quenched state (80 µm) [34]. If the total strain increases to 3.2, the grain size decreases to 450 nm and after e = 6.5, it is 200-300 nm [34-39]. However, reduction of the grain size to this low limit (230 nm) was achieved by lowering of the ECAP temperature to 400°C, whereas enlargement of the grain size to 300 nm was achieved by increase of the ECAP temperature to 500°C [34]. If the total ECAP strain increases to 9.2, no effect on the grain size was found [34-38]. Finally, the finest submicrocrystalline structure (100-200 nm) was obtained in Ti-50.6 at.%Ni alloy after ECAP at 350°C with e = 4.9 [43].
The high-temperature ECAP processing with even number of cycles (and e=4.9-9.2) results in the formation of equiaxed ultracrystalline structure. However, high stresses and lattice distortions are measured inside of the grains and in their boundaries. Non-equilibrium grains contain well-developed substructure with high dislocation density. We can conclude that an increase in ECAP temperature is not the best-suited solution for the microstructure refinement, because it requires application of higher total strains (greater pressing angle and/or more number of passes) to reach the same grain size.
Influence of post-ECAP annealing on the ultrafine-grained structure
During PDA of the ECAP-processed samples, structural recovery takes place. After annealing at 300°C, 20 min, the average grain size changes are not significant: they remain of about 200-300 nm in size. However, non-equilibrium grain boundaries become more contrasted. Following high-temperature annealing (500°C), grain size increases up to 400-500 nm. Further temperature rise (550-600°C, 1h) results in grain growth to up to 600-800 nm [41, 42].
1.2.2 Formation of nanostructures
It is reasonable to expect that further structural refinement of Ti-Ni SMAs down to nano-scale could be obtained if ECAP was conducted at temperatures lower than 350°C-300°C [43-46]. However, the results of the ECAP processing of Ti-Ni alloys at low-temperature can be found in only two reports [44, 45], where the authors pretend detecting the presence of nanostructures after ECAP of Ti-49.8 at.%Ni and Ti-50.8 at.%Ni alloys billets at room temperature (one pass with e=1.15). However, the photo published in one of these works exhibits a billet with large macrocracks [45], which should have made it useless for subsequent passes and testing (Figure 1.6a). Moreover, the results of microstructural analysis presented in [44, 45] raise serious doubts of whether a true nanocrystalline structure have indeed been obtained after e=1.15 in this works, since the presented TEM images and X-Ray diffractograms are more characteristic of the nanosubgrained and, certainly, none of the nanocrystalline structure (Figure 1.6b).
Figure 1.6 (a) Cross-section of billet [45] and (b) TEM image of Ti-49.8 at.%Ni alloy after ECAP at room
temperature and PDA at 400°C [4]
1.3 Functional properties of Ti-Ni alloys after ECAP and CR processes Since the stress-strain states during CR and ECAP processing are different, it is interesting to compare the functional properties of the submicrocrystalline and nanocrystalline structures after these TMTs. The maximum recovery stress (∆σ) was calculated from the stress-strain diagrams as a difference between the critical stress for martensite reorientation (stress-induced martensitic phase transformation) and the true yield stress of martensite (Figure 1.7). The maximum recovery stress and austenite microstructure after CR and ECAP processing are presented in Table 1.2.
Figure 1.7 Typical tensile stress-strain plot to failure
Table 1.2 Structure and functional properties of Ti-Ni alloys after various treatment [4, 43, 46]
Alloy Treatment Structure of austenite ∆σ, MPa
Ti-50.0 at.%Ni CR(e=0.3)+350-400°C Recovered and polygonized 900 CR(e=0.88)+350-400°C Nanosubgrained and
nanocrystalline
1100
Ti-50.26 at.%Ni CR(e=1.2)+400°С Nanocrystalline (15-50 nm) 1500 Ti-50.2 at.%Ni ECAP (450°C, e=3.2-9.2) Submicrocrystalline (200-400 nm)
800-1100 Ti-50.6 at.%Ni ECAP (450°C, e=6.5) Submicrocrystalline (200-400 nm) 720 ECAP (350°C, e=4.9) Submicrocrystalline (100-200 nm) 780
Comparing the maximum ∆σ of the ultrafine-grained Ti-Ni alloys after CR and ECAP processing, it can be noted that the smaller the grain (or subgrain) size, the higher the ∆σ. The maximum comparable ∆σ is observed in the case of nanostructures resulting from CR. However, considering the differences between ECAP and rolling of Ti-Ni alloy, ECAP allows formation of a mainly ultrafine-grained structure with d ≥ 200 nm; on the other hand, this method makes it possible to deform massive billets without changing their cross-section, which provides the net advantage for the preliminary structural refinement.
1.4 Research objectives
As was shown by the literature review, first, a specific combination of CR, WR and IA leads to a significantly increased fatigue life with high level of functional properties [9].
![Figure 1.1 Grain size of Ti-Ni SMA as a function of the strain rate and temperature (adapted from [5])](https://thumb-eu.123doks.com/thumbv2/123doknet/7691148.243846/33.918.221.784.163.669/figure-grain-size-sma-function-strain-temperature-adapted.webp)
![Figure 1.4 Influence of the TMT on the texture components and recoverable strains (adapted from [19])](https://thumb-eu.123doks.com/thumbv2/123doknet/7691148.243846/44.918.100.744.163.492/figure-influence-tmt-texture-components-recoverable-strains-adapted.webp)
![Figure 1.6 (a) Cross-section of billet [45] and (b) TEM image of Ti-49.8 at.%Ni alloy after ECAP at room](https://thumb-eu.123doks.com/thumbv2/123doknet/7691148.243846/49.918.270.732.634.927/figure-cross-section-billet-tem-image-alloy-ecap.webp)
![Figure 1.9 Schematic view of the: a) rolling mill and pulling tension system; b) electric heating system [9]](https://thumb-eu.123doks.com/thumbv2/123doknet/7691148.243846/55.918.171.830.162.579/figure-schematic-view-rolling-pulling-tension-electric-heating.webp)