HAL Id: hal-01462369
https://hal.archives-ouvertes.fr/hal-01462369
Submitted on 6 Jun 2020HAL is a multi-disciplinary open access
archive for the deposit and dissemination of sci-entific research documents, whether they are pub-lished or not. The documents may come from teaching and research institutions in France or abroad, or from public or private research centers.
L’archive ouverte pluridisciplinaire HAL, est destinée au dépôt et à la diffusion de documents scientifiques de niveau recherche, publiés ou non, émanant des établissements d’enseignement et de recherche français ou étrangers, des laboratoires publics ou privés.
Europe: a comparison of Hungary and France
Jozsef Fogarasi, Laure Latruffe
To cite this version:
Jozsef Fogarasi, Laure Latruffe. Farm performance and support in Central and Western Europe: a comparison of Hungary and France. [University works] auto-saisine. 2009, 23 p. �hal-01462369�
Farm performance and support in Central and Western
Europe: A comparison of Hungary and France
Laure LATRUFFE, Jozsef FOGARASI
Working Paper SMART – LERECO N°09-07
Farm performance and support in Central and Western Europe:
A comparison of Hungary and France
Laure LATRUFFE
INRA, UMR1302 SMART, F-35000 Rennes, France Agrocampus Ouest, UMR1302 SMART, F-35000 Rennes, France
Jozsef FOGARASI
AKI, Budapest, Hungary
Acknowledgements
This research benefited from financial support from the French Ministry of Foreign Affairs (ECO-NET program).
Auteur pour la correspondance / Corresponding author
Laure LATRUFFE
INRA, UMR SMART
4 allée Adolphe Bobierre, CS 61103 35011 Rennes cedex, France
Email: Laure.Latruffe@rennes.inra.fr
Téléphone / Phone: +33 (0)2 23 48 53 93 Fax: +33 (0)2 23 48 53 80
Farm performance and support in Central and Western Europe: A comparison of Hungary and France
Abstract
The paper investigates the difference in technical efficiency and in productivity change, and the technology gaps, between French and Hungarian farms in the dairy and cereal, oilseeds and proteinseeds (COP) sectors during the period 2001-2004. The analyses are performed with national FADN data and the Data Envelopment Analysis (DEA) approach under each country’s respective frontier and under a metafrontier.
Results revealed that in both the dairy and the COP sectors, Hungarian farms’ technology was the more productive, despite a technological deterioration. This suggests technological advantages for large-scale (Hungarian) over small-scale (French) farming in these two sectors. These findings may also be explained by the higher policy support in France. Subsidies received by farms have indeed a stronger negative impact on technical efficiency for French farms than for Hungarian farms, and a negative impact on the ability to lead the technology only for French farms.
Keywords: technology gap, technical efficiency, Malmquist indices, subsidies, farms
Performance et soutien public des exploitations agricoles en Europe centrale et occidentale : Comparaison Hongrie-France
Résumé
Nous analysons ici les différences en termes d’efficacité technique, d’évolution de la productivité, et de retard de technologie, entre les exploitations agricoles françaises et hongroises laitières et spécialisées en céréales et oléoprotéagineux (COP), sur la période 2001-2004. Nous utilisons des données des RICA nationaux et la méthode d’analyse d’enveloppement des données (Data Envelopment Analysis, DEA) sous l’hypothèse de frontières d’efficacité séparées selon les pays et sous l’hypothèse d’une frontière commune aux deux pays (métafrontière).
Nos résultats indiquent que dans les deux secteurs étudiés (lait et COP), la technologie des exploitations hongroises la plus productive, malgré une absence de progrès technique. Il semble donc que les systèmes agricoles de grande taille (en Hongrie) ont un avantage technologique sur les systèmes plus petits (en France) dans les deux secteurs. Nos résultats peuvent également s’expliquer par le soutien public, plus important pour les exploitations françaises. Les subventions reçues par les exploitations ont en effet un impact négatif plus fort sur l’efficacité technique des exploitations françaises que sur celle des exploitations hongroises, et un impact négatif pour les exploitations françaises sur la capacité d’avoir une technologie productive.
Mots-clefs : retard de technologie, efficacité technique, indices de Malmquist, subventions,
exploitations agricoles
Farm performance and support in Central and Western Europe: A comparison of Hungary and France
1. Introduction
Technical efficiency of farms in Central and Eastern European Countries (CEECs) during the transition has received large attention from researchers (for a review, see Gorton and Davidova, 2004). Studies generally agreed that there was a substantial potential improvement for these farms, and related the low efficiency to market and institutional failures that prevented farmers to close the gap with the efficient frontier. Such analyses shed light on which farms were laying backwards within the country. However, they did not evaluate farms’ performance in comparison to Western countries. This issue is however becoming increasingly important with the European Union (EU) enlargement, as farms from CEECs now have to compete with their EU-15 counterparts on the single market. The expectation on the relative performance of CEECs compared to the EU-15 is ambiguous. On the one hand, the technology might be obsolete as farmers’ investment decisions might have been constrained by the lack of financing (e.g. Swinnen and Gow, 1999; Petrick, 2004; Latruffe, 2005; Fertö et al., 2006); on the other hand, most of the land is farmed by corporate farms, whose large production scale might give an advantage to the farming sector in these countries.
This paper proposes to initiate the debate with an analysis of the performance of Hungarian farms specialised in two of the country’s major outputs, milk (European Type of Farming TF41) and cereals, oilseeds and proteinseeds (COP) (TF13), compared with their French counterparts. France is a good benchmark in the EU-15, as it is one of the major producers of COP and milk in this region, with respectively 30 percent and 20 percent yearly average production in 2001-2004 (Eurostat, 2008). Moreover, France is an important import supplier for Hungary in these commodities, particularly for COP products (third import country). Furthermore, Hungarian and French COP and dairy products are competing on the foreign markets inside and outside the EU-27. The analyses are performed with balanced panel data for the years 2001-2004.
The objective of the paper is to investigate how farms in Hungary and France differ in terms of performance, and which country leads the technology. Firstly, technical efficiency (that is to say the ability of a farm to use the best existing technology in terms of quantities) and Total Factor Productivity (TFP) changes, are calculated under each country’s respective technology
frontier, in order to assess the room for improvement within each country. In opposite to Polish farms, the performance of Hungarian farms has not received huge interest in the literature. Only a few papers investigated productivity or technical efficiency at a specific date during the transition (Hughes, 2000; Mathijs and Vranken, 2001; Davidova et al., 2002).
Secondly, the same measures (technical efficiency and TFP change) are calculated with a common technology frontier, that is to say a metafrontier constructed on the merged sample of both countries, in order to understand which country is lagging behind in terms of technology. Comparing countries in terms of farm efficiency and technology with the help of a metafrontier has not been widely studied in the literature (except for Brümmer et al., 2002, and O’Donnell et al., 2008), and never in terms of TFP change.
Thirdly, the role of subsidies on farms’ performance (technical efficiency, TFP change and technology superiority) in France and in Hungary is compared. Public subsidies are among the main factors explaining farms’ technical efficiency, or, rather, explaining farms’ technical inefficiency. The intuitive idea usually put forward it that, by providing a certain income, subsidies may reduce farmers’ motivation and effort, and thus result in an increase of inputs’ waste or in inadequate farming practices. Empirical evidence of such negative impact of subsidies on farms’ technical efficiency has been provided in the literature for Western countries (e.g. Giannakas et al., 2001; Latruffe et al., 2008b; Zhu et al., 2008). Studies about CEECs are however rare (except for Bojnec and Latruffe, 2009), and this paper will contribute to this issue. Regarding the influence of public subsidies on TFP change, the impact is indefinite, as TFP change comprises two components: technological change and technical efficiency change. While theoretically subsidies have a positive impact on technological change due to the relaxing of credit constraints, the impact on efficiency change is ambiguous. The literature on this issue is inexistent, and the paper will also help shed light on it. Another contribution is that we investigate whether subsidies additionally contribute to technology gaps between two countries, by using efficiency results from the metafrontier, which has never been done so far.
The paper is structured as follows. The next section describes the methodology and data used. The third section presents the results. The last section concludes.
2. Methodology and data used
2.1. Methodology
In this paper the non-parametric approach Data Envelopment Analysis (DEA) is employed to calculate farms’ performance indicators. DEA does not necessitate assumptions about the production function and the error term distribution, and therefore potential misspecifications are avoided. Instead, DEA uses linear programming to construct the efficient frontier with the best performing observations of the sample used, so that the frontier envelops all observations (see Charnes et al., 1978). The distance from a farm to the frontier provides a measure of its efficiency. Efficiency scores are between 0 and 1, 1 indicating a fully efficient farm (i.e. on the frontier) and a larger score showing a higher efficiency. DEA also enables to assess under which returns to scale each farm operates (see Coelli et al., 2005): constant (CRS), decreasing (DRS) or increasing (IRS) returns to scale.
To assess the technology gap between two groups of observations, we use the method originally proposed by Charnes et al. (1981) in the case of two types of education programmes, and used for example by Oude Lansink et al. (2002) to compare organic and conventional farms’ technology in Finland. The method relies on constructing a DEA metafrontier, that is to say a frontier enveloping several groups of observations whose technology differs, and comparing it with the respective frontier of each group, in order to identify technology gaps between each group’s frontier and the enveloping metafrontier. The method consists in three steps. In a first step, yearly technical efficiencies under respective frontiers are calculated, that is to say a frontier is constructed for each country (for each year). This shows how farms in each country perform with respect to their own country’s technology. In a second step, both countries are merged in a unique sample and a common frontier is constructed (each year). Yearly technical efficiencies are calculated under this metafrontier. In the third step, a technology ratio (also called productivity factor) is computed for each farm (in each year): the ratio is the farm’s technical efficiency calculated under the metafrontier divided by the farm’s technical efficiency calculated under the respective country’s frontier. By construction, the ratios are equal or less than 1. Average technology ratios for French farms and Hungarian farms are then compared; if they are different, it indicates a gap between both countries’ technology, with the higher average revealing the more productive technology.
In addition to investigating farms’ yearly technical efficiencies as explained above, the change in farms’ performance over the whole period is studied. This is done with the help of Malmquist indices, which can show the change in TFP between two periods, based on the farms’ distance to the frontier in each year (Caves et al., 1982). Malmquist indices can then be decomposed into the part of TFP change that is due to a change in farms’ position with respect to the frontier, that is the technical efficiency change, and the part of TFP change that is due to a shift of the frontier over time, that is the technological change (Färe et al., 1992). Indices equal to 1 indicate no change, while indices greater (less) than 1 show a progress (a regress).
Finally, with the help of econometric regressions we investigate the role of subsidies on farms’ performance in both countries. Regressions are carried out on the merged sample (including French and Hungarian farms). The dependent variables used are in turn: the technical efficiency scores calculated under each country’s frontier; the technology ratios; the TFP change indices calculated under each country’s frontier. Thus, three regressions are undertaken for the COP merged sample, and three regressions for the dairy merged sample. In order to control for size effects, the indicator for subsidies is defined as a ratio: the ratio of total subsidies received to total output produced for the COP sample, and the ratio of total subsidies received to milk output produced for the dairy sample. The difference in the effect of subsidies between both countries is assessed with the introduction of a cross-term defined as the product of the subsidy proxy and of a dummy taking the value 1 for Hungarian farms and the value 0 for French farms.
2.2. DEA model specification and data
For dairy farms (TF41), the DEA model includes two outputs – the quantity of milk produced in litres and the value of other output in euros –, and five inputs – the agricultural utilised area in hectares (ha), the total labour used in Annual Working Units (AWU; 1 AWU corresponds to 2,200 work hours), the value of total assets in euros, the value of intermediate consumption in euros, and the number of livestock units (calculated with the standard European definition). For COP farms (TF13), the model includes a single output – the value of total output in euros –, and four inputs – the same as for dairy farms except for the livestock units which are not included. All values were deflated by relevant price indices.
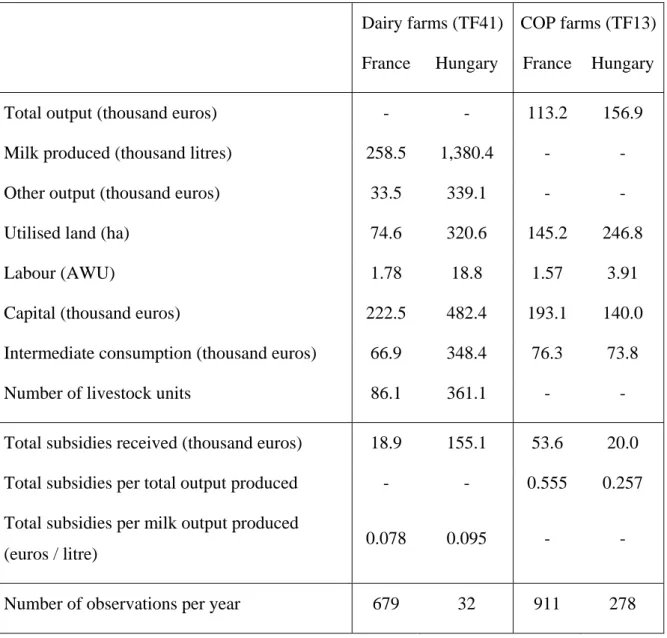
Balanced panel data from each country’s national Farm Accountancy Data Network (FADN) database over the period 2001-2004 are used. Table 1 presents the average output and inputs for both countries over the period studied. Hungarian farms were much larger than French farms, in particular in the dairy sector. For example, the Hungarian COP sample operated on average 247 ha of land against 145 ha for French COP farms, and the respective figures for dairy farms are 321 ha and 75 ha. This is due to the presence of large corporate farms in Hungary. These farming structures were created by the land reform initiated in 1991 in the country. Although a large part land of the former collective farms’ land was distributed to their workers or restituted to former owners, and land from former State farms was sold, most of the individual new owners chose to keep their land in collective large-scale structures (cooperative farms or companies) (Macours and Swinnen, 2000). The size difference between both countries remains when comparing the other production factors and the outputs, except for capital and intermediate consumption, which were lower for Hungarian COP farms than for French COP farms. The evolution over the period is not shown in the table. The main features of this evolution is that the French dairy and COP samples have experienced very slight changes in their output produced and their input use. By contrast, the Hungarian dairy and COP farms’ outputs and inputs have rather fluctuated, except for a steady increase of assets.
Table 1 also displays the value of subsidies received by farms during the period studied, as well as the ratio of total subsidies received to total output produced for the COP samples, and the ratio of total subsidies received to milk output produced for the dairy samples. During 2001-2004, in the COP sector, French farms received as much as twice subsidies than Hungarian farms on average: 0.555 euro for every euro of output produced in France, against 0.257 in Hungary. In the dairy sector the subsidy per milk ratio is slightly higher in Hungary: 0.078 euro for every litre of milk produced in France, against 0.095 in Hungary on average. During the period studied public support to COP farms in France was a mix of guaranteed prices and payments coupled to the number of hectares or of livestock heads in the frame of the Common Agricultural Policy (CAP). The Agenda 2000 had just come into place, continuing the 1992 CAP reform of reduced price support and move towards area and livestock payments. In Hungary in 2001-2003 COP production was subsidised in the form of area payments. The area payment scheme was changed after EU accession in 2004, when the Single Area Payment (SAP) scheme has been introduced. From this year onwards, the area payment received by COP producers consists of two parts: a decoupled SAP financed from
the EU budget and a coupled top-up payment financed from the national budget. In the first year of EU accession Hungarian COP farmers received 55 percent of the level of the area payment paid to farmers in the EU-15 Member States: 25 percent coming from SAP and 30 percent as top-ups.
Table 1: Description of the samples: average values for the whole period 2001-2004
Dairy farms (TF41) COP farms (TF13)
France Hungary France Hungary
Total output (thousand euros) - - 113.2 156.9
Milk produced (thousand litres) 258.5 1,380.4 - -
Other output (thousand euros) 33.5 339.1 - -
Utilised land (ha) 74.6 320.6 145.2 246.8
Labour (AWU) 1.78 18.8 1.57 3.91
Capital (thousand euros) 222.5 482.4 193.1 140.0
Intermediate consumption (thousand euros) 66.9 348.4 76.3 73.8
Number of livestock units 86.1 361.1 - -
Total subsidies received (thousand euros) 18.9 155.1 53.6 20.0
Total subsidies per total output produced - - 0.555 0.257
Total subsidies per milk output produced
(euros / litre) 0.078 0.095 - -
Number of observations per year 679 32 911 278
Regarding dairy farming, during the period studied, French farms were eligible to intervention prices for specific dairy products; for example, intervention price for butter was about 328 euros per ton in 2001. However, French dairy farms were subject to production quotas and
they could receive financial assistance for closing down their dairy activity, both measures being active since 1984 in an objective of reducing milk production in the EU. In Hungary the national support to milk production in 2001-2004 was mainly in the form of price support as an effort of agricultural policy to prevent milk production from falling further since the beginning of the transition (the production had decreased from 2,763 to 2,081 million litres between 1990 and 2000).
3. Results
3.1. Yearly technical efficiency
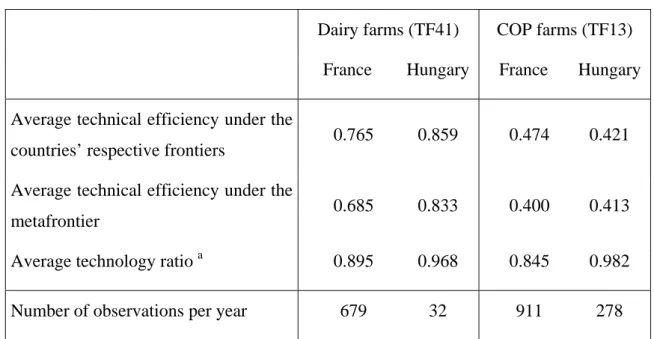
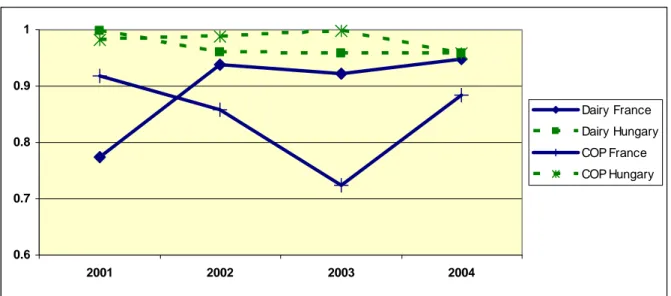
Table 2 presents the country averages of technical efficiencies calculated with regard to the countries’ respective frontiers and to the metafrontier, as well as the technology ratios. Figure 1 shows the evolution of yearly average technical efficiency for both countries calculated with regard the country’s own frontier for the dairy and COP samples. Figure 2 shows the evolution of the technology ratios for both countries for the dairy and COP samples.
Technical efficiency with respect to the countries’ own frontier
Regarding dairy farms, for the whole period 2001-2004 the average technical efficiency is lower for the French sample (0.765) than for the Hungarian sample (0.859) (Table 2). This suggests a larger heterogeneity of operational practices in the French dairy sample than in the Hungarian dairy sample. DEA results indicate that the majority of Hungarian dairy farms were operating under CRS (44 percent of the sample) indicating an optimal operational scale, while the French dairy sample was equally split between too small farms (45 percent under IRS) and too large farms (46 percent under DRS). As for COP farms, over the whole period the average technical efficiency is more similar for both countries than in the case of dairy farming, with a short superiority for French farms (0.474 for France and 0.421 for Hungary). This indicates that COP farms in both countries were very heterogeneous in terms of production practices. In both countries, the majority of farms were operating under IRS (50 percent of each country’s sample) suggesting a too small operational scale.
Table 2: Yearly technical efficiency under the countries’ respective frontiers and under the metafrontier, and technology ratios a: averages for the whole period 2001-2004
Dairy farms (TF41) COP farms (TF13)
France Hungary France Hungary
Average technical efficiency under the
countries’ respective frontiers 0.765 0.859 0.474 0.421
Average technical efficiency under the
metafrontier 0.685 0.833 0.400 0.413
Average technology ratio a 0.895 0.968 0.845 0.982
Number of observations per year 679 32 911 278
a
Technology ratio of farm i = technical efficiency score of farm i calculated under the metafrontier common to both countries / technical efficiency of farm i calculated under the respective country’s frontier.
Figure 1 reveals that, in the case of dairy farming, the average technical efficiency remained relatively stable in France during the first three years and then decreased slightly in 2004. In Hungary, the average score decreased sharply in 2003 and 2004. This suggests that there has been a worsening in the farming practices in this country at this period, may be due to the adjustment to the EU quality and environmental standards. Regarding the COP farms, Figure 1 shows that, while the average technical efficiency of the French sample remained approximately the same over the whole period, farms in the Hungarian sample became less efficient on average between 2002 and 2003, which may be due to strong drought. However, the COP Hungarian farms increased their average efficiency again in 2004, catching up with the French sample, showing a successful adaptation to the new environment of EU integration, what the dairy farms did not show.
Figure 1: Evolution of yearly technical efficiency calculated under the countries’ respective frontiers in 2001-2004 for dairy and COP farms
0.3 0.4 0.5 0.6 0.7 0.8 0.9 1 2001 2002 2003 2004 Dairy France Dairy Hungary COP France COP Hungary
Technical efficiency with respect to the metafrontier and technology ratios
As the interest is in the comparison of the performance of each country, the results using the metafrontier are not presented for the merged sample, but for each country only. Table 2 displays the average technical efficiency of the French sample and of the Hungarian sample respectively, calculated under the assumption of a common frontier across both countries. Results show that the superiority, in terms of technical efficiency average, of the Hungarian sample in the dairy sector remains when using the metafrontier (average technical efficiency of 0.833 for the Hungarian farms against 0.685 for the French farms). This suggests that more Hungarian dairy farms were closer to the efficient common frontier than French dairy farms. In the COP sector, while the technical efficiency average for the French sample was higher than the one for the Hungarian sample under each country’s frontier, the technical efficiency averages calculated under the metafrontier are similar between both countries, with a very slight superiority for Hungarian farms (0.413 against 0.400). This suggests that, if it is assumed that there is common technology between French and Hungarian farms, Hungarian farmers make a more efficient use of this technology in both the dairy and COP sectors.
Table 2 also gives the averages of the technology ratios, calculated as the ratios of efficiency scores under the metafrontier to scores under the respective frontiers. In both sectors the average technology ratios over the whole period are greater for Hungarian farms than for
French farms (0.968 against 0.895 for dairy farms; 0.982 against 0.845 for COP farms). This difference was tested to be significantly different from zero at 1 percent level. This suggests that Hungarian farms have on average a more productive technology than French farms. Hungarian farms’ technology dominates in both sectors. Figure 2, picturing the evolution of the technology ratios over the whole period, shows that the discrepancy between both countries is particularly strong in the year 2001 for dairy farms and in the year 2003 for COP farms.
Figure 2: Evolution of technology ratios a in 2001-2004 for dairy and COP farms
0.6 0.7 0.8 0.9 1 2001 2002 2003 2004 Dairy France Dairy Hungary COP France COP Hungary a
Technology ratio of farm i = technical efficiency score of farm i calculated under the metafrontier common to both countries / technical efficiency of farm i calculated under the respective country’s frontier.
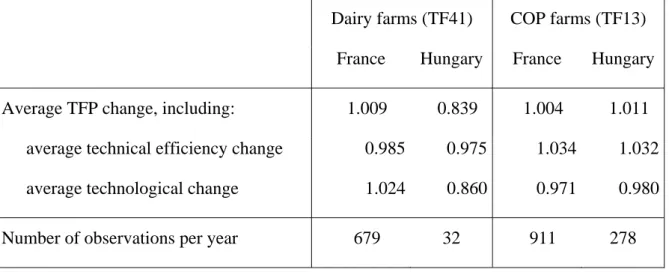
3.2. TFP, technical efficiency and technological changes
Table 3 shows the average indices of TFP change, technical efficiency change and technological change, over the whole period for each sample when using separate frontiers. Under the countries’ respective frontiers, results indicate that in the dairy sector French farms have experienced a TFP growth of 0.9 percent, while Hungarian farms have experienced a TFP decline of 16.1 percent, mainly due to a technological deterioration of 14 percent. French dairy farms, by contrast, had a technological progress of 2.4 percent. Both countries have experienced a deterioration of their average technical efficiency (-1.5 percent and -2.5 percent
the COP sector, where both samples had an increase in their technical efficiency of about 3 percent. This results in a TFP growth for both countries, of 0.4 percent for the French sample and 1.1 percent for the Hungarian sample, despite a technological deterioration (-2.9 percent for France, -2.0 percent for Hungary). The opposite patterns between technological change and efficiency change observed in general is intuitive, as a technological progress often results in a delay for some farmers to adopt the new technique or use it efficiently, while a technological regress makes it easier for farmers to catch up with the most performing (Brümmer et al., 2002; Latruffe et al., 2008a).
Table 3: TFP, technical efficiency and technological changes calculated under the countries’ respective frontiers: averages for the whole period 2001-2004
Dairy farms (TF41) COP farms (TF13)
France Hungary France Hungary
Average TFP change, including: 1.009 0.839 1.004 1.011
average technical efficiency change 0.985 0.975 1.034 1.032
average technological change 1.024 0.860 0.971 0.980
Number of observations per year 679 32 911 278
3.3. The role of subsidies
Table 4 shows the results of the regression on the technical efficiency scores calculated under the countries’ respective frontiers. Regarding dairy farms, the effect of the ratio of subsidy to milk output produced on technical efficiency for French farms is –0.849 (significance at 1 percent), while the effect for Hungarian farms is –0.849 + 0.407 = –0.442 (significance at 1 percent). This indicates that in both countries subsidies received by farms during the period 2001-2004 decreased their technical efficiency, and even more in France. The same conclusion can be drawn for the COP sector, where the effect of the total subsidies total output ratio on technical efficiency for French farms is –0.148, while it is –0.148 + 0.139 = – 0.009 for Hungarian farms (significance at 1 percent for both countries). Such a negative influence of subsidies on farms’ technical efficiency is in line with the theory and previous
studies. The stronger influence on French farms’ efficiency than on Hungarian farms’ efficiency may come from the larger support received by French farms (see Table 1).
As shown by Table 5, subsidies have a non-zero influence on the technology ratios for COP farms only. The effect for Hungarian COP farms is 0 (–0.029 + 0.029), while the influence for French COP farms is negative of –0.029 (significance at 1 percent). This may partly explain why French COP farms did not catch up with the best technology over the period studied and remained with lower technology ratios.
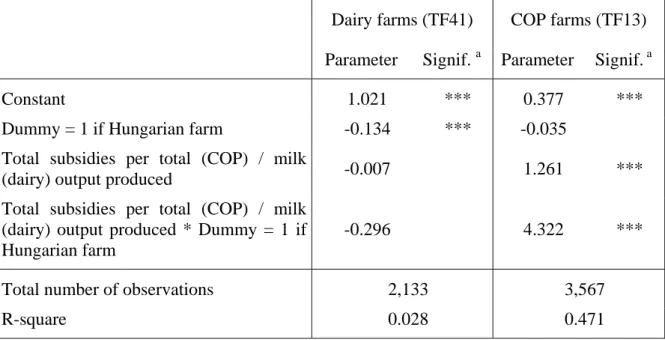
Finally, Table 6 displays the results of the regression on TFP change indices calculated under the countries’ respective frontiers. Subsidies have no effect on the dairy sample, whether in Hungary or in France. By contrast, in the COP sector, subsidies enable a TFP increase in France (+1.261), and even more in Hungary (1.261+4.322=5.583).
Table 4: Results of the regression on the technical efficiency calculated under the countries’ respective frontiers
Dairy farms (TF41) COP farms (TF13)
Parameter Signif. a Parameter Signif. a
Constant 0.831 *** 0.556 ***
Dummy = 1 if Hungarian farm 0.069 *** -0.132 *** Total subsidies per total (COP) / milk
(dairy) output produced -0.849 *** -0.148 *** Total subsidies per total (COP) / milk
(dairy) output produced * Dummy = 1 if Hungarian farm
0.407 *** 0.139 ***
Total number of observations 2,844 4,756
R-square 0.127 0.129
a
Table 5: Results of the regression on the technology ratios a
Dairy farms (TF41) COP farms (TF13)
Parameter Signif. b Parameter Signif. b
Constant 0.898 *** 0.861 ***
Dummy = 1 if Hungarian farm 0.083 *** 0.120 *** Total subsidies per total (COP) / milk
(dairy) output produced -0.032 -0.029 *** Total subsidies per total (COP) / milk
(dairy) output produced * Dummy = 1 if Hungarian farm
-0.091 0.029 ***
Total number of observations 2,844 4,756
R-square 0.019 0.238
a
Technology ratio of farm i = technical efficiency score of farm i calculated under the metafrontier common to both countries / technical efficiency of farm i calculated under the respective country’s frontier.
b
Significance at 1 percent (***), 5 percent (**) or 10 percent (*).
Table 6: Results of the regression on the TFP change calculated under the countries’ respective frontiers
Dairy farms (TF41) COP farms (TF13)
Parameter Signif. a Parameter Signif. a
Constant 1.021 *** 0.377 ***
Dummy = 1 if Hungarian farm -0.134 *** -0.035 Total subsidies per total (COP) / milk
(dairy) output produced -0.007 1.261 *** Total subsidies per total (COP) / milk
(dairy) output produced * Dummy = 1 if Hungarian farm
-0.296 4.322 ***
Total number of observations 2,133 3,567
R-square 0.028 0.471
a
4. Conclusions
The paper has investigated the performance of French and Hungarian farms and has compared their technology under a common technological frontier, in the dairy and COP sectors. The analysis was performed during the period 2001-2004, when Hungary was at the end of its transition period and preparing for EU accession, while French farms were not subject to major policy changes.
Results revealed that in both the dairy and the COP sectors, Hungarian farms were strong leaders in terms of technology (higher technology ratios) with a more productive technology, despite a technological deterioration (technological change indices less than 1). It could have been expected, by contrast, that Hungarian farms would lag far behind French farms, as they may not have had access to modern technology during the transition period, either because this technology was not available or because most farms were financially constrained. This suggests technological advantages for large-scale (Hungarian) over small-scale (French) farming in these two sectors. This would be particularly true in the dairy sector where descriptive statistics revealed a large size discrepancy between both countries. In the COP sector, the Hungarian technological superiority may be explained by the difference in policy support between both countries. French COP farmers received much more subsidies (per unit of output produced) than Hungarian COP farmers during the period studied, but these subsidies have a stronger negative impact on technical efficiency for French farms than for Hungarian farms, and a negative impact on the ability to lead the technology (i.e. on the technology ratios) only for French farms. Moreover, while subsidies were a positive factor of TFP growth in the COP sector in both countries, the effect was stronger for the Hungarian sample.
The increased labour mobility across the EU and the improved availability and diffusion of modern technology to Hungarian farmers may imply that the hypothetical common technology frontier between both countries that we investigated here, may become less hypothetical and more real in the future. In this context, if we expect that the more productive technology diffuses, that is to say the large-scale Hungarian-type technology, then French farms may find it difficult to keep up with the competition from Hungary: results indeed revealed that Hungarian farms were using better the hypothetical common technology (higher average technical efficiency under the metafrontier).
Hungary’s accession to the EU in 2004 and the application of the 2003 Luxemburg CAP reform in France could reinforce Hungary’s superiority. Hungarian farmers are now entitled to European subsidies in the form of the SAP. Although this support will be lower than what the French farmers will receive until 2013 (due to the phasing-in of CAP support in the New Member States), it is higher than pre-accession national support. As for the Luxemburg CAP reform, implemented in France for the first year in 2006, it further reduces price support and payments coupled to area and livestock, by introducing the Single Farm Payments (SFP). Intentions surveys have shown that, while French farmers did not plan to make any change in their farming strategies following the SFP introduction, farmers in the New Member States intended to use the SAP to increase even more their production scale (Douarin et al., 2007).
References
Bojnec, S., Latruffe, L. (2009). Determinants of technical efficiency of Slovenian farms.
Post-Communist Economies, 21(1): 117-124.
Brümmer, B., Glauben, T., Thijssen, G. (2002). Decomposition of productivity growth using distance functions: The case of dairy farms in three European countries. American Journal
of Agricultural Economics, 84(3): 628-644.
Caves, D., Christensen, L, Diewert, E. (1982). The economic theory of index numbers and the measurement of input, output, and productivity. Econometrica, 50(6): 1393-1414.
Charnes, A., Cooper, W., Rhodes, E. (1978). Measuring the efficiency of decision making units. European Journal of Operational Research, 2: 429-444.
Charnes, A., Cooper, W., Rhodes, E. (1981). Evaluating program and managerial efficiency: An application of Data Envelopment Analysis to Program Follow Through. Management
Science, 27(6): 668-697.
Coelli, T., Rao, D., O’Donnell, C., Battese, G. (2005). An introduction to efficiency and
productivity analysis. New York: Springer-Verlag. 2nd edition.
Davidova, S., Gorton, M., Ratinger, T., Zawalinska, K., Iraizoz, B., Kovacs, B., Mizo, T. (2002). An analysis of competitiveness at the farm level in the CEECs. European FP5 Project IDARA, Working Paper 2/11.
Douarin, E., Bailey, A., Davidova, S., Gorton, M., Latruffe, L. (2007). Structural, location
and human capital determinants of farmers’ Response to Decoupled Payments. European
FP6 Project IDEMA, Deliverable 14.
Eurostat. (2008). Agriculture and Fisheries Data. Luxemburg.
Färe, R., Grosskopf, S., Lindgren, B., Roos, P. (1992). Productivity changes in Swedish pharmacies 1980-1989: A non-parametric approach. Journal of Productivity Analysis 3(1-2): 85-101.
Fertö, I., Bakucs, L., Fogarasi, J. (2006). Investment and financial constraints in Hungarian
agriculture. Paper presented at the conference ‘Transition in Agriculture – Agricultural
Economics in Transition III’, Institute of Economics, Hungarian Academy of Sciences, Budapest, Hungary, 10-11 November.
Giannakas, K., Schoney, R., Tzouvelekas V. (2001). Technical efficiency, technological change and output growth of wheat farms in Saskatchewan. Canadian Journal of
Agricultural Economics, 49: 135-152.
Gorton, M., Davidova, S. (2004). Farm productivity and efficiency in the CEE applicant countries: A synthesis of results. Agricultural Economics, 30: 1-16.
Hughes, G. (2000). Agricultural decollectivisation in Central Europe and the productivity of
emergent farm structures. PhD Thesis, Wye College, University of London, UK.
Latruffe, L. (2005). The impact of credit market imperfections on farm investment in Poland.
Post-Communist Economies, 17(3): 349-362.
Latruffe, L., Davidova, S., Balcombe, K. (2008a). Productivity change in Polish agriculture: An application of a bootstrap procedure to Malmquist indices. Post-Communist
Economies, 20(4): 449-460.
Latruffe, L., Guyomard, H., Le Mouël, C. (2008b). Impact of CAP direct payments on French
farms’ managerial efficiency. Paper presented at the 12th European Association of
Agricultural Economists (EAAE) Congress, Gent, Belgium, 27-30 August.
Macours, K., Swinnen, J. (2000). Causes of output decline in economic transition: The case of Central and Eastern European agriculture. Journal of Comparative Economics, 28: 172-206.
Mathijs, E., Vranken, L. (2001). Human capital, gender and organisation in transition agriculture: Measuring and explaining technical efficiency of Bulgarian and Hungarian farms. Post-Communist Economies, 13(2): 171-187.
O’Donnell, C., Rao, D., Battese, G. (2008). Metafrontier frameworks for the study of firm-level efficiencies and technology ratios. Empirical Economics, 34(2): 231-255.
Oude Lansink, A., Pietola, K.., Bäckman, S. (2002). Efficiency and productivity of conventional and organic farms in Finland 1994-1997. European Review of Agricultural
Economics, 29(1): 51-65.
Petrick, M. (2004). Farm investment, credit rationing, and governmentally promoted credit access in Poland: A cross-sectional analysis. Food Policy, 29(3): 275-294.
Swinnen, J., Gow, H. (1999). Agricultural credit problems and policies during the transition to a market economy in Central and Eastern Europe. Food Policy, 24(1): 21-47.
Zhu, X., Demeter, R., Oude Lansink, A. (2008). Competitiveness of dairy farms in three
countries: The role of CAP subsidies. Paper presented at the 12th European Association of
Les Working Papers SMART – LERECO sont produits par l’UMR SMART et l’UR LERECO
• UMR SMART
L’Unité Mixte de Recherche (UMR 1302) Structures et Marchés Agricoles, Ressources
et Territoires comprend l’unité de recherche d’Economie et Sociologie Rurales de
l’INRA de Rennes et le département d’Economie Rurale et Gestion d’Agrocampus Ouest.
Adresse :
UMR SMART - INRA, 4 allée Bobierre, CS 61103, 35011 Rennes cedex
UMR SMART - Agrocampus, 65 rue de Saint Brieuc, CS 84215, 35042 Rennes cedex
http://www.rennes.inra.fr/smart
• LERECO
Unité de Recherche Laboratoire d’Etudes et de Recherches en Economie Adresse :
LERECO, INRA, Rue de la Géraudière, BP 71627 44316 Nantes Cedex 03
http://www.nantes.inra.fr/le_centre_inra_angers_nantes/inra_angers_nantes_le_site_de_nantes/les_unites/et udes_et_recherches_economiques_lereco
Liste complète des Working Papers SMART – LERECO :
http://www.rennes.inra.fr/smart/publications/working_papers
The Working Papers SMART – LERECO are produced by UMR SMART and UR LERECO
• UMR SMART
The « Mixed Unit of Research » (UMR1302) Structures and Markets in Agriculture,
Resources and Territories, is composed of the research unit of Rural Economics and
Sociology of INRA Rennes and of the Department of Rural Economics and Management of Agrocampus Ouest.
Address:
UMR SMART - INRA, 4 allée Bobierre, CS 61103, 35011 Rennes cedex, France
UMR SMART - Agrocampus, 65 rue de Saint Brieuc, CS 84215, 35042 Rennes cedex, France
http://www.rennes.inra.fr/smart_eng/
• LERECO
Research Unit Economic Studies and Research Lab Address:
LERECO, INRA, Rue de la Géraudière, BP 71627 44316 Nantes Cedex 03, France
http://www.nantes.inra.fr/nantes_eng/le_centre_inra_angers_nantes/inra_angers_nantes_le_site_de_nantes/l es_unites/etudes_et_recherches_economiques_lereco
Full list of the Working Papers SMART – LERECO:
http://www.rennes.inra.fr/smart_eng/publications/working_papers
Contact
Working Papers SMART – LERECO
INRA, UMR SMART
4 allée Adolphe Bobierre, CS 61103 35011 Rennes cedex, France
2009
Working Papers SMART – LERECO
UMR INRA-Agrocampus Ouest SMART (Structures et Marchés Agricoles, Ressources et Territoires) UR INRA LERECO (Laboratoires d’Etudes et de Recherches Economiques)