PROJECTING THE LITERACY SKILLS PROFICIENCY OF THE WORKING-AGE POPULATION IN A CONTEXT OF HIGH IMMIGRATION AND INCREASING EDUCATION LEVELS
Samuel Vézina, Alain Bélanger, Patrick Sabourin, and Guillaume Marois
www.ucs.inrs.ca
Institut national de la recherche scientifique Centre - Urbanisation Culture Société
Montréal
May 2018 PROJECTING THE LITERACY SKILLS PROFICIENCY OF THE WORKING-AGE POPULATION IN A CONTEXT OF HIGH IMMIGRATION AND INCREASING EDUCATION LEVELS
Samuel Vézina, Alain Bélanger, Patrick Sabourin, and Guillaume Marois
This research was supported by the Social Sciences and Humanities Research Council of Canada (SSHRC).
The literacy proficiency projection parameters were derived using confidential data at the Quebec Inter-University Center for Social Statistics (QICSS), a member of the Canadian Research Data Center Network.
The microsimulation model used in this research was created by the Laboratoire de simulations démographiques (LSD) located at the Institut national de recherche scientifique (INRS) in Montreal, Canada. This model was designed using Modgen, a programming language developed and maintained by Statistics Canada. Modgen and its documentation can be downloaded for free from the agency’s website at http://www.statcan.gc.ca/eng/microsimulation/modgen/modgen.
Samuel Vézina
Institut national de la recherche scientifique (INRS) samuel.vezina@ucs.inrs.ca
Alain Bélanger
Institut national de la recherche scientifique (INRS)
International Institute for Applied Systems Analysis (IIASA) alain.belanger@ucs.inrs.ca
belanger@iiasa.ac.at
Patrick Sabourin
International Institute for Applied Systems Analysis (IIASA) sabourin@iiasa.ac.at
Guillaume Marois
International Institute for Applied Systems Analysis (IIASA) marois@iiasa.ac.at
Centre - Urbanisation Culture Société Institut national de la recherche scientifique 385, rue Sherbrooke Est
Montréal (Québec) H2X 1E3 Téléphone : (514) 499-4000 Télécopieur : (514) 499-4065 www.ucs.inrs.ca
This document can be downloaded without cost at: http://www.ucs.inrs.ca/ucs/publications/collections/
Résumé
Traditionnellement, les études empiriques tentant de mesurer l’impact du capital humain sur la réussite économique des individus utilisent le niveau d’éducation comme variable d’approximation du capital humain. Alors que le lien entre compétences et niveau d’éducation est assez clair chez les individus nés au pays, la corrélation n’est pas aussi directe chez les immigrants. Le niveau de compétences de base en traitement de l’information (niveau de littératie) est une nouvelle mesure qui semble plus adaptée. Elle est développée par l’Organisation de Coopération et de Développement Économiques (OCDE) par le truchement de son Programme pour l’évaluation internationale des compétences des adultes (PEICA).
Cet article présente des résultats de projection de la population canadienne selon le niveau de littératie. Les déterminants du niveau de littératie sont analysés séparément pour la population née au pays et pour les immigrants en utilisant les données de l’enquête PEICA de 2012. Les paramètres de l’analyse multivariée servent d’intrants à un module de projection du niveau de littératie de la population qui est intégré à LSD-C, un modèle de microsimulation capable de projeter la population canadienne selon plusieurs variables démographiques, ethnoculturelles et socioéconomiques entre 2011 et 2061.
Les résultats de projections montrent que le niveau moyen de littératie devrait décliner légèrement au cours des 50 prochaines années puisque l’effet positif de l’augmentation du niveau d’éducation de la population sera contrebalancé par l’effet négatif du fort niveau d’immigration. Les résultats suggèrent également que des changements à la politique de sélection des immigrants pourrait prévenir le déclin projeté du niveau de littératie de la population canadienne en âge de travailler. Cette recherche constitue un outil analytique permettant de tester l’impact de diverses politiques de sélection et d’intégration des immigrants sur l’évolution projetée du niveau de compétence en littératie.
Mots-clés : Compétences en littératie; Population en âge de travailler; Projections par
microsimulation; Canada; Immigration.
Abstract
Labour economists and other experts have been using standard educational attainment variables to assess the workforce’s human capital. While the link between skills and education level seems straightforward among the native-born population, the correlation is a lot more blurred among the foreign-born population. A more direct measure of skills, precisely the proficiency in key information-processing skills, was developed by the Organisation for Economic Cooperation and Development (OECD) and its Programme for the International Assessment of Adult Competencies (PIAAC).
With a specific focus on Canada, this paper presents literacy skills proficiency projection results. Using the 2012 PIAAC survey data, skills proficiency determinants of the working-age population are analysed for both native- and foreign-born subgroups. Regression parameters serve as parameters for a skills proficiency projection module that is added to LSD-C, a microsimulation model that simultaneously projects demographic, ethnocultural and socioeconomic characteristics of the Canadian population between 2011 and 2061.
Projection results show that the literacy skills proficiency is likely to be slightly declining over the next 50 years as the positive effect of increasing education is mitigated by the effect of large immigration intakes. Results also suggest that changes to immigrant selection policies could prevent the projected literacy skills decline of the Canadian working-age population.
This research provides an analytical tool in simulating the effects of different immigrants’ selection patterns or language training policies on the skills of the future labour force population.
Key Words: Literacy skills; Working-age population; Microsimulation projections; Canada;
Introduction
Human capital can be defined as the knowledge, skills, competencies and other attributes
embodied in individuals that facilitate the creation of personal, social and economic well-being1.
The recent socio-economic changes have given these skills and knowledge a crucial role in ensuring both individual and societal well-being. This well-being of often assessed and measured in terms of economic returns, the impacts of increasing human capital (through learning and education levels for example) are also significant in terms of personal well-being and social cohesion2,3,4.
Traditionally, studies on human capital have made a central place to education and experience indicators. In the recent book “World Population and Human Capital in the 21st
Century”, experts illustrate with projections scenarios the importance of education in the world’s
demographic dynamic. It particularly shows how increasing women’s education level could significantly help to achieve the Millennium development goals. As for the most developed countries, it shows how rising human capital (again measured in terms of education level) can impact on population ageing consequences, in terms of labour force population, public pensions
and other health and social expenditures5.
Labour economists and other experts have mostly been using standard educational attainment variables to assess the workforce’s human capital. A more direct measure of skills, precisely the proficiency in key information-processing skills, was developed by the Organisation for Economic Cooperation and Development (OECD) and its Programme for the International Assessment of Adult Competencies (PIAAC). Even though it is not a perfect assessment of all
human capital, skills, knowledge and other attributes6, this measure provides interesting insights
on the human capital of the working-age population. It seems to better capture one’s skills that are readily usable or rewarded on the labour market than the standard measures of educational
attainment7,8. Furthermore, these basic information-processing skills are crucial in the subsequent
development of more complex communication and reasoning skills, which are increasingly valued
in today's and tomorrow's job market9,10.
Interestingly, the OECD measure of key information-processing skills is better suited (than traditional measures) for studies on human capital in the context of increasing ethnic diversity
among the developed countries11,12. Indeed, in most OECD countries, foreign-born individuals
have lower literacy skill level despite an overall higher education level than the native-born13. In
other words, the mean years of schooling or the highest level of education attained are imperfect indicators of the basic literacy skills required on the specific labour market of the host country. This gap has numerous explanations, one of them being the language skills differential that exists between the foreign- and the native-born. Of course, one’s skill set is not limited to this skills proficiency measure. Nonetheless, the use of this measure is relevant as it better captures the
In a nutshell, it becomes important to better understand the factors linked with literacy skills proficiency. On a longitudinal point of view, it is also pertinent to better grasp the mechanisms at work in the generation, maintenance and depletion of these skills over the life course. Such information constitutes interesting policy-relevant matter with respect to immigration, social cohesion, labour market needs and changes, as well as education skills formation needs.
Research objectives
With a specific focus on Canada, this research analyses the skills proficiency determinants
of the working-age populationi. Then, this research presents the content of a skills proficiency
projection module that is added to LSD-C, a microsimulation model that simultaneously projects demographic, ethnocultural and socioeconomic characteristics of the Canadian population. The literacy skills proficiency projections results assess the impact of the socio-demographic changes on the overall skills proficiency of the future Canadian population between 2011 and 2061.
Theoretical framework
In conjunction with Demographic Metabolism15, which predicts aggregate-level change
from changes in successive cohorts, the theoretical basis of this research encompasses multiple micro-level theories (Human Capital and New Home Economics, Social Capital, Life Course, Practise Engagement Theory, etc.) on which the different simulated individual transitions are modeled. The specific theoretical framework undergirding the literacy skills analysis is derived
from approaches developed by Desjardins16 and Barone & van de Werfhorst17. They assert causal
relationships between schooling, skills, and economic and social outcomes, which have been
largely studied in the scientific literature17,18,19,20,21. Education is considered to be the main driver
of the skills’ formation13,22 which also triggers the skill development process and maintenance over
the life course23. Our framework recognises the functional definition of the Human Capital theory24
of the schooling pathway on productivity while asserting the influence of the social structure and learning context during childhood (cultural and social capital) on the schooling pathway and
economic outcomes25,26,27,28,29. Notwithstanding the schooling pathway, we recognise the
importance of the learning context during childhood on cognitive skills acquisition and
maintenance during adulthood30. Finally, the practise engagement theory31 asserts that observed
skill level is a function of the use of skills (incidence, frequency, complexity) on a daily basis in the everyday life. The analysis of the literacy skills proficiency determinants is framed on this concept that practise of reading skills at home and at work are pertinent dimensions to consider.
Data and methodology
The analysis of the literacy skills proficiency determinants is based on the 2012 PIAAC survey data for Canada. The target population consists of Canadian adults aged 16 to 65 not residing in institutions or on Aboriginal reserves. It also excludes families of members of the Armed Forces living on military bases as well as residents of some sparsely populated areas. Due
to the specific focus of this paper on the working-age population and on the impact of immigration on skills, analyses were conducted on the respondents aged between 25 and 64 years old residing in the ten provinces of Canada (residents of the three northern territories are omitted). This sub-sample of 19,595 cases is composed of 16,132 native-born and 3,463 foreign-born Canadians, and is representative of the 18.3 million Canadians aged between 25 and 64 years old at the time of the survey.
The 2012 PIAAC survey assessed three different types of skills: literacy, numeracy, and problem solving in technology-rich environments. This study focuses on literacy skills only, which are defined by the skills needed to understand and use various kinds of information from texts in
various formats32.
Due to concerns for respondent burden, the PIAAC methodologists used item response
theoryii and imputation methods, which resulted into ten “plausible values” for literacy proficiency
scores. Consequently, the score obtained (proficiency) by the respondent is not determined by a specific value, but rather by this series of “plausible values”. In order to obtain robust and unbiased
estimates, analyses must involve a statistical treatment specific to this type of survey design33. The
statistical procedures required to adequately handle the plausible values and the 80 jackknife
replicate weights are provided on the OECD website34. We use the “repest” procedure developed
for STATA® software by OECD experts and by Statistics Canada35.
In the PIAAC survey, literacy proficiency is measured along a continuous scale ranging from 0 to 500, where a higher score indicates greater proficiency. The series of tasks used for assessing literacy range from reading a product label to locate a single piece of information to reading newspaper article and distilling information. To help interpret the scores, the scale is divided into proficiency levels. At each level, individual can successfully complete certain type of tasks. For example, the first two levels require the respondent to read and understand relatively short text, whereas the level 4 and 5 require multi-step operation to integrate, synthesize and
interpret information32.
Linear regression analyses are conducted to identify the literacy skills proficiency determinants. Analyses are stratified by immigration status to consider variables specific to the foreign-born population, such as age at immigration, country of birth, etc. Based on the literature on both economics and socio-demographic fields and on our theoretical framework, the most pertinent independent variables are of four types:
1. Socio-demographic variables (age, sex, province, and area of residenceiii),
2. Human capital variables (education level, mother tongue, language spoken at home),
ii This methodology is widely used in educational testing, and is also used in other OECD surveys namely those from
the Programme for International Student Assessment (PISA).
iii We used here the standard threshold used by Statistics Canada to distinguish rural and urban areas. An urban area
3. Socio-economic variables and life-wide factors (mother’s education leveliv, literacy
skills use at home, at work (labour force status) and in the everyday lifev), and
4. the variables linked with characteristics that are specific to the immigrants, such as age at immigration, years in host country since migration, immigration category,
country of birth, and country of highest diplomavi.
While regression parameters can inform on the literacy proficiency determinants in terms of strength and significance, the global demographic impact of a specific factor cannot be asserted from regression parameters alone. These factors need to be weighted by the prevalence of each significant characteristic in the population, which evolve through time. To assess the global impact of socio-demographic changes on the literacy skills of the future working-age population, it is necessary to consider both the strength of each determinant and the prevalence of it in the population. Therefore, from these analyses, we estimate the projection parameters needed for the literacy skills proficiency projection module which is integrated into LSD-C, a microsimulation projection model for Canada.
Microsimulation model
LSD-C is a microsimulation model that projects the Canadian population by several
dimensions, namely age, sex, immigration status, country of birth, education status, language, religion, labour force participation, and others. The model has been developed by the authors at the Institut national de la recherche scientifique (INRS) in Montreal, Canada. LSD-C is case-based in the sense that every individual is simulated separately from other individuals and that no interactions between individuals are allowed (except for interactions between mother and children). The model is also dynamic and in continuous time, meaning that characteristics of individuals are modified continuously in “real time”.
LSD-C allows for changes in individual characteristics over the life course as well as for
intergenerational transfers of some characteristics of the mother to the child born. Individuals from
the base population (representative sample of the 2011 populationvii) are simulated one by one and
their characteristics are modified through scheduled events whose timing are determined by the values of their specific input parameters at any given time during the projection period. For example, interregional mobility varies with age, sex, language knowledge and use at home, religion, visible minority status, immigration status, education, and labour force participation. All events are thus highly interdependent.
iv The mother’s education level here is also a measure of social and cultural capital.
v Intensity of reading books at home and of writing letters, memos or emails at work were used.
vi The country of birth and country of highest diploma have similar categories. The richest countries of the world are
grouped together; it corresponds to Western European countries, North American countries as well as Australia, Japan, New Zealand, Singapore, and South Korea.
vii LSD-C’s point of departure is 2011 and its starting population is based on the 2011 National Household Survey
LSD-C is open to international migration which is a crucial component of population change
in Canada. It is also an important driving factor in the transformation of the human capital stock. All parameters (mortality, fertility, immigration, emigration) are set according to Statistics
Canada’s most recent population projections36. The immigration rate is set to 0.75%, which
corresponds to the average annual rate observed over the last 25 years and translates into approximately 250,000 immigrants per year at the beginning of the projection, and to 406,000 immigrants per year at the end in 2061. This immigration rate is the highest – by far – among the
G7 countries37.
As for education, parameters are derived from a variety of sources (2011 National Household Survey and the 2013 Canadian National Graduates Survey) and methods. The parameters’ estimation (age at which diploma is obtained, highest level of education attained, and schooling pathway) is stratified by sex and province of residence, and takes into account numerous other dimensions such as ethnicity, language and immigration status. Most importantly, it includes a cohort effect dimension, which assumes some future expansion of education in continuity with
the recent past trends38,39 (See appendix for more details on the education parameters’ estimation).
Highest educational attainment is taken directly from the base population file for foreign-born Canadians 25 years and older and native-born Canadians 30 years and older. Immigrants aged less than 25 and native-born aged less than 30 years old are assumed to have an incomplete education and are thus reassigned a new educational pathway based on the results of parameters described above and distributions of age at graduation.
Literacy skills proficiency projection module
A literacy skills projection module is added to LSD-C. As mentioned earlier, parameters are assessed using the 2012 PIAAC survey data. These parameters are derived from simplified regression models, which strictly contain the variables that are projected in the microsimulation model. For example, the life-wide factors such as the use of skills in everyday life are excluded from the simplified regression models. The impacts of this simplified model specifications are measured and discussed below. More precisely, this projection module parameters are derived
from linear regressions on logviii scores with the following regressors: sex, age, region of residence,
education level, language, labour force participation status, age at immigration, years since migration, country of birth, and country of highest diploma. Regressions are stratified by immigration status.
During the simulation, only the population aged 25 to 64 may be assigned a literacy score. Literacy scores are updated whenever relevant actor’s characteristics undergo changes. Since literacy and labour force participation share many determinants and are both derived variables,
viii A simple logarithmic transformation is made on the dependant variable (literacy score) in order to obtain regression
coefficients that can be interpreted as showing the percentage effect of a unit change on the average score. The logarithmic transformation also ensures that the linear regression model will not lead to illogical predicted scores (below 0 or above 500) during the simulation.
labour force participation status takes precedence when both states are scheduled to be updated at the same time. This is necessary as labour force participation is a determinant of literacy.
The projection of the literacy proficiency is deterministic; the same literacy score is attributed to all simulated individuals who have the same characteristics of age, sex, education, labour force status, etc. This does not preserve the variation of proficiency observed in the PIAAC data among people with similar characteristics, but it fully captures the impact of the socio-demographic changes on the overall skills of the population.
Projection scenarios are established according to specific sets of assumptions on both the general level of each phenomenon and the characteristic-specific differentials between individuals at risk of experiencing the event. For example, the model allows for changes of total fertility level over time and of fertility differentials linked with certain characteristics such as education level or immigration status for example. Moreover, to answer the research questions of this study, it is relevant to create scenarios where the size and the characteristics of the future cohorts of immigrants evolve and vary over time differently than in the reference scenario. Similarly, scenarios with respect to education assume different educational attainment of future cohorts of young adults Canadians.
Results
Factors linked with skills proficiency
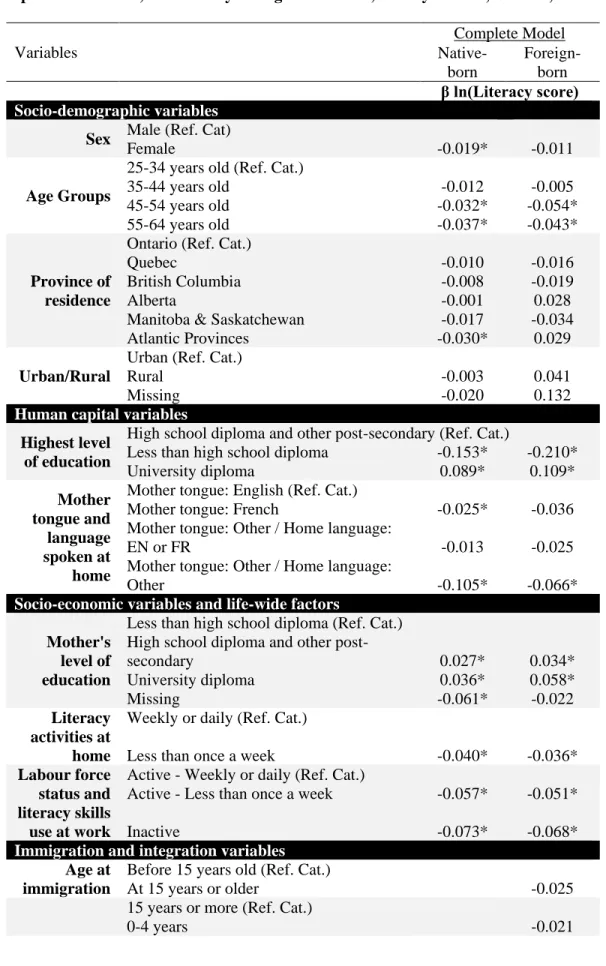
Table 1 presents the regression coefficients of the complete model, i.e. which contains all pertinent independent variables. The PIAAC data regression analyses show that human capital variables – education above all – are by far the main drivers of literacy skills. This relationship is stronger for immigrants than for the native-born. In fact, the skills of immigrants with a high level of education are more than 30% higher on average than immigrants with a low level of education compare to 24% for native-born. At a lesser extent, the language spoken at home is also a significant predictor of literacy proficiency. Compared to individuals having English as his/her mother tongue (referred here as Anglophones), the skills of Canadians whose mother tongue and language spoken at home is neither French or English are reduced by 10.5% among native-born (mainly Aboriginal persons) and 6.6% among foreign-born.
Table 1. Complete model – Estimated coefficients from linear regressions with log of literacy score as the dependent variable, stratified by immigration status, 25-64 years old, Canada, PIAAC 2012
Variables Complete Model Native-born Foreign-born β ln(Literacy score) Socio-demographic variables
Sex Male (Ref. Cat)
Female -0.019* -0.011
Age Groups
25-34 years old (Ref. Cat.)
35-44 years old -0.012 -0.005
45-54 years old -0.032* -0.054*
55-64 years old -0.037* -0.043*
Province of residence
Ontario (Ref. Cat.)
Quebec -0.010 -0.016
British Columbia -0.008 -0.019
Alberta -0.001 0.028
Manitoba & Saskatchewan -0.017 -0.034
Atlantic Provinces -0.030* 0.029
Urban/Rural
Urban (Ref. Cat.)
Rural -0.003 0.041
Missing -0.020 0.132
Human capital variables Highest level
of education
High school diploma and other post-secondary (Ref. Cat.)
Less than high school diploma -0.153* -0.210*
University diploma 0.089* 0.109* Mother tongue and language spoken at home
Mother tongue: English (Ref. Cat.)
Mother tongue: French -0.025* -0.036
Mother tongue: Other / Home language:
EN or FR -0.013 -0.025
Mother tongue: Other / Home language:
Other -0.105* -0.066*
Socio-economic variables and life-wide factors Mother's
level of education
Less than high school diploma (Ref. Cat.) High school diploma and other
post-secondary 0.027* 0.034* University diploma 0.036* 0.058* Missing -0.061* -0.022 Literacy activities at home
Weekly or daily (Ref. Cat.)
Less than once a week -0.040* -0.036*
Labour force status and literacy skills use at work
Active - Weekly or daily (Ref. Cat.)
Active - Less than once a week -0.057* -0.051*
Inactive -0.073* -0.068*
Immigration and integration variables Age at
immigration
Before 15 years old (Ref. Cat.)
At 15 years or older -0.025
15 years or more (Ref. Cat.)
Length of stay in Canada 5-9 years -0.016 10-14 years -0.025 Immigration category
Points-based system (Ref. Cat.)
Sponsored Family -0.045* Resettled Refugee -0.064* Other Immigration 0.004 Missing 0.020 Country of birth
Rich country (Ref. Cat.)
Poor country -0.033
Missing 0.007
Country of highest diploma
Canada (Ref. Cat.)
Rich country -0.032 Poor country -0.063* Missing -0.131* Constant 5.698* 5.708* Sample size (n) 16,132 3,463 Adjusted R² 0.339 0.385
Note: * Coefficient significant at 5% significance level.
Results also show that literacy skills proficiency declines with age. Compared to the 25-34 years old, the score of older individuals (aged 55-64 years old) is 3.7% lower among native-born and 4.3% among foreign-born. Females seem to achieve lower score than males, but this gender difference is significant among the native-born population only (1.9%). The coefficients indicate that there are no statistically significant differences in literacy proficiency between the provinces and between urban and rural areas.
The life-wide factors (use of literacy skills in everyday life) are statistically significantly different from zero at the 5% level. This result suggests that literacy skills seem to have the “use it or lose it” dimension put forward in the practise engagement theory. As for mother’s education variable, regressions coefficients show significant impacts on literacy score of similar strength for both foreign- and native-born Canadians.
Finally, some of the immigrants’ characteristics, namely immigration category and country of diploma, are also significant predictors of the literacy skills proficiency. Results show that sponsored family immigrants as well as refugees have lower literacy proficiency (4.5% and 6.4%, respectively) than economically-selected immigrants (through the Canadian points-based selection system). Other things being equal, skills of immigrants with a Canadian diploma are 6.3% higher on average than immigrants with completed highest level of education in a poor country. It is interesting to note that neither age at immigration nor length of stay in Canada nor country of birth are statistically significant variables to explain literacy scores of immigrants once the model control for the other immigration variables, namely country of highest diploma and immigration category.
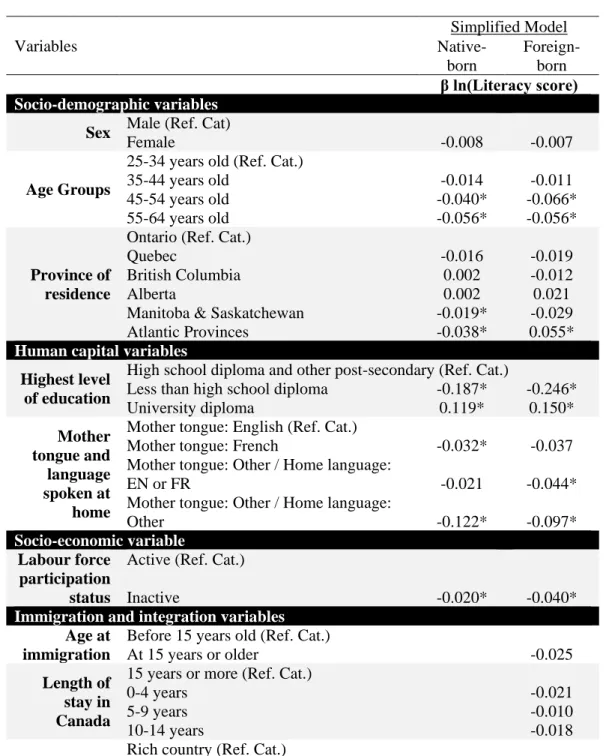
Table 2 contains the regression coefficients of the simplified regression models. They constitute the parameters used in the microsimulation model to derive the literacy skills proficiency. Even though this simplified model does not include all significant variables of the complete model, notably the social capital variable and the life-wide factors, the predictive power of the model is not substantially affected. In fact, the adjusted R² is four to five points lower for the native- and the foreign-born, respectively.
Table 2. Simplified model – Estimated coefficients from linear regressions with log of literacy score as the dependent variable, stratified by immigration status, 25-64 years old, Canada, PIAAC 2012
Variables Simplified Model Native-born Foreign-born β ln(Literacy score) Socio-demographic variables
Sex Male (Ref. Cat)
Female -0.008 -0.007
Age Groups
25-34 years old (Ref. Cat.)
35-44 years old -0.014 -0.011
45-54 years old -0.040* -0.066*
55-64 years old -0.056* -0.056*
Province of residence
Ontario (Ref. Cat.)
Quebec -0.016 -0.019
British Columbia 0.002 -0.012
Alberta 0.002 0.021
Manitoba & Saskatchewan -0.019* -0.029
Atlantic Provinces -0.038* 0.055*
Human capital variables Highest level
of education
High school diploma and other post-secondary (Ref. Cat.)
Less than high school diploma -0.187* -0.246*
University diploma 0.119* 0.150* Mother tongue and language spoken at home
Mother tongue: English (Ref. Cat.)
Mother tongue: French -0.032* -0.037
Mother tongue: Other / Home language:
EN or FR -0.021 -0.044*
Mother tongue: Other / Home language:
Other -0.122* -0.097*
Socio-economic variable Labour force
participation status
Active (Ref. Cat.)
Inactive -0.020* -0.040*
Immigration and integration variables Age at
immigration
Before 15 years old (Ref. Cat.)
At 15 years or older -0.025
Length of stay in Canada
15 years or more (Ref. Cat.)
0-4 years -0.021
5-9 years -0.010
10-14 years -0.018
Country of
birth Poor country or Missing -0.065*
Country of highest diploma
Canada (Ref. Cat.)
Elsewhere or Missing -0.062*
Constant 5.668* 5.703*
Sample size (n) 16,132 3,463
Adjusted R² 0.291 0.345
Note: * Coefficient significant at 5% significance level.
More importantly, coefficients’ value and significance level of the simplified models (Table 2) are
quite close to those of the complete models (Table 1). In a nutshell, education stands as the main driver of literacy skills (with a stronger effect for immigrants). The linguistic variable continues to be a significant predictor of the proficiency. In fact, it has a stronger effect as it captures a part of the effect of the omitted variables. The age effect remains significant, the gender difference is small and not significant, and the spatial differences are once again mostly marginal. Results also show that the labour market activity status is correlated with literacy proficiency scores; skills of inactive immigrants are 4.0% lower on average than their active counterparts. Among the native-born Canadians, this proportion is of 2.0%. Finally, among the immigration and integration variables, both the age at immigration and the length of stay in Canada remain not significant dimensions. In the simplified model, the country of birth becomes significant as it probably captures some of the effect of immigration category (omitted variable). The positive impact of having a Canadian diploma on one’s skills proficiency is significant and of similar strength to what is observed in the complete model.
Additional analyses (results not shown here) investigated education-related effects. Regression results stratified by education level did not reveal significant variation across education groups. Since, the sample size among the strata was low – especially among the least educated sub-group of immigrants – these regression results were not robust enough to be inserted in the microsimulation model.
Microsimulation projection results
According to the reference scenario, the microsimulation model forecasts that the Canadian population will increase from 34.3 million in 2011 to 49.3 million in 2061. That represents a population increase of 15.0 million in the next 50 years, mainly driven by the migratory increase. These results are in phase with the medium-growth (M1) scenario of the most recent official
projections produced by Statistics Canada36. In short, this population growth will be mainly fueled
by international immigration, as it has always been the case since the 1990s. Also, the demographic ageing process will keep on going, and the proportion of seniors and the median age of the population are likely to increase in the coming decades.
Projected socio-demographic changes in Canada 2011-2061
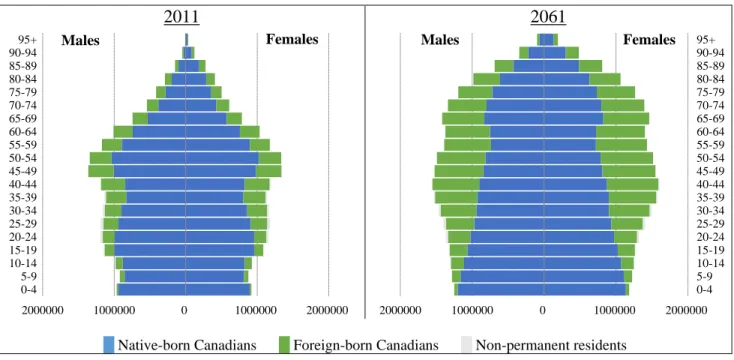
The microsimulation model simultaneously projects numerous characteristics of the Canadian population. We focus specifically on two of them: immigration status and education level. The next two figures present the Canadian population pyramid as observed in 2011 and as projected by LSD-C (reference scenario) in 2061.
Figure 1 gives an idea of the extent at which the Canadian population growth will be mainly driven by the migratory component. The share of foreign-born Canadians is likely to increase in the coming decades, especially among the working-age population.
Figure 1. Population observed (2011) and projected (2061), by age, sex and immigration status, Canada
2011 2061
█ Native-born Canadians █ Foreign-born Canadians █ Non-permanent residents
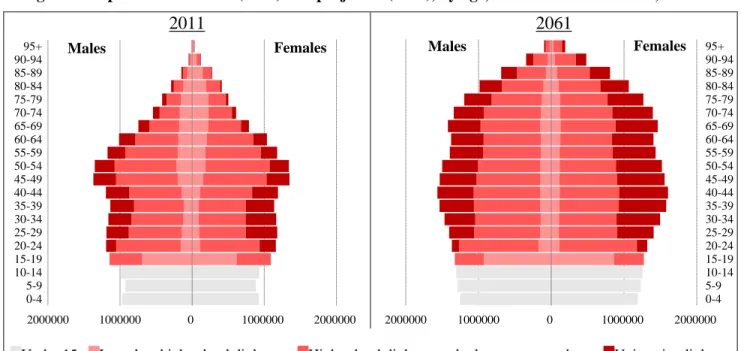
The average level of education is also going to increase (Figure 2). The share of low-educated Canadians is likely to decrease. The main change concerns the number of people with a university degree. Indeed, the global age structure of the Canadian population projected by the reference scenario (right-sided pyramid in Figure 2 shows an increased proportion of university graduates among the population over the age of 25 years old.
2000000 1000000 0 1000000 2000000 0-4 5-9 10-14 15-19 20-24 25-29 30-34 35-39 40-44 45-49 50-54 55-59 60-64 65-69 70-74 75-79 80-84 85-89 90-94 95+ Males Females 2000000 1000000 0 1000000 2000000 0-4 5-9 10-14 15-19 20-24 25-29 30-34 35-39 40-44 45-49 50-54 55-59 60-64 65-69 70-74 75-79 80-84 85-89 90-94 95+ Males Females
Figure 2. Population observed (2011) and projected (2061), by age, sex and education level, Canada
2011 2061
█Under 15 █Less than high school diploma █High school diploma and other post-secondary █University diploma
The socio-demographic changes that are projected among the working-age population go in
the same direction (Figure 3). More precisely, according to the reference scenario, the proportion
of foreign-born Canadians among the working-age population would increase from 25% in 2011 to 43% in 2061. As for education, the proportion of university graduates would grow from 26% in 2011 to 36% in 2061.
Figure 3. Population aged between 25 and 64 years old in absolute and relative (%) values, observed (2011) and projected (2021-2061), by immigration status (left) and by education level
(right), Canada
disaggregated by immigration status Disaggregated by education level
█ Foreign-born Canadians █ Native-born Canadians
█University diploma
█Highschool diploma and other post-secondary █Less than high school diploma
2000000 1000000 0 1000000 2000000 0-4 5-9 10-14 15-19 20-24 25-29 30-34 35-39 40-44 45-49 50-54 55-59 60-64 65-69 70-74 75-79 80-84 85-89 90-94 95+ Males Females 2000000 1000000 0 1000000 2000000 0-4 5-9 10-14 15-19 20-24 25-29 30-34 35-39 40-44 45-49 50-54 55-59 60-64 65-69 70-74 75-79 80-84 85-89 90-94 95+ Males Females 75% 71% 66% 63% 60% 57% 25% 29% 34% 37% 40% 43% 0 5 10 15 20 25 2011 2021 2031 2041 2051 2061 Mill io n 13% 10% 9% 9% 9% 9% 62% 61% 58% 57% 56% 56% 26% 29% 33% 34% 35% 36% 0 5 10 15 20 25 2011 2021 2031 2041 2051 2061 Mill io n
Projected overall literacy proficiency
The central question is how the Canadian working-age population’s overall skills proficiency could be affected by these two types of socio-demographic changes? The model allows
for scenario building in order to investigate potential impacts of these changes. Table 3 sums up
the underlying hypotheses of the different scenarios designed with respect to immigration and education changes.
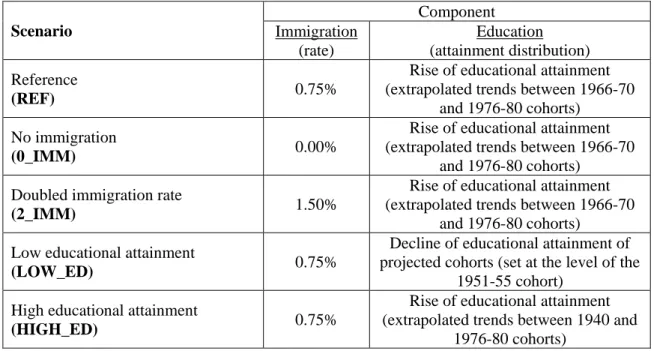
As mentioned in the methodology section, the reference scenario sets the immigration rate at 0.75%, similarly to the official Statistics Canada demographic projections. This immigration rate translates into an annual intake of 252,000 immigrants in 2011, which increases to more than 400,000 in 2061. As for education, the reference scenario takes into account the most recent trends and extrapolates the improving education level of cohorts. The extrapolation is made on attainment distribution trends between the 1966-70 and the 1976-80 cohorts (See appendix for more details).
Table 3. Summary of projection scenario assumptions on future immigration rate and future educational attainment of cohorts
Scenario Component Immigration (rate) Education (attainment distribution) Reference (REF) 0.75%
Rise of educational attainment (extrapolated trends between 1966-70
and 1976-80 cohorts) No immigration
(0_IMM) 0.00%
Rise of educational attainment (extrapolated trends between 1966-70
and 1976-80 cohorts) Doubled immigration rate
(2_IMM) 1.50%
Rise of educational attainment (extrapolated trends between 1966-70
and 1976-80 cohorts) Low educational attainment
(LOW_ED) 0.75%
Decline of educational attainment of projected cohorts (set at the level of the
1951-55 cohort) High educational attainment
(HIGH_ED) 0.75%
Rise of educational attainment (extrapolated trends between 1940 and
1976-80 cohorts)
The other projection scenarios are not designed to be interpreted as predictions about what will happen in the future. They serve instead as exercises designed to investigate the extent at which the changes in immigration rates and educational attainment can impact on the projected literacy level. Two scenarios are designed with respect to immigration impacts. In the first one (0_IMM), immigration rates are set to zero, and in the second one (2_IMM), immigration rates are set at 1.5%. These scenarios are highly unrealistic but they can help measure the range of influence the migratory component can have on the projected literacy level. Two additional scenarios are designed with respect to education. In the low education scenario, the education module
parameters are modified in order to assign to the projected young adults the educational attainment of baby boomers (those born in 1951-55). The educational attainment of these cohorts is significantly lower than succeeding cohorts born in the 1960’s, the1970’s, and on. On the opposite, the high education scenario intensifies the observed improving trends in terms of educational attainment of cohorts. Precisely, this scenario (HIGH_ED) extrapolates the trends using two extreme points: educational attainment of the cohorts born in 1940 and before and attainment of the 1976-80 cohort.
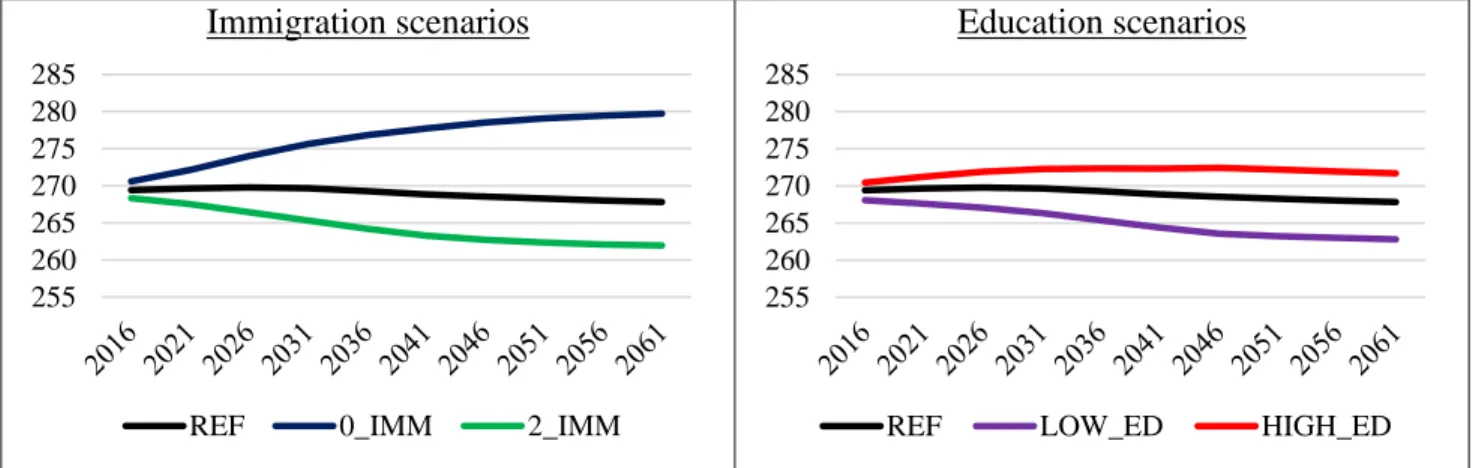
Figure 4 illustrates the overall projected literacy proficiency of the working-age population under these different scenarios. Under the reference scenario (REF), the projected literacy proficiency would slightly decline over the next 50 years as the positive effect of increasing education is completely alleviated by the effect of increasingly large immigration intakes. More precisely, the working-age population average skill level slightly increases during the first decade and peaks at 269.8 in 2026. Then, it slowly decreases to 267.8 in 2061.
Figure 4. Projected average literacy proficiency score, according to different scenarios with respect to immigration (left) and education (right), 25-64 years old, 2016-2061, Canada
Immigration scenarios Education scenarios
Hypothetical immigration scenarios demonstrate the extent at which the migratory component impacts on overall projected skills proficiency of the working-age population. At horizon, the literacy score of the 25-64-year-old Canadians is averaging at 262 if immigration rate is set at 1.5% (2_IMM), while the no-immigration scenario (0_IMM) leads to an average score of 280 in 2061.
With regards to the education scenarios, the projections results are less divergent than the immigration scenarios. In the scenario that projects a more optimistic trend than current observed trend in terms of educational attainment (HIGH_ED), the average literacy proficiency score increases above 272 in 2031, stabilises until 2046 and then slightly decreases to 271,7 in 2061. On the opposite, the low educational attainment scenario (LOW_ED), the projected score decreases during the whole period. The decline is rapid between 2016 and 2046 and decelerates between 2046 and 2061. Under this scenario, the projected score in 2061 is equal to 262.8.
255 260 265 270 275 280 285
REF 0_IMM 2_IMM
255 260 265 270 275 280 285
While the education scenarios have an influence on the projected literacy level of the Canadians aged 25 to 64 years old, these scenarios have nearly no effect on the projected population in 2061. On the contrary, under the immigration scenarios, the size of the projected population is drastically affected. Compared to the reference scenario (and the education scenarios) which projects a working-age population of about 23.5 million Canadians in 2061, the no-immigration scenario (0_IMM) ends up with 12.0 million while the “2_IMM” scenario projects 39.4 million. To sum up, both education and immigration influence the projected literacy level of the working-age population; however, the projected population growth is much more sensitive to the migratory component.
Scenarios on immigrant selection policies
We designed more realistic scenarios where we modify the distribution of the simulated immigrant cohorts between 2012 and 2061, as if the points-based selection system was changed. These “what-if” scenarios aim at comparing different policy changes in order to assess which
measure have the greatest impact. Table 4 sums up the underlying hypotheses of the different
scenarios designed with respect to selection policy of immigrants.
Table 4. Summary of projection scenario assumptions on future immigrant selection policy
Scenario Selection of immigrants
Reference
(REF)
In every projection year, all immigrant cohorts have the same characteristics as recent immigrants (having lived in Canada for
less than 5 years) from the base population (2011) Selection on age
(SEL_AGE)
Immigrant cohorts’ distributions are younger than in the reference scenario (10% more persons aged 0 to 30)
Selection on education
(SEL_EDUC)
Immigrant cohorts’ distributions contain 10% more people with
university degree than in the reference scenario
Selection on language skills
(SEL_LANG)
Immigrant cohorts’ distributions contain 10% more people with
English (or French) as their mother tongue than in the reference
scenario Selection on age, education,
and language skills
(SEL_AEL)
Combination of hypotheses on age, education, and language skills
Under the reference scenario, all simulated immigrant cohorts from 2012 to 2061 have the same characteristics as recent immigrants of 2011. These immigrants are those who lived in Canada for less than 5 years as of 2011. In the next four “what-if” scenario, the simulated immigrant cohorts’ distributions are slightly modified to reflect a plausible change in Canada’s immigrant selection policies. Under the scenario SEL_AGE, the distribution of simulated immigrants contains 10% more persons aged 0 to 30 years old. Under the scenario SEL_EDUC, the distribution of simulated immigrants has 10% more people with a university degree than the reference scenario, and under the scenario SEL_LANG, the distribution has 10% more individuals
with English (or French) as their mother tongue than in 2011. Finally, we designed a fourth “what-if” scenario (SEL_AEL) where all three selection measures (on age, education, and language skills) are combined.
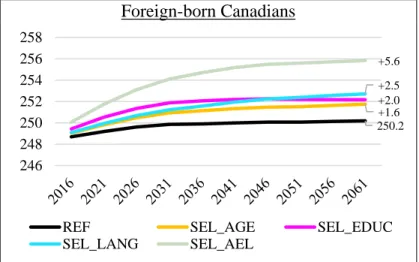
Figure 5 illustrates the overall projected literacy proficiency of the working-age population under these different “what-if” scenarios. Under the reference scenario (REF), the projected literacy proficiency of the foreign-born population would slightly increase over the next 50 years since the recent immigrants’ cohorts are more educated than the long-established foreign-born Canadians. More precisely, the average skill level increases over the whole projection period and reaches 250.2 in 2061.
Figure 5. Projected average literacy proficiency score of the foreign-born population, according to different scenarios with respect to immigrant selection, 25-64 years old, 2016-2061, Canada
Foreign-born Canadians
If Canada’s immigrants were admitted at a younger age (SEL_AGE), the projected literacy score in 2061 would be increased by 1.6 point compared to the reference scenario (REF). If the proportion of immigrants having a university degree was increased by 10% (SEL_EDUC), the projected score would be increased by 2.0 points at horizon. Thirdly, if the proportion of immigrants speaking the official languages was increased by 10%, the literacy skills of the foreign-born population would be increased by 2.5 points. Finally, under the scenario where all 3 selection measures (age, education, and language skills) are combined, the projected literacy of the working-age foreign-born population reaches 255.8 in 2061, which is 5.6 points higher than the projected score at horizon under the reference scenario.
The subsequent question is the following: Are these higher increases of the foreign-born
score enough to prevent the projected decline shown at Figure 4 of the Canadian working-age
population literacy skills proficiency? In other words, would an even more “literacy-oriented” immigrant selection prevent the projected literacy decline, while keeping the immigration rate at 0.75%? Table shows that under the scenario where simulated immigrant cohorts’ distribution (2012-2061) has 10% more individuals with English (or French) as their mother tongue than in
250.2 +1.6 +2.0 +2.5 +5.6 246 248 250 252 254 256 258
REF SEL_AGE SEL_EDUC
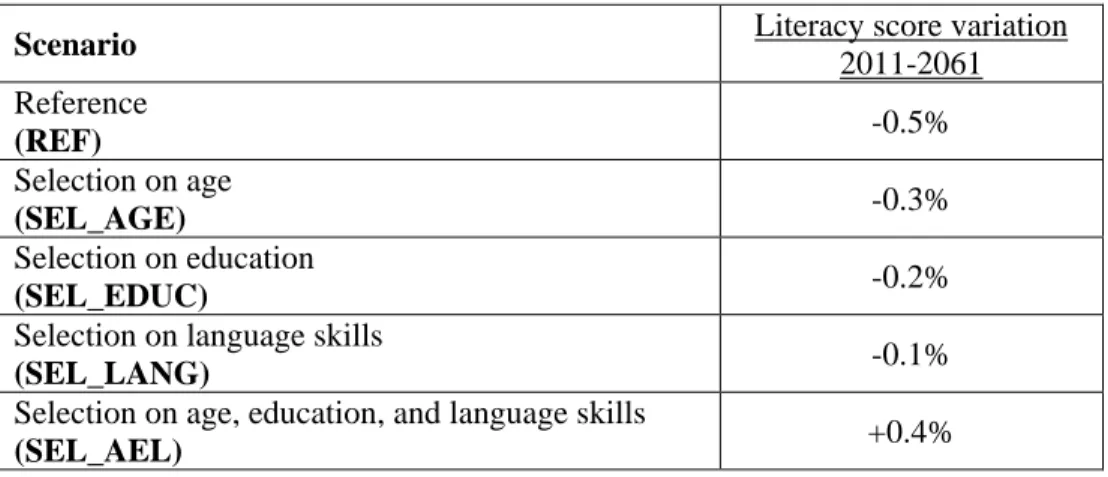
2011 (SEL_LANG), the projected literacy decline among the total working-age population is almost all mitigated. Indeed, the average literacy score declines of only 0.1% between 2011 and 2061. It is interesting to observe that under the scenario where all three selection measures (on age, education, and language skills) are combined (SEL_AEL), the projected score no longer declines but increases of 0.4% and reaches 270 in 2061. These results suggest that changes to immigrant selection policies could prevent the projected literacy skills decline of the Canadian working-age population.
Table 5. Projected average literacy proficiency score variation between 2011 and 2061, according to different scenarios with respect to immigrant selection, 25-64 years old, Canada
Scenario Literacy score variation
2011-2061 Reference (REF) -0.5% Selection on age (SEL_AGE) -0.3% Selection on education (SEL_EDUC) -0.2%
Selection on language skills
(SEL_LANG) -0.1%
Selection on age, education, and language skills
(SEL_AEL) +0.4%
Discussion
The factors linked with literacy proficiency among the working-age population are different in kind and strength. Nonetheless, in Canada (and elsewhere), education is the main driver of one’s literacy skills proficiency. Despite the fact that the acquisition of literacy skills and learning in general can happen in many different contexts and at every moment during the life course, school remains the focal point of literacy skills formation. Of course, other determinants play significant roles, such as the quality of early childhood and social capital (measured in our study through the mother’s education level).
The general overview of the factors linked with skills proficiency is similar among both the foreign- and the native-born populations. For example, we observe an important age effect of similar strength among both groups. Plus, the labour force status and the practise of literacy activities in the everyday life (the life-wide factors) have similar effects on the skills proficiency score of both foreign- and native-born Canadians. However, the immigrants’ average proficiency level is significantly lower than the Canadian-born population, ceteris paribus. In fact, the immigrants constitute a sub-group quite heterogeneous in many ways when it comes to literacy skills. Our results precisely show that there are significant differences among immigrants according to the immigration category or according to the country where they were born and educated. Skills of immigrants with a Canadian diploma are roughly 6% higher on average than
immigrants with completed education in a developing country. These results are consistent with the scientific literature showing that the quality of education and educational institutions varies across countries of the world and impacts on the individuals’ skills and economic returns of these
skills18,21,40. A study found strong evidence that foreign-born Canadians who obtained some or all
of their education in Canada are more similar in many respects to the native-born Canadians than
to foreign-educated immigrants41. Lastly, the language skills play a significant role on people’s
literacy skills proficiency. The linguistic dimension comes second, after education, in terms of its explanatory power of the immigrants’ literacy proficiency. The skills of foreign-born Canadians whose mother tongue and language spoken at home is neither English nor French are significantly lower than Anglophones and/or Francophones immigrants.
In a nutshell, the literacy skills of the future Canadian working-age population are dependent on the evolution of its socio-demographic characteristics. Many processes affecting these characteristics are currently underway and will likely continue to keep up going in the coming decades. Among the most significant phenomena, there is the demographic ageing which, in itself, negatively affects the skills of the population through the age effect observed in the regression
analyses. The Canadian demographic context is also characterised by high immigration rateix
which fuels population growth without significantly reducing the pace of demographic ageing42.
On the positive side, the educational attainment of Canadians is increasing and the economic stream of the Canadian immigration policy is grounded on a points-based selection system which facilitates the entry of high-educated immigrants.
The projection results show how all these intricate socio-demographic changes will impact on the overall literacy proficiency skills of the working-age population. Under the reference scenario, the microsimulation model projects that the sum of these changes will lead to a small negative impact on the average projected skills. In light of the different projection scenarios, this slightly declining trend is mainly driven by the migratory component of the growth of the Canadian population. Actually, the no-immigration scenario (0_IMM) shows how the increasing level of education completely takes over the sole impact of demographic ageing on the projected literacy level. The working-age population age structure will not significantly age during the next decades. Thanks to the baby boomers exiting the 25-64 age group by the end of the 2020’s, the working-age population will actually get younger. It will also become more educated on averworking-age as the retiring older workers will be replaced by younger more educated people. In other words, the literacy skills proficiency is projected to increase among the working-age native-born population thanks to the increasing education level of the younger cohorts joining the labour force and to a
ix Canada’s official immigration plans for 2017-2018 targets 300,000 new permanent residents per year, which
represents a historic high compared to prior years (Immigration, Refugees and Citizenship Canada Departmental Plan 2017 – 2018 retrieved at http://www.cic.gc.ca/english/resources/publications/dp/2017-2018/dp.asp on March 9, 2017). In view of the total Canadian population estimates of January 1, 2017 at 36.5 million, this target corresponds to an immigration rate of 0.82%, which is higher than the reference scenario (REF) rate. Among the G7 countries, Canada has the highest immigration rate; in fact, most of these countries have an immigration rate below 0.50%.
rejuvenation of its age structure. These results suggest that the increasing share of foreign-born population mitigates the effect of this increasing education level.
Immigration has a significant impact on the skills of the Canadian working-age population. As mentioned earlier, under the reference scenario where the immigration rate is kept constant at 0.75%, the skills proficiency is likely to decrease slightly between 2011 and 2061. In order to prevent a decline of the literacy level over the next 50 years, additional simulations (not shown here) showed that the immigration level, in terms of absolute numbers, should be kept constant at 250,000 immigrants per year. When keeping constant the annual number of immigrant at the 2011 level (roughly 250,000 persons), the literacy level stabilises just above 270 between 2016 and 2061, exactly like the projected score under the scenario “SEL_AEL”. Instead, the reference scenario assumes a constant rate, which leads to a decline of the projected proficiency. Otherwise, when doubling the immigration rate to 1.5% (2_IMM), the impact on the working-age population overall skills is similar to the low educational attainment scenario (LOW_ED), where future Canadian cohorts would reach the educational attainment of people born in 1951-55. Increasing immigration, thus, has a similar impact on average skills of the working-age population that decreasing the average education level of the Canadian born would have. Although this may be true in terms of average skills, these two scenarios have very different outcomes in terms of the projected working-age population size.
These results are not predictions but instead express the dynamics of the changes and on-going processes. In light of the results, it appears clear that, if Canada wants to maintain or increase the average literacy skill of its population in a context of high immigration, efforts should be put in two directions: better selection of immigrants and better linguistic integration of those who are admitted in order to improve their skill levels. The projection results shown at Figure 5 revealed an interesting and important feature of the actual Canadian immigrant selection policies: their design is already “literacy-oriented”. Indeed, under the reference scenario, the projected literacy proficiency of the foreign-born population is projected to increase. In other words, the policies that are already implemented have a positive effect on the literacy skills of the foreign-born working-age population. However, as shown in Table 5, the actual policies (REF) are not strong enough to prevent the decline of the skills proficiency of the total Canadian working-age population. In a simulation where newcomers (between 2012 and 2061) are younger, more educated and with a better language skills (SEL_AEL), the projected decline is completely mitigated. In fact, it has the same impact on the projected literacy skills than a scenario where immigrant cohorts are kept constant at 250,000 persons per year.
Reflections must also be made with regards to the global Canadian immigration targets, selection processes, and total population growth in general. Immigration has been a source of diversity for Canada, which has implications of different nature. On the positive side, the economic growth it creates is always put forward; increasing the population will always increase the real gross domestic product (GDP), but some economic studies show that immigration can have a
and ethnic, linguistic and religious fractionalisation can also have a whole array of impacts on
social cohesion46. In short, having an immigration rate twice as high as the other G7 countries has
certain implications that would need to be better understood and thoroughly analysed. Even though
Canada is viewed as a model for successful immigration policies and practices47, the system can
yet be improved as it is not flawless nor without any collateral effect on the society.
Limits
The current analysis provides some hints at the forces that underlie skill gain and loss in adulthood. However, the results are cross-sectional and the literacy projections are derived from these regression analyses. It would be interesting to have a dynamic projection module for literacy skills proficiency which could simulate the individual skill trajectories. However, the longitudinal data needed for these parameters estimations do not exist.
In the actual version of the model, the projected variation of the literacy score is constrained by the regression models’ coefficients. It does not replicate the variation observed in the PIAAC survey data. It would be possible to improve this variation by randomly choosing a value within the confidence interval of the regression coefficients. However, the projection outcomes would not be substantially different. Indeed, for the sake of testing the extent at which different socio-demographic characteristics influence the future literacy skills, this module is convenient and generates pertinent results.
Conclusion
Information-processing skills such as those measured in the PIAAC survey are important assets in nowadays societies. The OECD reports numerous positive relationships between these
skills and many well-being as well as labour market indicators13. It appears crucial to better
understand how and why we observe a 20% gap in literacy proficiency between foreign- and native-born in the OECD countries. The immigrants’ lower literacy proficiency has important implications for the overall skills of the future working-age population since this 20% gap is comparable in magnitude to the difference between respondents having upper secondary education
and those having tertiary education13.
By adding literacy skills to the forecast, the microsimulation model LSD-C can generate relevant and innovative results guiding policy makers in their decisions with respect to immigration policy as well as education skills formation needs. This research provides a real analytical tool for understanding the evolution of literacy in the Canadian context resulting from foreseeable changes in the characteristics of the population. “What-if” scenarios are used to illustrate the effects of different immigrants’ selection patterns on the literacy skills proficiency of the projected labour force.
The methodology presented in this paper could easily be applied to other microsimulation models which project the population (and its socio-demographic characteristics) of a country (or
region) who participated to the PIAAC surveyx. Such models are currently developed for the
USA48 and for European Union 28 member states at the Centre of Expertise on Population and
Migration49. Canada, the United States and Europe have different immigration histories, different
foreign-born populations in terms of socio-demographic characteristics, different integration policies, and different education systems. Generating similar results for the United States and Europe would certainly lead to interesting comparisons.
x According to the OECD web site, the Survey of Adult Skills (PIAAC) was conducted in over forty countries, which
Appendix – Education module parameters’ calculation
Figure-A. 1 shows the underlying hypothesis in terms educational attainment of cohorts as
projected by our reference scenario in LSD-C (See “Model’s parameters (Ref. Sce.)” in Figure-A.
1).
Figure-A. 1. Educational attainment distribution of cohorts born between 1961 and 1980 (and projected), by sex and province, Canada, 2011 NHS
Males Females
█ Less than high school diploma █ Highschool diploma and other post-secondary █ University diploma NOTE: The distributions are those of the white English-speaking native-born Canadians, who are born from Canadian-born parents (generation 3+). Total population distributions including all Canadians, notwithstanding the visible minority group they belong to, the language they speak and the immigration status, slightly differ. One notable difference is Quebec, where most of the population is French-speaking. The educational attainment distribution of the French-speaking population in Quebec is similar to the distribution of the English-speaking population in Ontario and other major Canadian provinces.
Figure-A. 1 shows the extent at which the level of education has increased among
successive birth cohorts during the second half of the 20th century. The average level of education
is higher among female cohorts than male cohorts. Proportion of people with a university diploma has increased faster among women and surpasses men’s proportion. Moreover, there are relatively fewer low-educated (“Less than high school diploma”) women than men. Differences across provinces are marginal.
The education module parameters assume that the level of education should continue to
increase (See “Model’s parameters (Ref. Sce.)” in Figure-A. 1). The gain is based on the trend
observed between the 1966-70 and the 1976-80 cohorts.
0% 10% 20% 30% 40% 50% 60% 70% 80% 90% 100% C ohort bor n in 1961-1965 C ohort bor n in 1966-1970 C ohort bor n in 1971-1975 C ohort bor n in 1976-1980 Mode l's par amete rs ( R ef . S ce .) C ohort bor n in 1961-1965 C ohort bor n in 1966-1970 C ohort bor n in 1971-1975 C ohort bor n in 1976-1980 Mode l's par amete rs ( R ef . S ce .) C ohort bor n in 1961-1965 C ohort bor n in 1966-1970 C ohort bor n in 1971-1975 C ohort bor n in 1976-1980 Mode l's par amete rs ( R ef . S ce .) C ohort bor n in 1961-1965 C ohort bor n in 1966-1970 C ohort bor n in 1971-1975 C ohort bor n in 1976-1980 Mode l's par amete rs ( R ef . S ce .) C ohort bor n in 1961-1965 C ohort bor n in 1966-1970 C ohort bor n in 1971-1975 C ohort bor n in 1976-1980 Mode l's par amete rs ( R ef . S ce .) C ohort bor n in 1961-1965 C ohort bor n in 1966-1970 C ohort bor n in 1971-1975 C ohort bor n in 1976-1980 Mode l's par amete rs ( R ef . S ce .) Atlantic Provinces
Quebec Ontario Manitoba & Saskatchewan Alberta British Columbia 0% 10% 20% 30% 40% 50% 60% 70% 80% 90% 100% C ohort bor n in 1961-1965 C ohort bor n in 1966-1970 C ohort bor n in 1971-1975 C ohort bor n in 1976-1980 Mode l's par amete rs ( R ef . S ce .) C ohort bor n in 1961-1965 C ohort bor n in 1966-1970 C ohort bor n in 1971-1975 C ohort bor n in 1976-1980 Mode l's par amete rs ( R ef . S ce .) C ohort bor n in 1961-1965 C ohort bor n in 1966-1970 C ohort bor n in 1971-1975 C ohort bor n in 1976-1980 Mode l's par amete rs ( R ef . S ce .) C ohort bor n in 1961-1965 C ohort bor n in 1966-1970 C ohort bor n in 1971-1975 C ohort bor n in 1976-1980 Mode l's par amete rs ( R ef . S ce .) C ohort bor n in 1961-1965 C ohort bor n in 1966-1970 C ohort bor n in 1971-1975 C ohort bor n in 1976-1980 Mode l's par amete rs ( R ef . S ce .) C ohort bor n in 1961-1965 C ohort bor n in 1966-1970 C ohort bor n in 1971-1975 C ohort bor n in 1976-1980 Mode l's par amete rs ( R ef . S ce .) Atlantic Provinces
Quebec Ontario Manitoba & Saskatchewan
Alberta British Columbia
Références
1
OECD. (2001). The Well-being of Nations: The Role of Human and Social Capital. Paris: OECD Publishing.
2
Schuller, T. (2001). The complementary roles of human and social capital. Canadian Journal of Policy
Research, 2(1), 18-24.
33
Gradstein, M., & Justman, M. (2000). Human capital, social capital, and public schooling. European
Economic Review, 44(4), 879-890.
4
European Commission. (2003). Human capital in a global and knowledge-based economy — Final
report. Luxembourg: Office for Official Publications of the European Communities.
5
Lutz, W., Butz, W., & KC, S. (2014). World population and human capital in the twenty-first century. Oxford: Oxford University Press.
6
St. Clair, R. (2012). The Limits of Levels: Understanding the international adult literacy surveys (IALS). International Review of Education, 58(6), 759-776.
7
Ferrer, A., Green, D. A., & Riddell, W. C. (2006). The Effect of Literacy on Immigrant Earnings. The
Journal of Human Resources, 41(2), 380-410.
8 Bonikowska, A., Riddell, W. C., & Green, D. A. (2008). Literacy and the labour market: Cognitive
skills and immigrant earnings. Ottawa: Statistics Canada.
9
Carey, D. (2014). Overcoming Skills Shortages in Canada. OECD Economics Department Working
Papers, No. 1143, Paris: OECD Publishing.
10 Levy, F. (2010). How Technology Changes Demands for Human Skills. OECD Education Working
Papers, No. 45, Paris: OECD Publishing.
11 Coleman, D. (2006). Immigration and Ethnic Change in Low-Fertility Countries: A Third Demographic
Transition. Population and Development Review, 32(3), 401-446.
12 Vertovec, S. (2007). Super-diversity and its implications. Ethnic and Racial Studies, 30(6), 1024-1054. 13 Organisation for Economic Co-operation and Development. (2016). Skills Matter: Further Results from
the Survey of Adult Skills. OECD Skills Studies. Paris: OECD Publishing.
14 Kerckhoff, A. C., Raudenbush, S. W., & Glennie, E. (2001). Education, Cognitive Skill, and Labor
Force Outcomes. Sociology of Education, 74(1), 1-24.
15 Lutz, W. (2013). Demographic Metabolism: A Predictive Theory of Socioeconomic Change.
Population and Development Review, 38, 283-301
16
Desjardins, R. (2003). Determinants of Economic and Social Outcomes from a Life-Wide Learning Perspective in Canada. Education economics, 11(1), 11-38.