Titre:
Title
:
Machine learning-based EDoS attack detection technique using
execution trace analysis
Auteurs:
Authors
:
Hossein Abbasi, Naser Ezzati-Jivan, Martine Bellaïche, Chamseddine
Talhi et Michel R. Dagenais
Date: 2019
Type:
Article de revue / Journal articleRéférence:
Citation
:
Abbasi, H., Ezzati-Jivan, N., Bellaïche, M., Talhi, C. & Dagenais, M. R. (2019). Machine learning-based EDoS attack detection technique using execution trace analysis. Journal of Hardware and Systems Security, 3(2), p. 164-176.
doi:10.1007/s41635-018-0061-2
Document en libre accès dans PolyPublie
Open Access document in PolyPublie
URL de PolyPublie:
PolyPublie URL: https://publications.polymtl.ca/4211/
Version: Version finale avant publication / Accepted version Révisé par les pairs / Refereed Conditions d’utilisation:
Terms of Use: Tous droits réservés / All rights reserved
Document publié chez l’éditeur officiel
Document issued by the official publisher
Titre de la revue:
Journal Title: Journal of Hardware and Systems Security (vol. 3, no 2) Maison d’édition:
Publisher: Springer URL officiel:
Official URL: https://doi.org/10.1007/s41635-018-0061-2 Mention légale:
Legal notice:
This is a post-peer-review, pre-copyedit version of an article published in Journal of Hardware and Systems Security. The final authenticated version is available online at:
https://doi.org/10.1007/s41635-018-0061-2
Ce fichier a été téléchargé à partir de PolyPublie, le dépôt institutionnel de Polytechnique Montréal
This file has been downloaded from PolyPublie, the institutional repository of Polytechnique Montréal
(will be inserted by the editor)
Machine Learning-Based EDoS Attack Detection
Technique Using Execution Trace Analysis
Hossein Abbasi · Naser Ezzati-Jivan · Martine Bellaiche · Chamseddine Talhi · Michel R. Dagenais
the date of receipt and acceptance should be inserted later
Abstract One of the most important benefits of using cloud computing is the benefit of on-demand services; Accordingly, the method of payment in the cloud environment is pay per use. This feature results in a new kind of DDOS attack called Economic Denial of Sustainability (EDoS), in which the customer pays extra to the cloud provider as a result of the attack. Similar to other DDoS attacks, EDoS attacks are divided into different types, such as 1) bandwidth-consuming attacks, 2) attacks that target specific applica-tions, and 3) connection - layer exhaustion attacks. In this work, we propose a novel framework to detect different types of EDoS attacks by designing a profile that learns from and classifies the normal and abnormal behaviors. In this framework, the extra demanding resources are only allocated to VMs that are detected to be in a normal situation and therefore prevent the cloud environment from attack and resource misuse propagation.
Keywords DDoS attacks · EDoS attacks · Cloud Computing · Machine-learning · Detection
Hossein Abbasi
Ecole Polytechnique Montreal,Canada E-mail: [email protected] Naser Ezzati-Jivan
Ecole Polytechnique Montreal,Canada E-mail: [email protected]
Martine Bellaiche
Ecole Polytechnique Montreal,Canada E-mail: [email protected] Chamseddine Talhi
´
Ecole de technologie sup´erieure ,Canada E-mail: [email protected] Michel R. Dagenais
Ecole Polytechnique Montreal ,Canada E-mail: [email protected]
1 INTRODUCTION
Cloud computing is a revolutionary concept that has transformed information and communication technology by delivering computational resources as ser-vices across the Internet. Cloud computing provides inexpensive and scalable resources on demand for system requirements, and consequently, there is no need to invest in a huge computer system. However, security is a big concern in this emerging technology. There are more systems to protect, more possible points of entry, more holes to patch, and also more interconnection points in the cloud; Accordingly, security in the cloud is more critical than old systems [1]. One of the popular problems in cloud security is a denial of service (DOS) attack. DOS attacks increase the server load and make the system inaccessible [2].
The absolute prevention of Distributed Denial of Service (DDoS) attacks, one of the popular DOS attacks in cloud computing, is not possible. Therefore, detecting these attacks is an important step in securing the cloud against this very common type of security threat. The attacker in a DDoS attack tries to flood a target machine by sending packets similar to normal and factual traffic sent by another virtual machine. Thus, the detection systems cannot successfully detect DDoS attacks. On the other hand, the distributed nature of these attacks makes them more difficult to detect. There is a specific type of DDoS attack specially designed for the cloud computing environment, which is called Economic Denial of Sustainability (EDoS) [3].
According to the general definition of the National Institute of Standards and Technology (NIST), one of the most important benefits of using cloud computing is having on-demand services [4]. This means that cloud customers do not need to buy whole resources and infrastructure for the first time but can instead get more resources on demand later. Accordingly, the method of payment in the cloud environment is pay per use [5]. EDoS has been designed based on this particular benefit of cloud computing.
Since the cloud environment is elastic and works based on the pay-as-you-use model, additional resources might be easily available. However, the customer must pay extra for them. Economic Denial of Sustainability is a scenario in which the customer pays extra to the cloud provider as a result of the attack. Also, because in this situation the DDoS attack is transferred to the hypervisor, it can be dangerous for the hypervisor and for the entire cloud environment.
One way to prevent this problem is to limit or control the resource alloca-tion [6]. However, by doing so, we actually limit some of the most important advantages of cloud computing. Thus, the absolute prevention of the occur-rence of Distributed Denial of Service (DDoS) attacks and Economic Denial of Sustainability (EDoS) attacks in cloud computing is not possible. There-fore, detecting these attacks, which can help in controlling resource allocation in a secure way, is an important step in securing the cloud against this very common type of security threat.
The majority of existing algorithms for detection of DDoS attacks in the cloud-computing environment work based on packet information; however, In most of the times the packet information in DDoS attacks is very similar to the normal situation (more similarity, more dificulty to detect), except for the number of packets, which can be considerable in DDoS attacks. Consequently, the current packet-based approaches are not reliable and powerful enough for DDoS detection.
On the other hand, the present algorithms for EDoS attacks have mainly focused only on finding a solution for the defense and mitigation of EDoS attacks. Moreover, they are usually proper for a limited number of attack types because most of them work on the attacks features. To the best of our knowledge, there is no global model that detects all types( without limitation) of EDoS attacks. Therefore, we decided to detect DDoS and EDoS attacks in cloud computing by working on traffic and resource usage anomaly detection. For this work we selected HTTP Attack, Database Attack, and TCP SYN Flood Attack as a type of Bandwidth-consuming attacks,Attacks that target specific applications and Connection-layer exhaustion attacks respectively ; and try to investigate that how they affect the system.
Our main idea for detecting these attacks is that even if attackers in DDoS and EDoS attacks can generate similar packets to normal packets, the amount of traffic generated in DDoS and EDoS attacks will not be similar to that in normal situations. Furthermore, the proportion of resource usage is com-pletely different in the case of attack in comparison with normal situations. The approach here is to get periodic sample traffic and patterns of resource usages from VMs under investigation, learn from them, generate a behavioral profile for each VM, and use the learned profile to detect if the demand for the extra requested resources comes from a normal or abnormal behavior and then accept, limit, or prevent the demanded extra resource allocation.
Our contributions in this work are as follow:
1. Detecting DDoS and EDoS attacks by working on traffic and resource usage anomaly detection in the cloud environment
2. Introducing an inclusive algorithm that detects HTTP Recompile 1 Attack, Database Attack, and TCP SYN Flood Attack, no matter when each attack happens.
3. Using precise kernel information using a low-overhead kernel tracer in the profile features collection and detection phases.
We used machine learning algorithms in 2 differents phases. Phase one ex-plains the analysis of our metrics and check whether the metrics of one kind of attack play an important role to detect another type of attacks and vice versa (comparison between our algorithm and C1,C2,C3). Phase 2 is for detec-tion;We define a profile to collect data from VMs any time that they applied for more resources from hypervisor. We check each sample with the profile and based on changing process of the data and behaviour of resource usage we can detect situation of the traffic. Although using threshold method is a well-known procedure of change detection [25], we preferred to use machine
learning because by using threshold we cannot investigate difference between heavy normal traffic and attack traffic. Small threshold improves the sensitiv-ity, but increases the possibility of introducing false positives. On the other hand, a larger threshold is likely to reduce the sensitivity of detection. Basi-cally, in normal situations, we might have a large load in the network without any attack; however, by using the threshold this situation is considered as an attack. There are 2 types of Intrusion detection systems [27]:signature based and anomaly based. Each of them has some benefits and some problems. We used benefits of both types of IDS by using machine learning and define a profile in the same algorithm.
The remainder of this paper is organized as follows: Section (2) presents the previous related works. In section (3), we will propose our architecture and methodology. In section (4), we will explain our profile and the different feature of this profile. Section (5) discusses and analyzes the results and describes how we used machine-learning techniques to build VM profiles. Section (6) concludes the paper and investigates some interesting future work.
2 Related Work
There are many algorithms in traditional (non-virtualization) systems for de-tecting DDoS attacks, but since the virtualization technique itself is causing overloads on the server [7], even a small attack in the cloud-computing envi-ronment can disable the server. Thus, we need a more powerful algorithm with a low overload capacity.
Some approaches have been introduced in the literature on how to detect, defend against, and mitigate EDoS attacks in the cloud-computing environ-ment. Sqalli et al. [8] proposed an approach called EDoS-Shield to mitigate EDoS attacks in cloud computing. They divided the received requests from the user side into two categories: the legitimate requests and the generated-by-bots requests. They used a verifier and sent the first request from a new IP to this verifier. The verifier performs a verification process and decides to put this address either in the white or black list. These lists are related to legitimate requests and bot-generated requests, respectively. The subsequent requests that are from an IP address in the black list will be blocked by a virtual firewall, and the subsequent requests from an IP address in the white list can connect to the cloud services to access services that they want.
The proposed work by Naresh Kumar et al. [9] provided an architecture to mitigate web service EDoS attacks. In this work, a crypto puzzle (client puzzle) has been generated to identify a legitimate user. The customers must solve this puzzle to receive authorization to use the cloud services. Their work is based on the service provider assessment about the state of the system, which can be normal or suspicious, depending on the server load and the bandwidth load. Using this information, the architecture decides on the severity of the puzzle. The Enhanced DDoS-Mitigation System (Enhanced DDoS-MS) is a frame-work presented by Alosaimi et al. [10] to mitigate EDoS attacks in cloud
com-puting. This framework distinguishes legitimate users from malicious ones by testing the first packet received from the user by using a Graphical Turing Test (GTT). They also utilized an Intrusion Prevention System (IPS) to de-tect malware in the contents of packets. The crypto puzzle and white/black list approaches were used to mitigate EDoS attacks in this work, similar to the previous articles discussed above [8, 9].
A cost-effective EDoS attack mitigation framework for e-commerce ap-plications in cloud environments, called EDoS Armor, has been provided by Masood et al. [11]. This paper provided a multi-layered defense system. In the first step, only a limited number of valid users are allowed to connect to the application to be less overwhelming. Next, a browsing behavior-based learn-ing mechanism is used, and the priority of the users is allocated on this basis. This priority value determines how the resources are shared among the users; the higher the priority, the more resources are allocated, while the lower the priority, the fewer resources are assigned.
An approach to control virtual resource access to mitigate EDoS attacks against cloud infrastructures is provided by Baig et al. [12]. In this paper, an approach has been provided to selectively control user requests for a service within the service provider. In this approach, incoming requests from the user are classified into either normal or suspicious requests. Afterward, further anal-ysis is implemented to guarantee that those normal and legitimate users have the priority of cloud service access; however, users that are in the suspicious class have a lower priority to the service access until they are removed from the suspect list.
Al-Haidari et al. [13] provided an algorithm that uses the Time To Live (TTL) field of the IP header to detect and mitigate the spoofed IP EDoS attacks. The authors made use of the white/black list approach in their work. They used a verifier and a threshold system to classify the entering packets as either normal packets or suspicious ones and to collect source IP addresses, along with the amounts of TTL, in the whitelist and the blacklist for the normal and the suspicious packets, respectively.
Koduru et al. [14] also proposed a detection approach for EDoS. They used the Time Spent on a Web Page (TSP) to detect HTTP EDoS attacks. The main idea of their work came from the fact that the TSP in an attack situation is different from the mean TSP of a web page in normal situations. They calculated TSP and the Mean Absolute Deviation (MAD) of TSP and showed the results in a graph. However, the provided approach in this paper does not work automatically, and a cloud administrator needs to constantly monitor the graphs. This paper also provided a solution for detecting only HTTP EDoS attacks and cannot detect other kinds of EDoS attacks.
Shea et al. [7] tried to find a solution for DoS attacks by using a thresh-old and modifying it in the interrupt request. The authors also provided a resource usage monitoring approach. In this paper, the impact of DOS attacks in different resources in the cloud-computing environment has been presented. As shown in this review, the majority of the papers in the field of EDoS attacks have focused on finding a solution for the defense and mitigation of
only one type of EDoS attack in cloud computing. However, in general, there are also a few works on detecting this kind of attack. In the next section, we will add new features to these structures and will propose a new framework for detecting different types of EDoS attacks in cloud computing.
3 Methodology
We consider that virtual servers in cloud computing can be targeted by three general classes of attacks:
A. Bandwidth-consuming attacks: This kind of attack uses the total band-width of the target with large volumes of data packets. It leads to a denial of services because normal requests cannot receive quick and operational re-sponses [15]. In this work, we use HTTP Attack as a good representative for the Bandwidth-Consuming EDoS.
B. Attacks that target specific applications: This kind of attack targets a specific application in servers. In the cloud-computing environment, each application can run in a virtual machine; therefore, in an attack scenario, the attacker tries to harm servers by attacking the special VM that includes this specific application. In our work, we chose Database as the application targeted by this type of attack (one targeting specific applications), and our goal is to investigate the virtual machine allocated to Database.
C. Connection-layer exhaustion attacks: This kind of attack tries to use the protocol features, such as a Three-Way Handshake in TCP/IP protocol, to attack the servers. TCP SYN Flood, ICMP/ UDP flood attacks are exam-ples of connection-layer exhaustion attacks. Since these attacks happen at the time of making a connection between client and server, we call this category ”connection-layer exhaustion attacks.” As a delegate for connection-layer ex-haustion attacks in this work, we nominate the TCP SYN Flood Attack, which is one of the most important issues in security [2]. Accordingly, we will use the features suitable for detecting this kind of connection-layer exhaustion attack. To detect other attacks in this category of EDOS attacks, it is probably neces-sary to add other features to our profile, although the same model is applicable in all cases.
Isolation is one of the main concepts in cloud computing, and we assume here that every service in cloud computing is located in a separate virtual machine. For example, the database is placed in one virtual machine and the web server is located in a separate virtual machine. Therefore, when a customer wants to put her/his services in the cloud, she/he must order a set of VMs. (We consider the infrastructure as a service.) However, as discussed earlier, cloud-computing systems are pay-as-you-go services, so customers must pay for the amount of VM that they used. They can apply for more resources whenever they want.
On the hypervisor side, we can monitor all the events and requests from each VM. In the proposed framework, when a virtual machine applies for more resources and sends its requests to the hypervisor, we can have a monitoring
system trace the VM kernel system and compare the results with the profile. If the situation is normal, the resources are allocated to VM, but if an attack is detected in VM resources(abnormal situation), the resources will not be allo-cated to VM and the live migration will be stopped. Based on this explanation about cloud computing, we have designed a profile with the following features:
Fig. 1 The architecture of the proposed Detecting and Monitoring system
Therefore, in this paper, our ultimate goal is to introduce a generic algo-rithm that works perfectly for HTTP Attacks, Database Attacks, and TCP SYN Flood Attacks, no matter when and where (in what VM) each attack occurs. Consequently, instead of using three different algorithms for detecting these attacks, we propose a unique and generalized algorithm to detect all of them at the same time. In this way, we get much more reliable results com-pared to the algorithms that consider only the features of one attack, because the features of one attack can play an important role in other attacks as well. Figure 1 demonstrates our proposed idea. In the following, we will investigate a different part of the architecture.
3.1 Feature Extraction
In the very first step, we will need to have normal traffic and a normal resource usage pattern from the hypervisor. We must first generate this traffic inten-tionally and collect the samples. The number of the samples must be enough to cover the various traffic situations at different hours of the day. These traffic samples must cover heavy and light traffic times, as various services may be provided to customers by the cloud provider depending on the time. We want to analyze this traffic and the resource usage in normal situations to extract some thresholds and investigate the behavior and proportion of resource usage in a normal situation and extract some information. With this information, we can verify if there is misuse in the VM traffic and resource usage.
3.2 Monitoring and Sampling Module
We will need to generate HTTP Attack, Database Attack, and TCP SYN Flood Attack traffic in order to collect and investigate the corresponding sam-ple resource usage patterns.
On the hypervisor side, we monitor all the events and the requests from each VM to extract some predefined metrics( we will explain in more detail about this metrics in next sections). Every time a virtual machine applies for more resources and sends a request to the hypervisor to demand a new set of resources, we call the sampling and monitoring module. To do so, we trace ker-nels of the request sender VM and VMs that communicate with that VM. We will then be able to get the samples from the traffic of VMs for our analysis. To achieve this goal, it is necessary to design a “Monitoring and Sampling” module as a part of the targeted DDoS/EDoS detection architecture. Hyper-visor is the best place for positioning this part as all the traffic for all virtual machines goes through the hypervisor.
3.3 Attack Identification
Our main approach to detect HTTP Attacks, Database Attacks, and TCP SYN Flood Attacks is based on the fact that even if the attackers in DDoS and EDoS attacks can make packets similar to the normal case, they cannot cheat on the amount of traffic they generate in the attack situation. The proportion of resource usage would also be completely different in the case of attack compared to a normal situation. Accordingly, each attack can be identified by specific features that are related to the traffic and resource usage pattern in that attack. Furthermore, we assume that a virtual machine hosts only one specific service. For example, the database server is placed in one virtual machine, while the web server is located in another virtual machine. Different types of attacks target different virtual machines as follows:
1. EDoS Attacks, including HTTP Attack and Database Attack: In HTTP Attacks, a webserver virtual machine will be targeted by attackers. In the case of Database Attacks, the virtual machine assigned to the Database Server receives many database queries for each HTTP request.
2. TCP SYN Flood Attack occurs in the time of connection to the webserver virtual machine.
To design our model, we need to investigate the behavior of resource usage in virtual machines that are related to the victim virtual machine. For this purpose, we collect features related to traffic and resource usage in each attack situation. These features are the metrics of our profile and will be explained in detail in the following section.
It is important to note that we do not compare the attacks themselves with each other. However, rather than using a separate algorithm for detecting each attack, we will introduce an inclusive and generalized algorithm that contains
the metrics of all three attacks. Metrics of one kind of attack play an important role in detecting other types as well. Therefore, we can expect much more reliable results using our generic algorithm compared to the algorithms that investigate the metrics of only One type of attack. We will demonstrate it in the Metrics Evaluation section.
3.4 Metrics
In this section we introduce the metrics that we use to design our detection model. The metrics are selected from prior works on Http attacks such as [7, 30, 34, 31, 33, 35], on TCP SYN Flood attacks such as [26, 7, 34, 28] and in Database attacks such as [7, 30, 34].Generally, there is no priority in the met-rics(features) in our algorithm.We used a set of metrics(apart from types of attacks) and define some rules(signs). Then we compared our result with the states that only metrics related to one attack was considered for detect that type of attack (C1,C2,C3).Actually we evaluate our metrics by doing this com-parison in the end of the paper and it shows the metrics of one kind of attack play an important role to detect another type and vice versa.These are the features that we want to extract from the traffic or resource usage monitoring:
– TSP: Time Spent on a Web Page (X1).
– IOWi: Network I/O in webserver virtual machine (incoming) (Kbits/s) (X2).
– IOWo: Network I/O in webserver virtual machine (outgoing) (Kbits/s) (X3).
– IODi: Network I/O in database virtual machine (incoming) (Kbits/s)(X4). – IODo: Network I/O in database virtual machine (outgoing) (Kbits/s)(X5). – CPUW: Percent of CPU usage in webserver virtual machine (X6). – CPUD: Percent of CPU usage in Database virtual machine (X7). – MemW: Percent of Memory usage in webserver virtual machine (X8). – NBWph: Network bandwidth usage in webserver per hours (MB) (X9). – NBWpd: Network bandwidth usage in webserver per day (MB) (X10). – NBWpw: Network bandwidth usage in webserver per week (GB) (X11). – NBWpm: Network bandwidth usage in webserver per month (GB)(X12). – R(SYN): The ratio of SYN packets in TCP packets(X13).
– R(ACK): The ratio of ACK packets in TCP packets(X14).
– R(SYN+ACK): The ratio of SYN and ACK packets in TCP packets(X15). – NPi: Number of packets (incoming) per second(X16).
– NPo: Number of packets (outgoing) per second(X17). – NHOP: Number of half-opened connections(X18).
3.5 Profile
The approach here is to get periodic traffic samples and patterns of resource usage from the VMs under investigation, generate a behavioral profile for each VM, and then use the learned profile later in the detection phase.
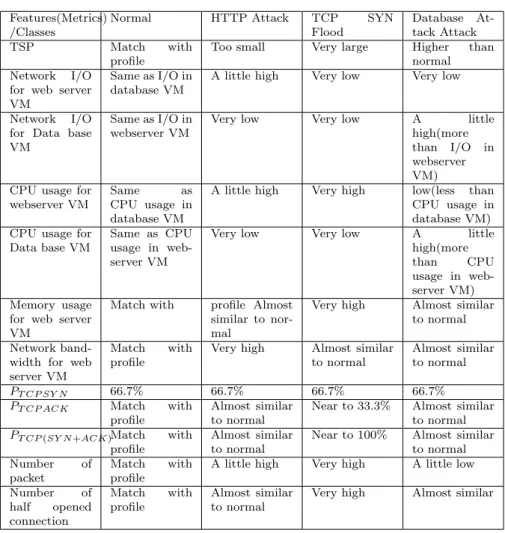
It is important to note that in our algorithm, a set of features is considered for a VM profile; therefore, the machine-learning algorithm needs to check all features to make a decision about normal or attack traffic. In fact, we classify attack traffic into three classes: bandwidth-consuming attacks, connection-layer exhaustion attacks, and attacks that target specific applications by using machine learning based on 18 features (X1,X2,. . . ,X18).Table 1 demonstrates a summary of the attacks and the relationship between each attack and the metrics (HTTP Attack, Database Attack, and TCP SYN Flood Attack as a type of Bandwidth-consuming attacks,Attacks that target specific applications and Connection-layer exhaustion attacks, repectively). This data is then used to train the machine-learning algorithm in the training phase.
In order to have an updated profile, we use the Exponential Moving Aver-age(EMA) method [16] after detecting a suitable category for each new entry traffic. By using this method, we add features of all new traffic to our profile and increase the number of data to improve our framework accuracy by time. In the EMA method, we calculate the average of previously collected data for each feature in the time that new traffic is received (t) and call it Ave(t−1) ;
the number of data collected in our profile is n-1 at time t-1; this number will be n at time t.
Therefore, we can calculate the Ave (t-1) using the following equation:
Ave(t−1)=
Pn−1
i Si
n − 1 (1)
Where Si s are previous data in each feature. Based on the EMA method, we can calculate the new average ( Ave (t)) for each feature using Equation 2 :
Avet= (1 − α)Ave(t−1)+ αSj (2)
where Sjis the feature of new received traffic and the α factor is the weight
we consider for each data to show its importance. α can be defined as follows:
α = 2
n + 1 (3)
By using the above technique and by considering α factor, the newer entries play a stronger role in calculating the average. Finally, the new average will be put in the suitable category (Normal situation, HTTP Attack, Database Attack, and TCP SYN Flood Attack) in our profile each time.
Features(Metrics) /Classes
Normal HTTP Attack TCP SYN
Flood
Database At-tack AtAt-tack
TSP Match with
profile
Too small Very large Higher than normal Network I/O
for web server VM
Same as I/O in database VM
A little high Very low Very low
Network I/O for Data base VM
Same as I/O in webserver VM
Very low Very low A little
high(more than I/O in webserver VM) CPU usage for
webserver VM
Same as
CPU usage in database VM
A little high Very high low(less than CPU usage in database VM) CPU usage for
Data base VM
Same as CPU usage in web-server VM
Very low Very low A little
high(more
than CPU
usage in web-server VM) Memory usage
for web server VM
Match with profile Almost similar to nor-mal
Very high Almost similar to normal Network
band-width for web server VM
Match with profile
Very high Almost similar to normal
Almost similar to normal PT CP SY N 66.7% 66.7% 66.7% 66.7%
PT CP ACK Match with
profile
Almost similar to normal
Near to 33.3% Almost similar to normal PT CP (SY N +ACK)Match with
profile
Almost similar to normal
Near to 100% Almost similar to normal Number of
packet
Match with profile
A little high Very high A little low Number of half opened connection Match with profile Almost similar to normal
Very high Almost similar
Table 1 Feature of Normal traffic and different type of EDoS attacks
4 Detection Algorithms
As discussed earlier, when VMs need more resources (memory, CPU, network bandwidth, etc.), they send their requests to the hypervisor to increase the resources, and the hypervisor allocates the required resources to these VMs. However, if the hypervisor does not have enough resources, it may migrate the VM to another hypervisor. In an attack situation, it may then propagate the attack to other VMs by using more resources in the under-attack VM and limiting the resources for other VMs, thereby affecting their normal behavior. We put our framework in the middle of this process so that when a request is sent from VMs, this request is first received by the Traffic Statistic Compu-tation & Measurement part. The task of this part is to extract features of all VMs that are related to the desired VM. Afterward, the results generated by that Traffic Statistic Computation & Measurement part (X1 to X18) will be
sent to the Decision Unit, where our proposed detecting algorithm can detect the situation of the new arrival traffic and can calculate the occurrence proba-bility of each type of attack as well, which works based on a machine-learning algorithm.
The machine-learning module is trained by profile data, as explained in the previous section. Thereafter, the Decision Unit makes a decision by comparing new arrival traffic features with the profile features and then puts the new traffic in one of the four classes (Normal Traffic, Connection Layer Attack, Bandwidth-Consuming Attack, or Specific Application Attack).
Based on the results of this detection, if one of the three attacks is detected with a high percentage, allocation of the resources will be limited; otherwise, resources will be allocated to VM. The critical value of the attack percentage to make a decision depends on the sensitivity of the system. For a more sensitive system, even attacks with a low percentage occurrence cause limiting resources. We used all the metrics of different types of attacks for detecting each type of attack in our framework. This means that the metrics of one kind of attack play an important role in detecting other types and vice versa. In order to elaborate on and evaluate our detection model, we compared our framework efficiency with algorithms that use only the special metrics of one attack to detect that attack without considering the metrics of other attacks. We named these three types of algorithms C1, C2, and C3, as discussed in the following.
4.1 HTTP Attack Detection
When a virtual machine applies for more resources and sends its requests to the hypervisor, the hypervisor must analyze the VM that sent the requests, as well as the VMs that communicated with that VM, and must then check the below states. If the hypervisor finds the below states in the behavior of VMs, there is an HTTP Attack in that VM and the hypervisor should not allocate more resources to that VM. C1 is a set of algorithms to detect HTTP Attacks based on specific features of HTTP Attacks. Using the information shown in Table 1, we consider an HTTP Attack as being carried out when the following signs are observed.
1. Sign 1: TSP in HTTP Attacks shows a sudden decrease.
2. Sign 2: IOWi in HTTP Attacks shows a sudden increase and IODi shows a sudden decrease.
3. Sign 3: IOWo in HTTP Attacks shows a sudden increase and IODo shows a sudden decrease.
4. Sign 4: CPUW in HTTP Attacks shows sudden increase and CPUD shows sudden decrease.
5. Sign 5: NBWph in HTTP Attacks shows a sudden increase. 6. Sign 6: NBWpd in HTTP Attacks shows a sudden increase. 7. Sign 7: NBWpw in HTTP Attacks shows a sudden increase. 8. Sign 8: NBWpm in HTTP Attacks shows a sudden increase.
The State parameter for the sign p in this attack is defined as SHT T P,p.
For the sign p in an HTTP Attack, SHT T P,p is equal to 1 if the sign meets
and is equal to 0 if the sign does not meet.
4.2 TCP SYN Flood Attack Detection
C2 is a set of algorithms to detect TCP SYN flood attacks based on specific features of TCP SYN flood attacks. These specific features are as follows:
1. Sign 1: MemW in TCP SYN Flood Attacks shows a sudden increase. 2. Sign 2: R(SYN), R(ACK) and R(SYN+ACK) are somehow related to each
other in the case of SYN Flood Attacks and normal situations, as shown in Figure 2 and will be explained shortly.
3. Sign 3: NPi in TCP SYN Flood Attacks shows a sudden increase. 4. Sign 4: NPo in TCP SYN Flood Attacks shows a sudden increase. 5. Sign 5: NHOP in TCP SYN Flood Attacks shows a sudden increase.
In an observation, the values for each sign can either be zero or one, depending on the condition defined in each sign. However, for Sign 2, we can have different numbers, from -3 to +3, depending on the different occurrence (shown in Figure 2) of the different equations defined in the following:
• Equation 1: R(SYN)= 2R(SYN+ACK)
• Equation 2: R(ACK)+R(SYN+ACK)= Total number of samples’ packet • Equation 3: R(SYN)+ R(SYN+ACK) ≥ Total number of samples’ packet • Equation 4: R(ACK)= R(SYN+ACK)
Figure 2 is used to calculate the value of Sign 2. For instance, if only Equations 1 and 2 are true, then the value for Sign 2 will be considered -3; if only one of the Equations 1 and 2 is correct, then the value of the Sign 2 will be -1. These values will be used later in the above equations to detect attack probability. In general, a negative state parameter means that this parameter shifts the traffic to a normal one; therefore, it decreases the probability of the attack.
Fig. 2 The relevancy of network packet counts and their ratio to the Attack/Normal states (used in Sign 2)
4.3 Database Attack Detection
Similar to an HTTP Attack, when a virtual machine applies for more resources and sends its requests to the hypervisor, the hypervisor must inspect the VM that sent the requests, as well as the VMs that communicated with that VM, and must then check the below states. If the hypervisor finds the below states in the behavior of VMs, there is a Database Attack in that VM, and the hypervisor should not allocate more resources to that VM. The states that specify a Database Attack are almost the opposite of the HTTP Attack’s states.
C3 is a set of algorithms to detect Database Attacks based on specific features of Database Attacks. This algorithm uses the following signs to detect the attack:
1. Sign 1: TSP in Database Attacks shows a sudden increase 2. Sign 2: IOWi in Database Attacks is much smaller than IODI. 3. Sign 3: IOWo in Database Attacks is much smaller than IODO. 4. Sign 4: CPUW in Database Attacks is much smaller than CPUD.
The State parameter for the sign p in this attack is defined as SDB,p. For the
sign p in a Database Attack, SDB,pis equal to 1 if the sign meets and is equal
to 0 if the sign does not meet.
4.4 Attack Detection Formula
After calculating each of the above-defined signs, we use the following formula to determine with what probability our VM under investigation is in the attack state.
Therefore, we can calculate the Ave (t-1) using the formula shown in Equa-tion 4: W (t) = Pn p=1Stp Pn p=1Smaxtp (4)
In the Equation 4, t represents the type of attack, n is the number of conditions, p represents the sign number, Stp is the value of Sign p in attack t, and W(t)
is the probability of attack.
5 Evaluation and Discussion
In our prototype implementation, we allocate one VM to the web server and another VM to the database server and try to extract metrics that have been explained in previous sections. Finally, metrics of the new arrival traffic will be given to our model as an input, and the proposed model will detect the situation of this traffic. In this section, we present our setup environment, discuss our detection results, and compare our model with previous works in order to evaluate the performance of our proposed model.
5.1 Setup Configuration
We used QEMU (version 2.0.0-rc1), which is a common and open-source ma-chine emulator and virtualization mama-chine, to have VMs based on KVM. We considered one of the VMs as a webserver virtual machine and ran a webserver on it. Apache 2.2 and MySQL 5.6.16 have been used as our web and database servers. We performed an Http attack and a Database attack separately by using HTTPFlooder1and LoadRunner2, consecutively.
We measured Network I/O and the number of packets per second by using IPTraf, which is a tool for monitoring network statistics. Vnstat is also used for measuring the different amount of bandwidth usage. Memory usage and CPU usage are monitored by using Top command. The command that we used for monitoring the number of half open-connections was netstat. Moreover, we used LTTng (Linux Tracing Toolkit Next Generation) [17] for sampling and collecting packet information from traffic. The details of collecting data from LTTng and modeling them at multiple levels to be used for advance attack analysis can be found at [32, 29].
Based on the result of the detection algorithm, if one of the aforementioned three attacks is detected with a high percentage, allocating the resources will be limited; otherwise, resources will be allocated to VM. The critical value of the attack percentage to make a decision depends on the sensitivity of the system. For a more sensitive system, even attacks with a low percentage cause the limiting of resources. We evaluate our system using two criteria: metric and accuracy, both of which we will explain in the following sections.
5.2 Metrics Evaluation
In order to evaluate the efficiency of our metrics, we need to test and compare them with C1, C2, and C3 without performing our detection model. One option is using a machine-learning algorithm for evaluating our metrics. We are going to determine the percentage of correctly classified traffic when a machine-learning algorithm uses our metrics and compare it with the cases when the machine-learning algorithm uses C1, C2 or C3 metrics.
For this purpose, we have selected two popular machine-learning algorithms for our framework: Support Vector Machine (SVM) and Neural Network, as can be seen in Figure 1. These two algorithms have been widely used in pre-vious works related to the security concept, especially in DDoS attacks, either in cloud computing [18–21] or in old networks (non-virtualization) [22]. We evaluated our metrics based on 2 criteria: Percentage of correct classification and time.we also compare 2 machine learning algorithms that was introduced in the literature based on that 2 criteria. We have tested our framework, and the results will be discussed in two parts: Neural Network and Support Vector Machine (SVM).
1 https://code.google.com/p/httpflooder/wiki/Usage
5.2.1 Neural Network Machine Learning
WEKA is a learning workbench that helps in using different machine-learning algorithms for different real-word problems [23]. We choose a Neural Network algorithm for classification; Accordingly, our profile has been imple-mented and trained to WEKA. Multilayer-Perception is a function in WEKA that represents a Neural Network. We have configured the Neural Network and trained it with a set of samples (65% of our data), all of which include the previously explained 18 features (X1 to X18). Afterward, we have tested the algorithm using the rest of the samples (35% of our data), all of which also include 18 features. As a result, the Neural Network could precisely classify traffic in 0.46 seconds, in which 97.06% of traffic has been correctly classi-fied and only 2.94% has been incorrectly classiclassi-fied. Figure 3 demonstrates the model that the Neural Network created based on our profile features in the abovementioned time.
Fig. 3 Our model by using Neural Network
Figure 4 shows a comparison between our framework performance and the performance of the above three categories by using the Neural Network algorithm.
Fig. 4 Evaluating our framework when using Neural network
As is clear in Figure 4, our framework has a much higher percentage of correctly classified attacks and a much lower incorrectly classified attack. Fur-thermore, the first and most important advantage of our model is that we
are able to detect all three types of attacks in our framework, whereas other algorithms can only detect one type of attack.
5.2.2 Support Vector Machine
Similar to previous sections of this paper, we again used the WEKA tool, but this time we implemented and trained our profile by using Support Vector Machine (SVM). SMO is a function in WEKA that represents SVM. We have configured the Support Vector Machine similar to what has been done in the Neural Network configuration and trained it with a set of samples (65% of data) with 18 features (X1 to X18); afterward, we have tested the algorithm by using the rest of the samples (35% of data) with 18 features. This time, SVM perfectly classified traffic without any incorrectly classified traffic within only 0.17 seconds.
We have again compared our framework with C1, C2, and C3 algorithms but this time based on the Support Vector Machine in order to evaluate the performance of our framework in SVM. The result of this comparison is shown in Figure 5. Based on Figure 5, it is completely clear that the performance of
Fig. 5 Evaluating our framework when using SVM
our framework is much better than C1, C2, and C3.
We conclude that the Support Vector Machine had better performance in classification and is also less costly in the case of response time. Therefore, using the Support Vector Machine as a machine-learning algorithm for the Decision Unit tool will be much faster and more secure than using the Neural Network.
5.3 Accuracy Evaluation
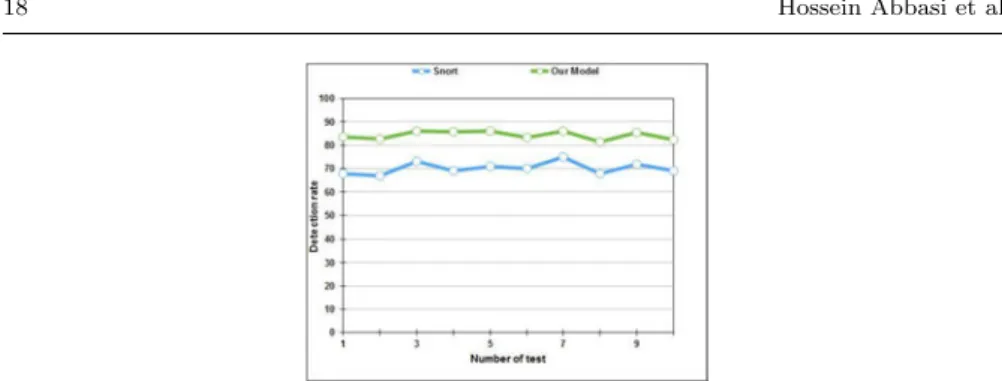
In order to evaluate the accuracy of our algorithm, we tested our detecting model and compared it with previous works. For this purpose, we choose Snort [24]. Snort is a free and open-source intrusion detection system (IDS) that can perform real-time traffic analysis and detect the attacks [21]. The result showed that our model works with a higher rate of correct detection compared to a previous IDS like Snort. Figure 6 shows the result of comparison between the rate of correct detection in our model and in Snort IDS. As is clear in Figure
Fig. 6 Comparison with Snort with comparing the correct detection rates
6, the rate of correct detection in our model approximately averages about 85 %. However, the average of the rate of correct detection in snort is roughly 70%. In view of the above result, we can conclude that the accuracy of our detection model is reliable and highly acceptable.
5.4 Limitations
Although our algorithm is highly reliable and extremely accurate in detecting all three mentioned attacks, it does have a limitation. If the Database Attack and HTTP Attack occur simultaneously in the system, the traffic and resource usage are very similar to heavy and busy traffic in normal situations. Therefore, the accuracy of detection will degrade in this case. However, the possibility of having these two attacks concurrently in the system is very low and almost negligible, which is why we ignored this situation in our assumptions.
6 Conclusion and Future Work
In the framework of this paper, we discussed security, which is a big concern in cloud computing and EDoS, a kind of DDoS attack and one of the most important attacks in the cloud environment.
The first important step for confronting these attacks is detecting them. For successfully finding the attacker and determining the prevention system against this attack, the most important step is to design a good framework for attack detection with approximately 100% reliability.
In this work, we proposed a novel framework for detecting different types of EDoS attacks. The results of our evaluation showed that we could detect different types of attacks perfectly and precisely without any incorrectly clas-sified traffic by using the Support Vector Machine. This precise detection can be considered as a kind of defense itself, as the services will be provided only to VMs that are in a normal situation; therefore, we prevent the migration of attacks from VM to the hypervisor. This is a temporary defense for the sys-tem until a permanent solution is found in the future. We also showed that the
accuracy of having a single framework for detecting different types of EDoS attacks at the same time is better than having a separate framework for each attack.
Actually in this work we demonstrated that the metrics of one kind of attack play an important role to detect another type and vice versa.We con-sidered a nominate for each general types of attacks that we introduced in the paper. Thus, HTTP attack represented Bandwidth–consuming attacks; Attacks that target specific applications represented by Database attack in this work and TCP SYN Flood attack was a nominate for Connection–layer exhaustion attacks in this paper. So this work can be further expanded to find features for other attacks in addition to HTTP Attacks, Database Attacks, and TCP SYN Flood Attacks. A very interesting elaboration on this work would be to allocate weights to the metrics and then to design a machine-learning algorithm that can automatically predict and detect other types of attacks using this expanded model. Also, access to real-world network traffic was limited in this work and the evaluation of the work under real network traffic will be addressed in a feature work.
References
1. J.Geelan, Twenty-One Experts Define Cloud Computing. Virtualization Journal, 2009. 2. Bogdanoski, M.S., T. Risteski, A., Analysis of the SYN Flood DoS Attack. Computer
Network and Information Security 2013(MECS).
3. VivinSandar, S. and S. Shenai, Economic Denial of Sustainability (EDoS) in Cloud Services using HTTP and XML based DDoS Attacks. International Journal of Computer Applications, 2012.
4. Mell, P. and T. Grance, The NIST Definition of Cloud Computing 2011, National In-stitute of Standards and Technology.
5. Furht, B. and A. Escalante, Handbook of Cloud Computing. 2010: Springer. 634. 6. Hsin-Yi, T., et al., Threat as a Service?: Virtualization’s Impact on Cloud Security. IT
Professional, 2012. 14(1): p. 32-37.
7. Shea, R. and L. Jiangchuan. Understanding the impact of Denial of Service attacks on Virtual Machines. in Quality of Service (IWQoS), 2012 IEEE 20th International Workshop on. 2012.
8. Sqalli, M.H., F. Al-Haidari, and K. Salah. EDoS-Shield - A Two-Steps Mitigation Tech-nique against EDoS Attacks in Cloud Computing. in Utility and Cloud Computing (UCC), 2011 Fourth IEEE International Conference on. 2011.
9. Naresh Kumar, M., et al. Mitigating Economic Denial of Sustainability (EDoS) in Cloud Computing Using In-cloud Scrubber Service. in Computational Intelligence and Com-munication Networks (CICN), 2012 Fourth International Conference on. 2012. 10. Alosaimi, W. and K. Al-Begain. An Enhanced Economical Denial of Sustainability
Miti-gation System for the Cloud. in Next Generation Mobile Apps, Services and Technologies (NGMAST), 2013 Seventh International Conference on. 2013.
11. Masood, M., et al. EDoS Armor: A cost effective economic denial of sustainability attack mitigation framework for e-commerce applications in cloud environments. in Multi Topic Conference (INMIC), 2013 16th International. 2013.
12. Baig, Z.A. and F. Binbeshr. Controlled Virtual Resource Access to Mitigate Economic Denial of Sustainability (EDoS) Attacks against Cloud Infrastructures. in Cloud Com-puting and Big Data (CloudCom-Asia), 2013 International Conference on. 2013. 13. Al-Haidari, F., M.H. Sqalli, and K. Salah. Enhanced EDoS-Shield for Mitigating EDoS
Attacks Originating from Spoofed IP Addresses. in Trust, Security and Privacy in Com-puting and Communications (TrustCom), 2012 IEEE 11th International Conference on. 2012.
14. Koduru, A., T. Neelakantam, and S.M. Saira Bhanu. Detection of Economic Denial of Sustainability Using Time Spent on a Web Page in Cloud. in Cloud Computing in Emerging Markets (CCEM), 2013 IEEE International Conference on. 2013.
15. NSFOCUS, Bandwidth Consumption DDoS Attacks and Mitigation Methods. 2013: NSFOCUS.
16. http:en.wikipedia.orgwikiMoving average Exponential moving average. 14 Oct 2014. 17. Desnoyers, M., Dagenais, M., LTTng: Tracing across execution layers, from the
hyper-visor to user-space. , in Proceedings of the Ottawa Linux Symposium. 2008.
18. Defending Networks with Incomplete Information: A Machine Learning Approach. 2013, BlackHat Briefings.
19. Subbulakshmi, T., et al. Detection of DDoS attacks using Enhanced Support Vector Machines with real time generated dataset. in Advanced Computing (ICoAC), 2011 Third International Conference on. 2011.
20. Joshi, B., A.S. Vijayan, and B.K. Joshi. Securing cloud computing environment against DDoS attacks. in Computer Communication and Informatics (ICCCI), 2012 Interna-tional Conference on. 2012.
21. Nguyen, T.T.T. and G. Armitage, A survey of techniques for internet traffic classification using machine learning. Communications Surveys & Tutorials, IEEE, 2008. 10(4): p. 56-76.
22. Shon, T. and J. Moon, A hybrid machine learning approach to network anomaly detec-tion. Information Sciences, 2007. 177(18): p. 3799-3821.
23. Holmes, G., A. Donkin, and I.H. Witten. WEKA: a machine learning workbench. in Intelligent Information Systems,1994. Proceedings of the 1994 Second Australian and New Zealand Conference on. 1994.
24. J. Choi, C. Choi, B. Ko, and P. Kim, ”A method of DDoS attack detection using HTTP packet pattern and rule engine in cloud computing environment,” Soft Comput., vol. 18, pp. 1697-1703, 2014.
https://code.google.com/p/httpflooder/wiki/Usage
25. Ezzati-Jivan, N. and Dagenais, M. R. (2015), Cube data model for multilevel statis-tics computation of live execution traces. Concurrency Computat.: Pract. Exper., 27: 1069–1091. doi: 10.1002/cpe.3272.
26. Mitko Bogdanoski, Tomislav Suminoski, and Aleksandar Risteski. Analy-sis of the syn flood dos attack.International Journal of Computer Networkand Information Security (IJCNIS), 5(8):1–11, 2013.
27. Dainius Ceponis and Nikolaj Goranin. Towards a robust method of datasetgeneration of malicious activity on a windows-based operating system foranomaly-based hids training. 2018.
28. K Geetha and N Sreenath. Syn flooding attackidentification and analysis.InInformation Communication and Embedded Systems (ICICES), 2014International Conference on, pages 1–7. IEEE, 2014.
29. Verge A, Ezzati-Jivan N, Dagenais MR. Hardware-assisted software event tracing. Con-currency Computat: Pract Exper. 2017;29:e4069. https://doi.org/10.1002/cpe.4069 30. A. Koduru, T. Neelakantam, and M. S. B. S.Detection of eco-nomic denial of
sustain-ability using time spent on a web pagein cloud.In2013 IEEE International Conference on CloudComputing in Emerging Markets (CCEM), pages 1–4, Oct 2013.
31. V. Nigam, S. Jain, and K. Burse. Profile based scheme against ddosattack in wsn. In2014 Fourth International Conference on Communi-cation Systems and Network Technolo-gies, pages 112–116, April 2014.
32. Ezzati-Jivan N, Dagenais MR. Multi-scale navigation of large trace data, A survey. Concurrency Computat: Pract Exper. 2017;29;e4068.
33. V Venkata Ramana, P Shilpa Choudary, and Maya B Dhone. Analysis and study of application layer distributed denial of service attacks for popularwebsites.International Journal of Computer Science and Telecommuni-cations, 2, 2011.
34. R. Shea and J. Liu. Performance of virtual machines under networked de-nial of service attacks: Experiments and analysis.IEEE Systems Journal,7(2):335–345, June 2013. 35. Chengxu Ye and Kesong Zheng. Detection of application layer distributeddenial of
ser-vice. InComputer science and network technology (ICCSNT),2011 International Con-ference on, volume 1, pages 310–314. IEEE, 2011.