HAL Id: hal-03163005
https://hal.archives-ouvertes.fr/hal-03163005
Submitted on 9 Mar 2021
HAL is a multi-disciplinary open access
archive for the deposit and dissemination of
sci-entific research documents, whether they are
pub-lished or not. The documents may come from
teaching and research institutions in France or
abroad, or from public or private research centers.
L’archive ouverte pluridisciplinaire HAL, est
destinée au dépôt et à la diffusion de documents
scientifiques de niveau recherche, publiés ou non,
émanant des établissements d’enseignement et de
recherche français ou étrangers, des laboratoires
publics ou privés.
Interactive demo: visualization for Bitcoin mining pools
analysis
Natkamon Tovanich, Nicolas Soulié, Nicolas Heulot, Petra Isenberg
To cite this version:
Natkamon Tovanich, Nicolas Soulié, Nicolas Heulot, Petra Isenberg. Interactive demo: visualization
for Bitcoin mining pools analysis. ICBC 2021 : IEEE International Conference on Blockchain and
Cryptocurrency, May 2021, Sydney (Virtual Conference), Australia. �hal-03163005�
Interactive Demo: Visualization for
Bitcoin Mining Pools Analysis
Natkamon Tovanich
IRT SystemX and Universit´e Paris-Saclay, LISN
Palaiseau, France
Nicolas Souli´e
Universit´e Paris-Saclay, Univ Evry, IMT-BS, LITEM Evry-Courcouronnes, France [email protected]
Nicolas Heulot
IRT SystemX Palaiseau, France [email protected]Petra Isenberg
Universit´e Paris-Saclay, CNRS, Inria, LISN Gif-sur-Yvette, France [email protected]Abstract—We demonstrate an interactive visualization tool to analyze Bitcoin mining pools. The tool allows analysts to see the evolution of mining pools distribution over time and relationships with external variables, i.e., Bitcoin statistics and news headlines. Moreover, we also display information about pool hopping among mining pools to help understand the internal dynamics of miners. Index Terms—Bitcoin, Bitcoin mining, mining pools, pool hopping, visual analytics
I. INTRODUCTION
Bitcoin mining is a critical activity that keeps the whole Bitcoin system secure, valid, and stable. Mining pools have emerged to ensure that the Bitcoin system keeps running while allowing miners to benefit from their service through a more stable and predictable income. We developed an interactive visualization tool to help economists explore the emergence and evolution of mining pools. The tool has several new features of potential interest to both Bitcoin practitioners and researchers.
II. DATAPREPARATION
For our tool, we extracted multiple measurements about individual mining pools, mining reward distributions, and external data from difference data sources. The data is publicly available at [1] (except 3 and 4).
1) Mining pools: We tagged each coinbase transaction with a mining pool based on the coinbase string patterns and known pool addresses from [2]–[4]. We aggregated each mining pool’s monthly statistics, e.g., market share, hash rate, and total reward in BTC and USD.
2) Mining pool descriptions: We tracked the characteristics of mining pools from the edit history in the Bitcoin Wiki [5]. We then manually validated the data with the discussion of mining pools in the Bitcointalk forum. 3) Bitcoin network statistics: We obtained the Bitcoin
statistics data (e.g., market price, transaction volume, and total hash rate) from Blockchain.info and averaged the statistics for each month.
This research work has been carried out under the leadership of the Institute for Technological Research SystemX, and therefore granted with public funds within the scope of the French Program Investissements d’Avenir.
This is the author’s version of the article that will appear in 2021 IEEE International Conference on Blockchain and Cryptocurrency (ICBC).
4) Bitcoin news: We crawled the list of news headlines in the Press forum of Bitcointalk. We used spaCy text processing and STTM short text topic modeling [6] libraries to group news into distinct topics.
5) Pool hopping: We derived a method to track the number of miners who participated in multiple mining pools (“cross-pooling” miners) and calculated the reward they received for each pool [7]. We calculated the total reward of cross-pooling miners associated between mining pools over a time interval.
III. INTERACTIVEVISUALIZATIONTOOL
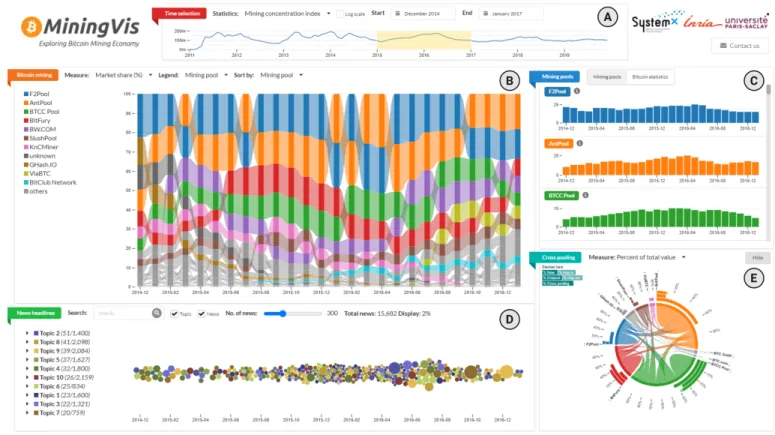
The interactive visualization tool, as displayed in Fig. 1, consists of five coordinated components: (A) a time filter view, (B) a mining statistics view, (C) a detail view, (D) a Bitcoin news view, and (E) a cross pooling view.
A. The time filter view is a line chart showing Bitcoin statistics over time from 2011 when the first known mining pool was detected. Different statistics can be selected and shown and then the time filter can be used to drill down to a time period of interest. Once a time range has been selected, the tool will update all other views to the selected time interval.
B. The Bitcoin mining distribution viewis the main view for exploring the emergence and evolution of the Bitcoin mining pools. It presents the temporal distribution of mining pools as a ribbon chart—a stacked bar chart showing with ribbons connecting the same mining pool over time. Each mining pool is represented as a bar whose height is relative to the measurement (i.e., hash rate, market share, or total reward) in a month. The color indicates categorical data (i.e., mining pool, payout scheme, or location). Users can select the configurations of the chart on the top panel. The bars are sorted by the total measurement of the category from the highest to the lowest value for each month. Within each category, pools are sorted by their measurement. This sorting helps us to identify large mining pools or categories that dominated mining power. Ribbons help to track a mining pool’s ranking connection between months. Analysts can select mining pools on the left panel or drag the brush along the x and y axes to highlight a range of time and mining pools.
C. The detailed viewshows the mining statistics as separate bar charts for each mining pool. This panel allows analysts to
Fig. 1. A screenshot of the interactive visualization tool for Bitcoin mining analysis. (A) The time filter view allows analysts to select a time interval to apply to the mining pool distribution views. (B) The mining distribution view shows the evolution of the mining pools as a ribbon chart. (C) The detailed view shows individual bar charts for each mining pool. (D) The Bitcoin news view displays a swarm plot of the distribution of news over time. (E) The cross pooling view shows a chord diagram representing the total reward of cross pooling miners among mining pools at the time interval.
explore each mining pool’s evolution in detail that is difficult to detect in the ribbon chart. Each bar chart also includes a dual y-axis to show pool fees and the background color to indicate whether the mining pool keeps transaction fees to itself or shares among miners. Analysts can toggle this view to look at a list of multiple Bitcoin statistics variables. Using the Bitcoin statistics view, a viewer can discover the statistics that may correlate with the mining distribution evolution.
D. The Bitcoin news viewdisplays the distribution of Bitcoin news as a swarm plot over the time selected above—a scatter plot in which the position of circles is adjusted to avoid overlap. Each news article is represented as a circle. The color of a circle encodes the topic, while the size is proportional to the news’s importance. To relate generated hypotheses or questions regarding mining distribution with a plausible explanation, analysts can type in search terms for relevant news, hover on a circle to see the headline and click on it to open the link to the news. Analysts can select topics to show in the news list panel on the left panel. They can also drill down on the topic to see the top-10 keywords to get an idea of the topic model. E. The cross pooling view shows cross pooling statistics during a given time interval and presents it as a chord diagram. Each pool is represented as an arc in the circle. The arc length indicates the relative amount of mining reward paid to miners for each pool. Each edge contains a flow encoding the total amount of cross-pooling between two pools. In this diagram,
analysts can detect mining pools that have many miners cross pooling with other pools and then assess the impact on mining pool distribution. The outer bar charts indicate the average percentage of miners who enter, exit, hop in, hop out, and cross pool per month for each mining pool.
IV. FUTUREWORK
We are conducting an online user study with Bitcoin miners and analysts to evaluate the usability of the tool. We are also planning to publish the tool online in the future.
REFERENCES
[1] N. Tovanich, N. Souli´e, N. Heulot, and P. Isenberg, “Dataset: An empirical analysis of pool hopping behavior in the bitcoin blockchain,” Dec. 2020. [Online]. Available: https://doi.org/10.5281/zenodo.4342747 [2] M. Romiti, A. Judmayer, A. Zamyatin, and B. Haslhofer, “A deep dive
into bitcoin mining pools: An empirical analysis of mining shares,” arXiv preprint arXiv:1905.05999, 2019.
[3] Blockchain.info, “Blockchain known pools,” 2020. [On-line]. Available: https://raw.githubusercontent.com/blockchain/ Blockchain-Known-Pools/master/pools.json
[4] BTC.com, “Blockchain known pools,” 2020. [Online]. Available: https: //raw.githubusercontent.com/btccom/Blockchain-Known-Pools-BCH/ master/pools.json
[5] Bitcoin Wiki contributors, “Comparison of mining pools,” 2020. [Online]. Available: https://en.bitcoin.it/wiki/Comparison of mining pools [6] J. Qiang, Y. Li, Y. Yuan, W. Liu, and X. Wu, “STTM: A tool for short
text topic modeling,” arXiv preprint arXiv:1808.02215, 2018.
[7] N. Tovanich, N. Souli´e, N. Heulot, and P. Isenberg, “An empirical analysis of pool hopping behavior in the bitcoin blockchain,” in IEEE International Conference on Blockchain and Cryptocurrency (ICBC). IEEE, 2021.