• Aucun résultat trouvé

Growing hierarchical self-organizing map for alarm filtering in network intrusion detection systems

N/A
N/A
Protected

Academic year: 2021

Partager "Growing hierarchical self-organizing map for alarm filtering in network intrusion detection systems"

Copied!
7
0
0

Texte intégral

(1)

HAL Id: hal-00412943

https://hal.archives-ouvertes.fr/hal-00412943

Submitted on 17 Apr 2020

HAL is a multi-disciplinary open access

archive for the deposit and dissemination of

sci-entific research documents, whether they are

pub-lished or not. The documents may come from

teaching and research institutions in France or

abroad, or from public or private research centers.

L’archive ouverte pluridisciplinaire HAL, est

destinée au dépôt et à la diffusion de documents

scientifiques de niveau recherche, publiés ou non,

émanant des établissements d’enseignement et de

recherche français ou étrangers, des laboratoires

publics ou privés.

Growing hierarchical self-organizing map for alarm

filtering in network intrusion detection systems

Ahmad Faour, Philippe Leray, Bassam Eter

To cite this version:

Ahmad Faour, Philippe Leray, Bassam Eter. Growing hierarchical self-organizing map for alarm

filter-ing in network intrusion detection systems. NTMS’07, 2007, Paris, France. pp.CDROM,

�10.1007/978-1-4020-6270-4_58�. �hal-00412943�

(2)

Growing Hierarchical Self-Organizing Map for

Alarm Filtering in Network Intrusion Detection

Systems

Ahmad FAOUR

INSA of ROUEN Laboratoire LITIS Email: ahmad.faour@ul.edu.lb

Philippe Leray

INSA of ROUEN Laboratoire LITIS Email: pleray@insa-rouen.fr

Bassam Eter

Lebanese University Laboratoire LPM Email: beter@ul.edu.lb

Abstract— It is a well-known problem that intrusion detection

systems overload their human operators by triggering thousands of alarms per day. This paper presents a new approach for handling intrusion detection alarms more efficiently. Neural Network analyses based on the self-organizing map (SOM) and the growing hierarchical self-organizing map (GHSOM) are used to discover interrest patterns signs of potential scenarios of attacks aiming each machine in the network. The GHSOM addresses two main limits of SOM which are caused, on the one hand, by the static architecture of this model, as well as, on the other hand, by the limited capabilities for the representation of hierarchical relations of the data. The experiments conducted on several logs extracted from the SNORT NIDS, confirm that the GHSOM can form an adaptive architecture, which grows in size and depth during its training process, thus to unfold the hierarchical structure of the analyzed logs of alerts.

I. INTRODUCTION

With the ever growing deployment of networks and the Internet, the importance of network security has increased. Over the past ten years, the number as well as the severity of network-based computer attacks have significantly increased [1]. As a consequence, classic computer security technologies such as authentication and cryptography have gained in im-portance. Simultaneously, intrusion detection has emerged as a new and potent approach to protect computer systems [2], [3]. In this approach, so-called Intrusion Detection Systems

(IDSs) are used to monitor and analyze the events occurring in a computer system. Recently, we have witnessed many theoretical and semi-practical approach to use data mining technology in the area of intrusion detection [4]. The gov-erning approach was to use data mining algorithms to detect anomalies that represent intrusions, or attacks. There was an attempt to use data mining as a replacement for existing intrusion detection techniques. However, except for specific areas there is no practical implementation of this approach. The main reason being that existing technologies suffice for detecting intrusions, and, that data mining does not provide enough context to serve as an intrusion detection tool. Regard-less of the development in the Security Information area, there is still a huge problem with existing tools. For both signature based and behavioral rules approach, most of the rules are too

generic. The consequence is that although these tools detect all intrusions, they detect much more than that. This problem, known as false positives, is a big barrier for intrusion detection tools to cross before their deployment can be practical. To date, security experts, are struggling with an inherent conflict and are sometimes forced to write less adequate detection rules just to reduce the number of false positives. In this paper we suggest a different approach for using data mining technology in the intrusion detection area. We claim that the best positioning for a data mining technology within an intrusion detection system is not as a detection engine, but rather as an analysis layer that will filter out the false positives. In our past researches [?], [?], we proposed an automatic process that consists of two steps. The first step aims at grouping similar standard behavior for external machines with destination to internal machines using clustering algorithms like self-organizing maps [5]. The second step uses these information for determining if the network is really attacked and filter out the false positives using probabilistic tools like Bayesian Networks [6]. The SOM has shown to be exceptionnally successful in arranging high-dimensional input data along its two-dimensional output space such that similar inputs are mapped onto neighboring regions of the map. In other words, the similarity of the input data is preserved as faithfully as possible within the representation space of the SOM. Despite the large number of research reports on application of the SOM [?] some deficiencies remained largely untouched. First, the SOM uses a static network architecture both in terms of number and arrangement of neural processing elements, which have to be defined prior to the start of training. Second, hierarchical relations between the input data are rather difficult to detect in the map display. So far, both issues are have been addressed seperately by means of adaptive architectures, e.g. the Growing Grid [?], or hierarchies of independent SOMs, e.g. the Hierarchical Feature Map [?] or the Tree-structured SOM[?].

In this paper, we propose a neural network model, namely the Growing Hierarchical Self-Organizing Map (GHSOM)[7], that addresses both deficiencies as outlined above within one framework. Basically, this neural network model is composed

(3)

of independent SOMs, each of which is allowed to grow in size during the training process until a quality criterion regarding data representation is met. This growth process is further continued to form a layered architecture such that hierarchical relations between input data are further detailed at lower layers of the neural network.

The outline of this paper is as follows. Section 2 gives an overview of the limitation of the intrusion detection systems and discusses related works. Section 3 gives a breif overview of our approach proposed in [?]. in which we used SOM, and compare it by GHSOM. Section 4 shows the experiments and the obtained results and finally section 5 concludes and presents our future works and perspectives.

II. NETWORKINTRUSIONDETECTION SYSTEMS

The NIDS (Network Intrusion Detection System), software created to detect the abnormal activities on the network, generally function by signatures, on the same principle of anti-virus softwares [8]. The known attacks are indexed in signature databases and each time that an activity resembles one of these attacks, an alarm is generated. When a new exploit (successful intrusion attempt) is detected, an adapted signature will be added to the signature database. Another approach, sometimes used jointly with the preceding one, is a statistical approach. During a training phase (i.e., adjustment of the parameters of the statistical model), the NIDS learns a standard profile (number of exchanged packets, volume of flow, numbers of connections, etc. . . ) from the network and alarms the administrator when the traffic deviates this profile. The main problem that the administrators discover when they install a NIDS is the huge amount of generated alarms (false positives). On an average size network (one or two public classes C), several thousands of alarms are generated daily making almost impossible the analysis of the results. The consequence is that the administrator has to seriously increase his tolerance level, which will lead it to miss many real problems and to make it possible to an advanced intruder to make successfully of a sufficiently discrete attack not to be detected a whole. In fact, the NIDS is not able to judge relevance, gravity and correlation of the alarms. It generates so much alarms which it will be very difficult to detect the serious problems between all alarms.

A. Related work

The intuitively most appealing way of dealing with false positives is to build ”better” IDSs, which trigger less false positives. This is a challenging endeavor because false posi-tives are the result of multiple problems. Examples of IDSs that are less prone to false positives include the embedded detectors technology by [9], a lightweight tool for detecting Web server attacks by [10], and a network-based IDS that focuses exclusively on low-level network attacks [11].

Recently, there have been several proposed techniques for filtering the alarms issued by the NIDS. All these techinques used post-processing methods that uses the alarms as input and try to give the administrator the dangerous alarms and filter

NIDS Temporal pre-processing Aggregation IPext, IPint Spatial pre-processing Standard Behaviors / IPint Classification Log files (alerts) Network Data Attack ?

Fig. 1. General description of our approach

out the rest. Alarm correlation systems [12], [?], [13], [14], [?] try to group alarms so that the alarms of the same group pertain to the same type (e.g., the same attack). In that way, they offer a more condensed view on the security issues raised by an IDS [15]. These techniques can be classified in three general categories: (a) Alert Clustering ([?], [?]): they use probabilistic-based reasoning to correlate alerts by measuring and evaluating the similarities of alert attributes. (b) Matching

predefined attack scenarios: Debar and Wespi [13] apply backward and forward reasoning techniques to correlate alerts with duplicate and consequence relationship. Morin and Debar [16] apply chronicle formalism to aggregate and correlate alerts. The approach performs attack scenario pattern recog-nition based on known malicious event sequences. The main limitation of this approach is that it rely on various forms of predefined knowledge of attack conditions and consequences. They cannot recognize a correlation when attack is new. (c)

Prerequisties / consequences([17], [18], [19], [20], [20]): They build alert correlation systems based on matching the pre-/post-conditions of individual alerts. The idea of this approach is that prior attack steps prepare for later ones. Therefore, the consequences of earlier attacks correspond to the prerequisites of later attacks. The correlation engine searches alert pairs that have a consequence and prerequisite matching. One challenge to this approach is that a new attack cannot be paired with any other attacks because its prerequisites and consequences are not defined.

III. OUR APPROACH

The goal of our system is starting from the alarms generated by a NIDS, and filtering these alarms to determine if there were an attack on the network during a fixed lapse of time. Our system is composed of three components showed in figure 1 and detailed in [?].

By considering that a scenario of attack consists of a serie of events proceeding in an interval of time, we start by making a synthesis of alarms generated by the NIDS in a fixed temporal window. This synthesis gives us a summary of the behavior of all the external machines IPext (potentially attacking) to all

the internal machines IPint (potentially attacked). The logs

used in our experiments contain 406 different types of alerts generated by SNORT [21]. At the end of this phase, we obtain

(4)

a summary [window IPext IPint N alert1. . . N alert406] of

the behavior of each internal machine in our network gathered for each external machine in connection. To take account of the average traffic of each internal machine we proposed to normalize the data.

In the second part (special prerocessing), we work starting from the number of alarms of each type generated for each couple (IPext , IPint), by supposing that this vector is

a representative behavior of each IPext in connection to

each IPint. On the basis of the principle that this behavior

can be similar for several external machines connecting to one or more internal machines, we will use a technique of unsupervised classification to cluster these behaviors in a given number of behavior-types. We used a self-organizing map [5] as clustering algorithm. The quality of clustering using SOM are mainly influenced by three essential parameters: (1) size of the map, (2) initialization of weights (codebook vectors) and (3) neighborhood functions.

However, the use of SOM requires to define a priori these three parameters of the map. For choosing the best parameters several validation measures are proposed [22], among which we used the Davies-Bouldin index (DB). The DB index will have a small value for a good clustering. After the choice of the best SOM, we proceed according to two approaches. In the first approach (Approach1), we made a synthesis[window IPint dist2clust1. . . dist2clustn]

of the sum of the distance for every vector (IPext, IPint) to

the behavior-types (clust1. . . clustn) detected for each IPint

independently of IPext in a mobile window of time. In the

second approach (Approach2), for every IPint, we made a

synthesis of the number of behavior-types detected bound for this IPint in a temporal window. By this way, we obtain a

synthesis [window IPint N Bof clust1. . . N Bof clustn] of

the behavior-types (clust1. . . clustn) detected for each IPint

independently of IPext to be able to compare the profile of

two different internal machines.

The synthesis of the behavior-types calculated for every IPint is supposed to be representative of the various types

of potential attacks aiming each internal machine of the network during a fixed window of time. We propose in the last phase (clustering) to use these information to determine if the network were really attacked (ATT = true or f alse). To implement this task of classification, we tested two supervised classifiers; the Bayesian networks [23], [24] and the SVM [?]. IV. THEGROWINGHIERARCHICAL SELF-ORGANIZING

MAP

The Growing Hierarchical Self-Organizing Map (GHSOM) [?], which is an extension to the growing grid SOM [?] and hierarchical SOM [?], can build a hierarchy of multiple layers where each layer consists of several independent growing SOMs. The size of these SOMs and the depth of the hierarchy are determined during its learning process according to the requirements of the input data. As depicted in Fig. 2, the GHSOM architecture is similar to a tree structure where the SOM(s) at each layer can branch out to additional SOMs at the

& %

Basic steps for horizental growth:

1) Initialize the weight vector of each neuron with random values. 2) Perform the traditional SOM learning algorithm for a fixed

number λ of times.

3) Find the error unit e and its most dissimilar neighbor unit d. (Note that the error unit e is the neuron with the largest deviation between its weight vector and the input vectors it represents.)

4) Insert a new row or a new column between e and d. The weight vectors of these new neurons are initialized as the average of their neighbors.

5) Repeat steps 2 − 4 until the mean quantization error of the map M QEm< τ1∗ qeuwhere qeu, is the quantization error of

the neuron u in the preceding layer of the hierarchy. Basic steps of hierarchical growth:

1) Check each neuron to find out if its qei> τ2∗ qe0, where qe0

is the quantization error of the single neuron of Layer 0, then assign a new SOM at a subsequent layer of the hierarchy. 2) Train the SOM with input vectors mapped to this neuron.

TABLE I

Basic steps of the horizontal growth and the hierarchical growth of the GHSOM.

subsequent layer. The upper layers show a coarse organization of the major clusters in the data, whereas the lower layers offer a more detailed view of the data.

For the initial setup of the GHSOM, at Layer0, a single-neuron SOM is created and the single-neuron’s weight vector is initialized as the average of all input vectors. Then, the learning process starts at Layer1 with a small SOM (usually a 22 grid) whose weight vectors are initialized to random values. The GHSOM grows in two dimensions: horizontally (by increasing the size of each SOM) and hierarchically (by increasing the number of layers). For horizontal growth, each SOM modifies itself in a systematic way very similar to the growing grid [12] so that each neuron does not represent too large an input space. For hierarchical growth, the principle is to periodically check whether the lowest layer SOMs have achieved sufficient coverage for the underlying input data. The basic steps of the horizontal growth and the hierarchical growth of the GHSOM are summarized in Table I.

The growth process of the GHSOM is controlled by the following four important factors.

• The quantization error of a neuron i, qei, is calculated

as the sum of the distance between the weight vector of neuron i and the input vectors mapped onto this neuron.

• The mean quantization error of the map (M QEm) is the

mean of all neurons’ quantization errors in the map.

• The threshold τ1 is for specifying the desired level of

detail that is to be shown in a particular SOM.

• The threshold τ2 is for specifying the desired quality

of input data representation at the end of the learning process.

V. BEHAVIOR TYPES DISCOVERY BY THEGHSOM In order to exemplify some of the differences between the SOM and the GHSOM clustering models, the unsupervised classification problem described in Section III is retaken.

(5)

We work starting from the number of alarms of each type generated for each couple (IPext , IPint) in the temporal

preprocessing phase, by supposing that this vector is a repre-sentative behavior of each IPext in connection to each IPint.

Starting from the principle that this behavior can be similar for several external machines connecting to one or more internal machines, we used GHSOM for clustering these behaviors into a number of behavior-types. The number of behavior-types is not defined a priori like the case of SOM, but determined dynamically during the process of the creation of the map. As it is well known, the resulting map is governed by the two parameters (τ1 and τ2). Generally, the values for τ1 and τ2

are chosen such that 0 < τ2 << τ1 < 1. The choice of the

parameter τ2 is not critical as it is possible to set it to values

smaller than necessary and to decide after the training process how many layers are sufficient. On the other hand, τ1 leads

to decisions which cannot be undone at later stages without retraining the GHSOM. Setting τ1 to small values will lead

to small maps and a deep hierarchy, while large values will result in large maps with a flat hierarchical structure. Usually the user will train and manually evaluate several maps until an appropriate value for τ1 is estimated.

For the interpretation of the obtained maps, we admit the following suppositions:

• the codebook vector of each cluster is a representative of

the data projected in this cluster.

• for each codebook vector we determine the most

signif-icant variables (for instance, the first top 5 variables). As each variable corresponds to one specific alarm, we obtain the characteristic alarms of each cluster.

• every data projected in a cluster is classified as the more

frequent situation also projected in the same location during the learning phase.

VI. EXPERIMENTS AND RESULTS

A. Description of the Data

We work starting from log files issued from SNORT NIDS. These files contain 32031 alarms generated over a duration of 20 days from 20/11/2004 to 10/12/2004. These alarms correspond to 4638 external machines trying to connect 288 internal machines. Alarms generated during these 20 days are of 406 different types and include 16 real attacks scenarios, some are of a few minutes, others lasting several days and the other are for normal scenario. The scenarios of attack are distributed as 4 scenarios brute force on POP3, 3 scenarios

crawler Web, 2 scenarios Web IIS, 2 scenarios scanner of

vulnerability, 1 scenario IIS attack against apache server, 3 scenarios brute force against FTP server and 1 scenario SNMP

attack. After implementing the temporal pre-processing phase we decomposed the base in one learning base and one testing base. The learning base contains 10 scenarios of attacks and the testing base contains six scenarios of attacks.

To choose the best couple of the values of (τ1, τ2), we

launched a set of experiments varying these two parameters and calculating the percentage of detection of the attacks (detection rate) and the percentage of the ”false positive”.

B. Quantitative Analysis

1) Horizental Expansion: We started by fixing the pa-rameter τ2 = 0.03, and varying the parameter τ1 between

0.4 > τ1 > 0.1 to study the influence of the horizontal

expansion of the map. The results obtained for the application of the GHSOM on the learning data and validation data are presented in the tables II and III.

TABLE II

THE OBTAINED RESULTS FORτ2= 0.03ET0.4 > τ1> 0.1FOR THE LEARNING DATA.

τ1 τ2 Detection Rate False Positive

0.4 0.03 88% 6.56% 0.3 0.03 95.2% 7.3% 0.2 0.03 95.2% 13% 0.1 0.03 95.2% 13%

TABLE III

THE OBTAINED RESULTS FORτ2= 0.03ET0.4 > τ1> 0.1FOR THE VALIDATION DATA.

τ1 τ2 Detection Rate False Positive

0.4 0.03 88% 10% 0.3 0.03 96% 8.4% 0.2 0.03 96% 8.7% 0.1 0.03 96% 8.7%

2) Hierarchical Expansion: To study the influence of the vertical expansion (hierarchical) of the map in the represen-tation of the structure of the data, we fix this time τ1 = 0.3

and we vary τ2between0.01 and 0.03. The smallest is τ2, the

deeper will be the hierarchy. The results obtained are presented in the tables IV and V. The best the result is obtained for the couple of value (τ1= 0.3, τ2= 0.01).

TABLE IV

THE RESULTS OBTAINED FORτ1= 0.3AND0.03 > τ2> 0.01IN THE

LEARNING DATA.

τ1 τ2 Detection Rate False Positive

0.3 0.03 95.2% 7.3% 0.3 0.02 96.4% 7.38% 0.3 0.01 96.4% 4%

TABLE V

THE RESULTS OBTAINED FORτ1= 0.3AND0.03 > τ2> 0.01IN THE VALIDATION DATA.

τ1 τ2 Detection Rate False Positive

0.3 0.03 96% 8.4% 0.3 0.02 96% 4.7% 0.3 0.01 96% 4.7%

From the obtained results, we can notice the influence of the refinement of the map by the degradation of the value of the parameter τ2. Indeed, for τ2 = 0.03, the obtained

map consists of only one level map with 132 clusters. The ”false negative” was equal to 4.8% and the ”false positive”

(6)

was equal to 7.3%. The cluster (18) classified as ”normal” contains 1.2% of the vectors belonging to the scenario of attack 9. These vectors are drowned between normal data projected in this cluster and consequently they are not detected and are regarded as (false negative). The degradation of τ2

from0.03 → 0.02, gave the birth of two maps (children) from two clusters (18 and 68) of the initial map. The first map (child) contains90 clusters and the other contains 12 clusters (figure 2). This hierarchical extension permitted the isolation the attacks vectors of scenario 9 into one cluster classified as attack in the new map. Consequently the detection rate of attacks is increased to 96.4%.

Fig. 2. Hierarchical expansion of the map obtained by decreasing the value of τ2 from 0.03 → 0.02.

In the same way the degradation of τ1 from 0.02 → 0.01

caused the addition of 3 new maps (children) in the second level. These 3 new maps are projected starting from the cluster 130 which is classified as ”attacks” and which contains 3.33% of the ”normal” data hidden between the vectors ”attacks” of the scenario 10 projected in this cluster (see figure 3). This projection made it possible to separate the normal data from the attack’s data and to distribute them on a great number of new clusters classified all as ”normals”, and to distribute the vectors of new scenarios10 into two clusters classified as ”attacks”. This way of expansion or refinement decreased the ”positive false” of 3.38% (see table IV).

Fig. 3. Hierarchical expansion of the map obtained by decreasing the value of τ2 from 0.02 → 0.01.

TABLE VI

THE PROJECTION OF ATTACK SCENARIOS WITH THETOP(1)

CARACHTERISTIC OF EACH CLUSTER. Scnario Type of

Sce-nario Cluster TOP(1) 1 access page denied 121 Attack-responses 403 forbidden 3 brute force POP3 123 Incorrect Password POP 5 brute force FTP 27 Access FTP test 8 vulnerability scanner

122 WEB-IIS mem bin access 9 brute force FTP 28 Access FTP admin 10 SNMP attack 130 SNMP request tcp1 11 brute force FTP 27 Access FTP test 14 brute force POP3

114 Incorrect User POP3

C. Qualitative Analysis

The qualitative analysis makes it possible to measure the quality of the clusters obtained during the phase of clustering. As we mentioned in the section V, each cluster is caracterized by the first top 5 variables of its codebook vector. The table VI show the caracteristics of the some clusters and the scenarios projected in it.

The scenarios 5 and 11 are two brute force attacks against FTP server. They are projected in the cluster 27. As we can see in the table, the top(1) carachteristics of this cluster is ”Access FTP test” which is sign of this type of attacks. Another example is the scenario 10 which is a SNMP attack. This scenario is projected in the cluster 130 of which the top(1) is ”SNMP request tcp”, and so on. As a result, 90% of the scenarios are projected in clusers of which the top(1) characteristic is sign of these scenarios and100% of scenarios obtained top(3).

VII. CONCLUSION

The major advantages of the GHSOM model over the standard SOM are the following. First, the overall training time is reduced since only a necessary number of units are developed to organize the data at a certain level of detail. Second, the GHSOM uncovers the hierarchical structure of the data, allowing the user to understand and analyse a large amount of data in an exploratory way. Each SOM array in the hierarchy explains a particular set of characteristics of data. This makes the GHSOM analysis an excellent tool for feature extraction and classification. Third, the size of the SOM array does not have to be specified subjectively before hand.

In this work, we presented the application of the GHSOM for filtering the alarms issued by a network intrusion detection system. The results obtained demonstrate that GHSOM is very suitable to this kind of problems and can overpass SOM. The

(7)

table VII presents a summuray of the best results obtained by SOM and GHSOM.

TABLE VII

THE RESULTS OBTAINED BYGHSOMANDSOM. Model DR FP Top(1) Top(3) Top(5) GHSOM 96% 4.7% 90% 100% 100% SOM 70% 15% 33% 83% 83%

REFERENCES

[1] J. Allen, A. Christie, W. Fithen, J. McHugh, J. Pickel, and E. Stoner, “State of the practice of intrusion detection technologies,” Carnegie Mellon University, Tech. Rep., 2000.

[2] R. Bace, Intrusion Detection. Macmillan Technical Publishing, 2000. [3] H. Debar, M. Dacier, and A. Wespi, “A revised taxonomy for intrusion detection systems,” Annales des T´el´ecommunications, Tech. Rep. 55(7-8), 2000.

[4] W. Lee, “Applying data mining to intrusion detection: the quest for automation, efficiency, and credibility,” SIGKDD Explor. Newsl., vol. 4, no. 2, pp. 35–42, 2002.

[5] T. Kohonen, Self-Organizing Maps, 3rd ed., ser. Series in Information Sciences. Berlin: Springer, 2001, vol. 30.

[6] F. V. Jensen, An introduction to Bayesian Networks. London, United Kingtom: Taylor and Francis, 1996.

[7] D. M. Michael Dittenbach, Andreas Rauber, “Uncovering hierarchical structure in data using the growing hierarchical self-organizing map,”

Neurocomputing, vol. 48, no. 1-4, pp. 199–216, October 2002.

[8] J. Zimmermann, L. M, and C. Bidan, “Introducing reference control for intrusion detection at the os level,” in Proceedings of the 5th

International Symposium on the Recent Advances in Intrusion Detection, I. Network and D. S. S. S. N. 2000), Eds. Springer Verlag, 2002, pp. 157–170.

[9] D. Zamboni, “Using internal sensors for computer intrusion detection,” Ph.D. dissertation, Purdue university, 2001.

[10] M. Almegren, H. Debar, and M. Dacier, “A lightweight tool for detect-ing web server attacks,” in Network and Distributed System Security

Symposium (NDSS 2000), 2000, pp. 157–170.

[11] R. Sekar, Y. Guang, S. Verma, and T. Shanbhag, “A high performance network intrusion detection system.” in 6th ACM Conference on

Com-puter and Communications Security, 1999, pp. 8–17.

[12] F. Cuppens, “Managing alerts in a multi-intrusion detection environ-ment,” in In 17th Annual Computer Security Applications Conference

(ACSAC), 2001, pp. 22–31.

[13] H. Debar and A. Wespi, “Aggregation and correlation of intrusion alerts.” in In 4th Workshop on Recent Advances in Intrusion Detection (RAID

2001), L. S. Verlag, Ed., Berlin, 2001, pp. 85–103.

[14] S. Staniford, J. Hoagland, and J. McAlernay, “Practical automated detection of stealthy portscans,” in ACM Computer and Communications

Security IDS Workshop, 2000, pp. 1–7.

[15] K. Julish and M. Dacier, “Mining intrusion detection alarms for action-able knowledge,” in 8th ACM International Conference on Knowledge

Discovery and Data Mining, 2002, pp. 366–375.

[16] B. Morin and H. Debar, “Correlation of intrusion symptoms: An application of chronicles.” in RAID, 2003, pp. 94–112.

[17] P. Ning, Y. Cui, and D. Reeves, “Constructing attack scenarios through correlation of intrusion alerts.” in In 9th ACM Conference on Computer

and Communications Security., November 2002.

[18] F. Cuppens and A. Mige, “Alert correlation in a cooperative intrusion detection framework.” in In proceedings of the 2002 IEEE Symposium

on Security and Privacy, Oakland, CA, May 2002, pp. 202–215. [19] S. Cheung, U. Lindqvist, and M. W. Fong, “Modeling multistep cyber

attacks for scenario recognition,” in In proceedings of the third DARPA

Information Survivability Conference and Exposition (DISCEX), Wash-ington, D.C., April 2003.

[20] P. Ning, D. Xu, C. Healey, and R. Amant, “Building attack scenarios through integration of complementary alert correlation methods.” in In

proceedings of the 11th Annual Network and Distributed System Security Symposium (NDSS’04)., San Diego, CA, February 2004.

[21] M. Roesch, “Snort - lightweight intrusion detection for networks,” in

Proceedings of Thirteenth Systems Administration Conference (LISA ’99), 1999, pp. 229–238.

[22] G. W. Milligan and M. C. Cooper, “An examination of procedures for determining the number of clusters in a data set,” Psychometrika, 1985. [23] P. Leray and O. Francois, “R´eseaux bay´esiens pour la classification -m´ethodologie et illustration dans le cadre du diagnostic m´edical,” Revue

d’Intelligence Artificielle, vol. 18/2004, pp. 169–193, 2004.

[24] J. Pearl, Probabilistic Reasoning in Intelligent Systems: Networks of

Figure

Fig. 1. General description of our approach
TABLE III
Fig. 2. Hierarchical expansion of the map obtained by decreasing the value of τ 2 from 0
table VII presents a summuray of the best results obtained by SOM and GHSOM.

Références

Documents relatifs

Using prob- abilistic topological algorithms in a rst stage allow to summarize the initial data set into a smaller set of codebook vectors which can be clustered us- ing a

Current state of the art in robotic assistance for surgical procedures [1,2] has a considerable potential for augmenting the precision and capability of physicians,

“SOMbrero: an r package for numeric and non-numeric self- organizing maps,” in Advances in Self-Organizing Maps and Learning Vector Quantization (Proceedings of WSOM 2014),

To process such kind of data unsupervised learning algorithms, such as Self Organizing Maps (SOM) or Growing Neural Gas (GNG), are usually used.. Various aspects of

Parallel modification, Growing Neural Gas with pre-processing by Self Organizing Maps, and its implementation on the HPC cluster is presented in the paper.. Some experimental

This paper deals with the reclamation of industrial land in the context of the current brownfield initiatives supporLed by the Environmental Protection

CONCLUSION—A changing waist affected cardio-metabolic risk factors, and this was most clearly seen for the metabolic syndrome, which accumulates the effects of

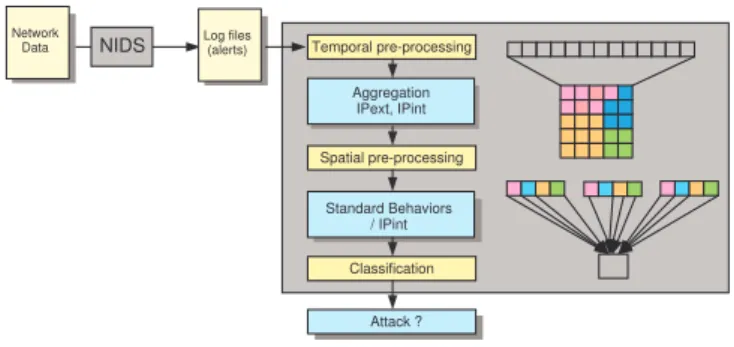
The second layer in the hierarchy consists of another SOM which clusters the activity tra- jectories of the first-layer SOM and thus it learns to represent action prototypes