HAL Id: hal-01006826
https://hal.archives-ouvertes.fr/hal-01006826
Submitted on 3 Mar 2017
HAL is a multi-disciplinary open access
archive for the deposit and dissemination of sci-entific research documents, whether they are pub-lished or not. The documents may come from teaching and research institutions in France or abroad, or from public or private research centers.
L’archive ouverte pluridisciplinaire HAL, est destinée au dépôt et à la diffusion de documents scientifiques de niveau recherche, publiés ou non, émanant des établissements d’enseignement et de recherche français ou étrangers, des laboratoires publics ou privés.
Evolution of internal stresses in rolled Zr702α
David Gloaguen, Marc François, Ronald Guillen, Jean Royer
To cite this version:
David Gloaguen, Marc François, Ronald Guillen, Jean Royer. Evolution of internal stresses in rolled Zr702α. Acta Materialia, Elsevier, 2002, 50 (4), pp.871-880. �10.1016/S1359-6454(01)00380-9�. �hal-01006826�
Evolution of internal stresses in rolled Zr702
α
D.
Gloaguen
a,
M. François
b,
R. Guillen
a,
J. Royer
caLaboratoire d’Applications des Materiaux a` la Mecanique—LAMM, I.U.T. Nazaire, C.R.T.T., B.P 406, 44602 Saint-Nazaire cedex, France
bLaboratoire des Syste`mes Mecaniques et d’Ingenierie Simultanee (LASMIS), Universite de Technologie de Troyes, 11 rue Marie Curie, BP2060, 10010 Troyes, France
cLaboratoire Mecanique et Materiaux (LMM), Ecole Centrale de Nantes, 1 rue de la Noe¨, BP92101, 44321 Nantes cedex 03, France
Internal stresses due to anisotropic thermal and plastic properties were investigated in a rolled Zirconium-α. The thermal stresses induced by a cooling process were predicted using a self-consistent model and compared with experi-mental results obtained by X-ray diffraction. The study of the elastoplastic response during uniaxial loading was perfor-med along the rolling and the transverse direction of the sheet, considering the influence of the texture and the thermal stresses on the mechanical behaviour. We used an elastoplastic self-consistent formulation and the predicted results are compared with mechanical tests. The role of twinning and slip on the development of internal stresses is also discussed.
Keywords Zirconium; Elastoplastic self-consistent model; Internal stresses; Thermal anisotropy; X-ray diffraction (XRD)
1. Introduction
Zirconium alloys are widely used in the nuclear industry because they exhibit high resistance to corrosion, good thermal conductivity and a low neutron cross section. They have a hexagonal close packed structure at room temperature. These alloys present anisotropic thermal, elastic and plastic properties at mesoscopic (grain) and macroscopic levels. These properties and the crystallographic
texture explain the appearance and the develop-ment of internal stresses when an elastoplastic deformation is introduced. Two types of internal stresses can be distinguished:
—Thermal internal stresses, which may arise from thermal anisotropy. During the cooling process after a heat treatment, each grain is sub-jected to a contraction which depends on crys-tallographic direction. Elastic strain (and this stress) must be present to maintain the compati-bility of total strain between adjacent grains —Mechanical internal stresses, induced by the elastoplastic anisotropy and the requirement of compatibility.
Both kinds of stresses depend on crystallographic texture. Thermal stresses can modify the macro-scopic elastoplastic response of the material, parti-cularly for Zirconium alloys. Ortiz et al. [1,2] evaluated these stresses in a textured Zr sheet using a self consistent model and they compared them with experimental results obtained by X-ray dif-fraction. They showed that thermal residual stresses produce apparent (“measured”) macro-scopic stresses that can amount 20% of the yield stress of the material. Several authors [3–7] perfor-med a systematic analysis of the response of rolled Zircaloy-2 under mechanical loading (tensile and/or compression). They used neutron diffraction techniques in conjonction with a self consistent or a Taylor model. They showed that the plastic ani-sotropy in both rolling and transverse directions can be attributed to the texture. The residual stresses can explain the stress differential (difference between the yield stresses along the rol-ling and tranverse directions) in tension and com-pression and the difference in the elastoplastic tran-sition when Zircaloy-2 is deformed.
The purpose of the present work is to make a more complete study concerning the development and the evolution of residual strain introduced by tensile tests in rolled textured polycrystalline Zr-α after a cooling process. A self consistent model of elastoplastic deformation was used to simulate the thermal and the tensile response of samples tested along the rolling and the transverse directions of the sheet. The theoretical stresses will be compared with the experimental results obtained by X-ray diffraction and from mechanical tests. The role played by the texture on the development of internal stresses during the cooling process will be analysed. For the calculation of internal stresses during the thermal treatment, we will compare two assumptions: independence of the elastic and ther-mal constants with the temperature and depen-dence of these constants with the temperature. The results predicted by the self consistent model will be discussed. In particular, twinning is treated as a directional deformation system and the reorien-tation by slip and twinning is accounted for in our calculation.
2. Experiments
2.1. Mechanical behaviour
In the present study, a cold rolled sheet of indus-trial grade Zirconium (Zr702α) is considered. It presents equiaxed grains with an average grain size of 20 µm. Its chemical composition is given in Table 1.
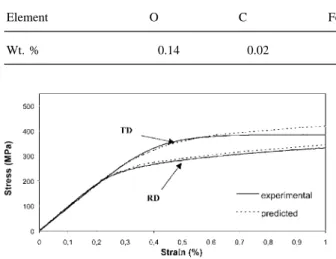
To analyse the influence of loading direction and texture on the mechanical response of the material, tensile samples were cut from the rolling and the transverse directions of the sheet. The specimens were submitted to uniaxial tensile tests at room temperature, at a constant strain rate of 3.8×10⫺3 s⫺1and up to 1% of total strain. The experimental stress–strain curves are plotted on Fig. 1.
2.2. Stress analysis
Even after annealing at room temperature, the material is not stress free at a mesoscopic (grain) scale, due to the anisotropy of thermal behaviour. The thermal residual stresses in the undeformed sample were evaluated using X-ray diffraction technique. After a thermal treatement at 650°C during 4.5 h, strain measurements have been car-ried out on a D500 SIEMENS goniometer with a Cr Kαradiation. An⍀ goniometric assembly with a scintillation detector were used. Two plane famil-ies were studied: {101¯4} at 2q⫽ 156.7° and {202¯2} at 2q⫽ 137.2°. Diffractograms were recorded for fifteen tilt angles⌿ varying between ⫺45 and 45°and for azimuth anglesf⫽ 0, 45 and 90°. The direction f⫽ 0° corresponds to the rol-ling direction. The X-ray beam output collimator had 0.5 mm diameter and a diffracted-beam slit limits the equatorial divergence to an angle of 0.6°. Peak position is determined by the half value bre-adth. The stress was obtained from the sin2⌿
relation using the macroscopic elasticity constants. Because of the low mesoscopic elastic anisotropy, ef⌿ vs sin2⌿ curves for a given family of
dif-fracting planes {hkil} can be represented by straight lines (Fig. 5). In this case, the XEC can be treated as those corresponding to an isotropic material. The sample shows a typical texture of rolled Zirconium. The basal poles are preferentially
Table 1
Chemical composition of Zirconium sheet
Element O C Fe+Cr H N Hf
Wt. % 0.14 0.02 0.08 ⬍0.0003 0.004 0.4
Fig. 1. Experimental and calculated stress–strain curves for tension in the Rolling Direction and Transverse Direction of the sample.
oriented at an angle of 32°from the normal direc-tion towards the transverse direcdirec-tion, while the prism poles exhibit a weak maximum at the rol-ling direction.
The experimental data from the mechanical tests and X-ray diffraction are presented and compared with the results from our model in the third and fourth sections.
3. Self consistent model
In accordance with self consistent models that were used previously for the prediction of thermal [6,10] and tensile deformations [8,9], we consider that thermal contractions do not introduce plastic deformation in the material during the cooling pro-cess [1,2]. In this case, a thermoelastic formulation is sufficient to simulate the evolution of thermal stresses associated with cooling. An elastoplastic self-consistent scheme is then used to predict the mechanical behaviour of zirconium polycrystal under an uniaxial tension.
The self consistent model is based on the follow-ing assumptions:
앫 Each grain is considered as a spherical inclusion
embedded in a Homogeneous Effective Medium (HEM) having the average properties of the aggregate.
앫 The mesoscopic stress s and the mesoscopic straine in the inclusion are homogeneous. 앫 The overall response of the material is
determ-ined from averaging the microscopic terms (s, e) over a representative set of orientations. 앫 The macroscopic stress ⌺ and macroscopic
strain E are considered as uniform. The proper-ties of the medium are initially undetermined and must be solved by iterations. Each grain is treated as an inhomogeneity with elastic (c) and thermal (a) constants, slip and twin mechanisms characteristic of a single crystal.
앫 The texture is known, the polycrystal is rep-resented by a weigthed discrete distribution of orientations (Euler angles (j1fj2)). Lattice
rotation (reorientation by slip and twinning) and texture changes are incorporated in the model. We present succinctly the model used for our simu-lations. More details can be found in references [6,8–10].
3.1. Simulation of cooling process
When the polycrystal is subjected to a uniform temperature increment rate T˙ and a macroscopic stress rate ⌺˙, the total strain rate in each grain is given by:
e˙⫽ s..s˙ ⫹ aT˙ (1)
where s is the elastic compliance tensor of the sin-gle crystal.
And for the polycrystal:
E˙ ⫽ S..⌺˙ ⫹ MT˙ (2)
where M is the macroscopic thermal tensor and S, the overall elastic compliance of the polycrystal.
Fig. 5. Thermal residual strains vs sin2⌿ for (10.4) and (20.2)
diffracting planes at room temperature. 쐌 (10.4) diffracting plane—experimental results; 왖 (20.2) diffracting plane— experimental results; ——— predicted results obtained using the self-consistent approach.
In terms of stress rate, we have the following equations:
s˙ ⫽ c..(e˙⫺aT˙) and ⌺˙ ⫽ C..(E˙⫺MT˙). (3) Strain and stress rate tensor are linearly linked by [10]:
s˙⫺⌺˙ ⫽ ⫺C..(I⫺Sesh)..Sesh⫺1..(e˙⫺E˙) (4)
⫽ B..(e˙⫺E˙)
where Sesh is the Eshelby tensor, calculated from the macroscopic compliances.
The determination of the thermo-elastic proper-ties associated with the cooling process can be for-mulated as follows:
앫 The aggregate is subjected to thermal variations (cooling process) without external loading (⌺˙ ⫽ 0).
앫 No macro or mesoscopic plastic deformation takes place during the cooling process. Using Eqs. (3) and (4), the strain and stress in each grain induced by a uniform temperature increment are given by:
s˙⫽ (B⫺1⫺s)⫺1..(a⫺M)T˙
and (5)
e˙⫽ (c⫺B)⫺1..(c..a⫺B..M)T˙.
The macroscopic thermal moduli M can also be calculated:
M⫽ 具(c⫺B)⫺1..C典⫺1..具(c⫺B)⫺1..c..a典. (6) The unknowns are tensor M and tensor C. C is determined using the well-known implicit equation [10]: C⫽ 具c..[I ⫹ Sesh..C⫺1..(c⫺C)]⫺1典. I is the
fourth order identity tensor. Furthermore, we can completely characterize the mechanical state of each grain for a temperature increment and describe the evolution of thermal residual stresses during a cooling process through Eqs. (5) and (6).
3.2. Simulation of mechanical loading
Plastic deformation takes place when a slip or a twinning system becomes active. Slip (or twinning) occurs if the resolved shear stress tg on a system
g is equal to the critical valuetg
cand if the system
tg⫽ Rgr..s⫽ tg
cand Rg..s˙ ⫽ t˙gc (7)
where Rg is the Schmidt tensor on a system g.
The stress rate s˙ is linearly linked to the total strain rate e˙ by an elastoplastic consistent tangent moduli tensor l:
s˙ ⫽ l..e˙. (8)
The tensor l has the form:
l⫽ c..Rh..(Rg..c..Rh⫹ Hgh)⫺1..Rg..c (9)
where c is the elastic stiffness of the single crystal and H the hardening matrix. This tensor depends on active systems, elastic properties, stress rate and deformation history of the grain.
At the macroscopic level, the relation between the macroscopic stress rate and strain rate is given by a similar relation as (8):
⌺˙ ⫽ L..E˙ (10)
L is the consistent tangent overall elastoplastic ten-sor.
The relations between local and global strains and stresses can be expressed through:
s˙ ⫽ l..(I ⫹ Sesh
..L⫺1..⌬l)⫺1..L⫺1..⌺˙
and (11)
e˙⫽ (I ⫹ Sesh..L⫺1..⌬l)⫺1..E˙ where ⌬l ⫽ l⫺L.
Seshis calculated assuming the grain as a spheri-cal inclusion embedded to the homogeneous matrix. It is important to note that Seshis calculated at each increment from the components of the tan-gent overall elastoplastic tensor L.
The volume averages of the local stress and strain tensors must coincide with the overall strain and stress. After some algebraic calculations, these conditions give the overall elastoplastic tensor L as a weighted average of the mesoscopic tensor l: L⫽ 具l..[I ⫹ Sesh..L⫺1..⌬l]⫺1典. (12)
Eq. (12) is a non-linear implicit equation because Seshdepends on the unknown L. The Eshelby ten-sor is calculated by an integral equation [9] that taking into account the plastic anisotropy. This equation is solved by iteration. Once L is known, by specifying an overall stress or strain, the model
can give the corresponding stress or strain tensors for each orientation. Therefore, we can describe the mechanical response of the polycrystal.
4. Experimental and model results
4.1. Thermal stresses
The first step of our work is to simulate the evol-ution of thermal residual stresses when the material is cooled from the annealing temperature to room temperature. We suppose the sample is stress-free at 923 K [1]. The texture was introduced in the model by a set of 1000 grains characterized by Euler angles and weights which represent their vol-ume fraction. The single crystal elastic tensor used in the model are listed in Table 2 and the dilatation tensor at room temperature is [3]: a11⫽ a22⫽
5.70×10⫺6K⫺1anda33⫽ 11.40×10⫺6K⫺1.
We predict the evolution of thermal stresses as a function of temperature for different diffracting planes:
—{101¯4}, {202¯2} which are the planes studied by X-ray diffraction
—{0002} and {101¯0} are, respectively, the basal and the prismatic planes. These planes are interested to study because they generally have an opposite behaviour in term of strain values. To analyse the influence of texture on the thermal response of the aggregate, two types of texture are considered in this work: an isotropic texture and the experimental one.
Although the thermal and elastic coefficients depend on temperature, several authors [2,5] use coefficients which are independent with tempera-ture. To investigate this problem, we have con-sidered successively two assumptions:
Table 2
Zirconium single-crystal stiffnesses [11]
C11 C12 C13 C33 C44 C66
(GPa) (GPa) (GPa) (GPa) (GPa) (GPa)
앫 Independence of cij and aij with temperature.
The values are given in Table 2.
앫 Variation of cij and aij with temperature. The
elastic constants measured by Fisher et al. [12] and the thermal expansion coefficients measured by Goldak et al. [13] are used. The temperature dependence of these constants can be described by a polynomial relation as proposed by Turner et al. [6].
Fig. 2 shows the residual stress evolution obtained using the elastic self consistent method with the assumptions discussed above. The temperature dependence of the elastic and thermal constants accounts for the non-linear evolution of the experi-mental curves observed by Mac Ewen et al. [3]. With the second assumption, this non-linear evol-ution can be obtained (the first shows a linear behaviour). Different strains values at room tem-perature have been obtained using the two assump-tions. The difference is stronger for a textured material than for an isotropic one. It can reach as much as 18 to 28% or 40 to 400 microstrains according to the studied plane. Fig. 2 clearly shows
Fig. 2. Predicted thermal residual strains for different planes withy⫽ 0°andf⫽ 0°using:䉬, experimental texture, independence of c anda with T;䊐, experimental texture, dependence of c and a with T; 왕, isotropic texture, independence of c and a with T;
×, isotropic texture, dependence of c anda with T.
the influence of crystallographic texture on strain evolution: the predicted values and even their sign vary strongly with the texture. The normal direc-tion to {101¯4} plane is in tracdirec-tion with an isotropic texture and in compression with the experimental texture. The prismatic plane is always under com-pressive strains while the basal plane is under ten-sile strains for any texture. These results agree with previous experimental results on rolled Zircaloy-2 [3,5]. The diagonal componentss22ands33of the
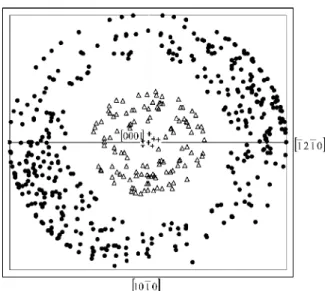
stress tensor in every grain are plotted in Fig. 3 as a function of the angle ⌿ between the c-axis and the Normal Direction (ND). These values are expressed in crystal axes and correspond to values obtained at room temperature. The prismatic planes are in compression and the basal planes are in trac-tion. Stress values are symmetric with respect to ⌿ ⫽ 90° because of orthotropic symmetry. These values are high: 30% of the grains have component s33higher than 80 MPa and components22lower
than ⫺50 MPa. The grains with ⌿ close to 90° have high stress values. This behaviour can be clearly seen on a stereographic projection of
Fig. 3. Diagonal componentss22(왕) and s33(䊊) calculated
in every grain as a function of the angle⌿ at room temperature using experimental texture.
{0002} pole (Fig. 4). The macroscopic thermal ani-sotropy explains this phenomenon. At macroscopic level, the contraction in the ND is greater than in the other directions. At mesoscopic level, grains are subjected to high contraction in the c direction. Consequently, the grains with ⌿ close to 90° induce more residual elastic strains to maintain compatibility between adjacent grains. Stress values obtained are always lower than the yield limit (⬍200 MPa) and thus, it justifies the assump-tion made in Secassump-tion 3 that thermal contracassump-tions do not introduce plastic deformation in the material
Fig. 4. Stereographic projection of (0002) pole for grains with
s33⬎ 100 MPa (쐌) or s22⬍ ⫺30 MPa (왕) (experimental
texture).
during the cooling process. The predicted thermal expansion coefficients of the polycrystal associated to the isotropic and experimental texture are respectively at room temperature: a11⫽ a22⫽ a33⫽ 7.629×10⫺6K⫺1anda11⫽
5.163×10⫺6K⫺1,a22⫽ 5.463×10⫺6K⫺1,a33⫽
7.031×10⫺6K⫺1.
Using the self consistent formulation, we simu-lated residual thermal strains versus sin2⌿ for the
{101¯4} and {202¯2} diffracting planes. These strains can be represented by a straight line A⫹
B sin2⌿ (Fig. 5). The predicted results are
presented in Table 3.
The values of A must be independent off. This fact enables the estimation of the numerical pre-cision of our calculations. We can express A values in term of stress with the XEC (determinated by an elastic self consistent model for an isotropic material). The standard deviation varies from 1.6 to 2.1 MPa with the studied plane. The choice of 1000 orientations is justified by this low disper-sion.
Predicted results were compared with experi-mental data using X-ray diffraction method. The experimental strain values are determined using the following expression:
ejy⫽ ⫺
1
2cotangq0(2qjy⫺2q0)
whereq0is the Bragg angle for a stress-free
speci-men andqf⌿is the measured Bragg angle.
Conse-quently, it was necessary to determinate the stress-free lattice parameters of the sample to calculate the thermal strains. Because of strains induced by thermal anisotropy, these parameters cannot be measured directly. One solution [2] is to find the stress-free parameters a0 and c0 which minimize
the difference between experimental data and pre-dict strains for the two studied planes. With this method, we found the following values:
a⫽ 3.2365 A˚ and c ⫽ 5.1498 A˚
or
2q0{101¯4}⫽ 156.240°and 2q0{202¯2}⫽ 136.896°.
For the sake of comparison, the values obtained with the best fit by Ortiz et al. for Zirconium-α are: a⫽ 3.2325 A˚ and c ⫽ 5.1464 A˚.
Table 3
Predicted A and B coefficients for {101¯4} and {202¯2} diffracting planes
Plane {202¯2} Plane {101¯4}
f⫽ 0° f⫽ 45° f⫽ 90° f⫽ 0° f⫽ 45° f⫽ 90°
A (×103) ⫺0.84200 ⫺0.84225 ⫺0.83294 ⫺0.02101 ⫺0.02388 ⫺0.03577
B (×103) 1.15022 1.03106 0.93470 1.17819 1.00939 0.87753
A (MPa) 231.9 231.4 228.8 5.8 6.5 9.8
order of 4×10⫺3 A˚ . It should be noted that, except for the stress-free lattice parameters a and c, not any parameter of the model was fit on experiments. Fig. 5 shows the experimental (solid circles and triangles) and predicted (full line) thermal strains versus sin2⌿
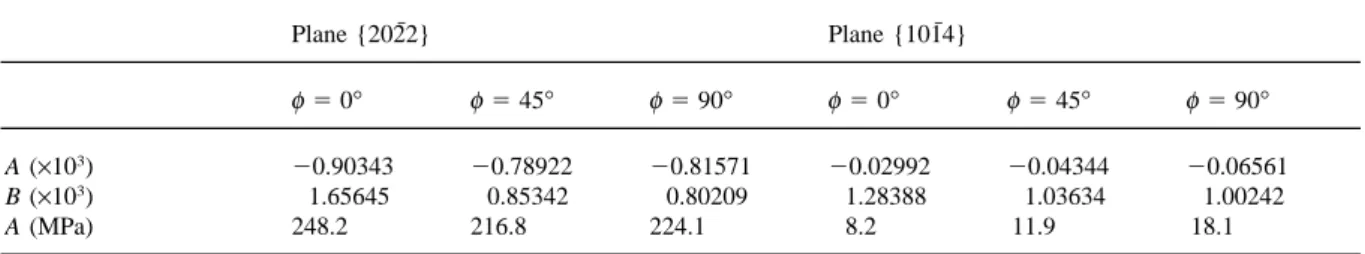
curves for {101¯4} and {202¯2} diffracting planes. Table 4 gives the experimental coefficients A and B expressed in terms of strain and stress. The quadratic difference between the predicted and experimental values is 24 MPa and 11 MPa for {202¯2} and {101¯4} planes. Compared with the uncertainty on experiments (16 MPa) and modelization (2 MPa), this difference is reasonable.
If we consider an isotropic texture, stress values in each grain are: 35% of the grains have compo-nents33higher than 100 MPa and component s22
lower than ⫺50 MPa. Stress values vary weakly with⌿ because of the isotropic texture. The slope of ef⌿ versus sin2⌿ is close to 0. The effect of
thermal stresses is only represented by a translation of the interceipt of the straight lines: B⫽
0.00079 for {101¯4} plane and ⫺0.00028 for {202¯2} plane.
It should be noted that the slope of 2q (or ef⌿)
versus sin2⌿ is not related to any macroscopic
stress, it is a projection of mesoscopic stresses.
Table 4
Experimental A and B coefficients for {101¯4} and {202¯2} diffracting planes
Plane {202¯2} Plane {101¯4}
f⫽ 0° f⫽ 45° f⫽ 90° f⫽ 0° f⫽ 45° f⫽ 90°
A (×103) ⫺0.90343 ⫺0.78922 ⫺0.81571 ⫺0.02992 ⫺0.04344 ⫺0.06561
B (×103) 1.65645 0.85342 0.80209 1.28388 1.03634 1.00242
A (MPa) 248.2 216.8 224.1 8.2 11.9 18.1
Only to give an idea of the magnitude, it can be said that it corresponds to 90 MPa (⬇35% of the yield stress) at room temperature. In conclusion, the thermal stresses at room temperature cannot be neglected and can play an important role on the elastoplastic transition (see next section).
4.2. Mechanical stresses
The second part of this work is the simulation of the mechanical response of rolled Zr-αwhen it is subjected to uniaxial loading along the rolling and the transverse directions.
Generally, deformation in Zirconium alloys can occur by either slip or twinning. In such materials, microstructural observations show that prismatic glide {101¯1}具112¯0典 is the most active deformation mode [14,15]. First-order pyramidal slip {101¯1}具112¯3典 and basal slip {0002}具112¯0典 are considered as secondary slip mode [15,16]. At room temperature, twinning in Zirconium is most frequently observed to occur on the {101¯2}, {112¯1} and {112¯2} planes [17,18].
In the model, critical resolved shear stresses (CRSS) and the hardening law for slip and twin-ning are considered as controlling parameters.
Their values depend on many factors (oxygen con-tent, grain size, temperature, etc.) and they are unknown. Consequently, they are determined through a fitting of the predicted behaviour on the experimental one.
The initial CRSS are taken as identical for all systems of a system type. The deformation systems introduced in the model are assumed to be: pris-matic slip, first-order pyramidal slip and {101¯2} twinning. In this work, we considered a linear hardening law [7], the coefficient Hgr is equal to
Hgg for any deformation modes r: t˙g⫽ Hg
冘
rg˙r,
i.e. latent hardening is equal to the self-hardening. The CRSS obtained are: t⫽ 118 MPa for pris-matic mode, t⫽ 190 MPa for first-order pyrami-dal mode and t⫽ 240 MPa for tensile twinning. The hardening coefficients were found to be 69 MPa for prismatic slip, 150 MPa for pyramidal slip and 240 MPa for twin mode. The CRSS for the prismatic systems is determined to reproduce the experimental yield stress in the RD. The CRSS values are adjusted to give a good description of the tensile test performed in the RD of the sheet. Experimental observations [17,18] show that twin-ning does not make a large contribution to plastic deformation. A CRSS value of 240 MPa ensure that their activity is lower than prism or pyramidal activity. The hardening coefficients are chosen to be consistent with the final experimental slope of the curve in the RD of the sample. The same para-meters are taken for the simulation of the tensile test in the TD. We have considered two assump-tions in the simulaassump-tions: loading with thermal stresses and without thermal stresses. Fig. 1 shows the predicted stress–strain curves for a tensile test in rolling and transverse directions.
The experimental tests show several differences between the two directions: the yield stress is higher, the elastoplastic transition is faster and the curve shows a plateau at 0.6% strain in the transverse direction. The measured yield stresses are 205 MPa and 290 MPa (stress differential of 85 MPa) in the RD and TD, respectively. The corresponding Young’s modulus are 93 GPa and 96 GPa. These values are similar because of the low elastic ani-sotropy. With the model developed here, the
pre-dicted Young’s modulus are 93 GPa and 95 GPa in agreement with the experimental ones. The stress differential can be attributed to thermal stresses. This fact has been already analysed by Mac Ewen et al. [3] on Zircaloy-2. The predicted yield stresses are 205 MPa and 275 MPa in the RD and TD, respect-ively. When no thermal stresses are assumed, the model predicts a low stress differential (⬍15 MPa) which could be attributed to texture.
For the test along the RD, the elastoplastic tran-sition starts with the activation of prismatic slip. At 0.7% strain, pyramidal slip is activated and when the deformation reaches 1.3% deformation, the polycrystal is fully plastic. This sequence explains correctly the experimental loading slope. At 1% deformation, the proportions of activated systems are: 83% for prismatic mode, 16.5% for pyramidal slips and 0.5% for tensile twinning. Finally, we obtained a reasonable distribution in agreement with the experimental observations: prismatic glide is the main active mechanism, pyr-amidal slip is a secondary slip mode and twinning contributes very little to plastic deformation.
When tension is simulated in the TD, the yield stress is higher and the plastic deformation begins by the activation of prismatic slip. At 0.4% strain, pyramidal systems become active and the material is fully plastic at about 0.9%. At 1%, the distri-bution of activated systems is: 75%, 24.2% and 0.8% for the prismatic, pyramidal and tensile twin respectively. The model fails to reproduce cor-rectly the plateau in the curve. Turner et al. [6] attributed this part to the relaxation of stresses by twinning, however they did not introduce it in their model. In our model, this phenomenon is incorpor-ated, but we found that plastic deformation due to twinning is less than 1.0% and this result is coher-ent with experimcoher-ental observations. Consequcoher-ently, it seems clearly that twinning cannot explain the plateau in the curve in the TD. If we take lower values of CRSS or hardening coefficients that does not modify this tendency.
In Fig. 6, the stress axis orientation is plotted in the stereographic basal projection of the hexagonal lattice for each grain. The grains in which prismatic slip was first activated, have the angle between stress axis and pole of basal plane close to 90° (the Schmidt factor becoming maximum). For pyramidal
Fig. 6. Stress axis orientation in a basal stereographic projec-tion of the hexagonal lattice with tracprojec-tion in RD.쐌 Grains in which prismatic mode was first activated;왕 grains in which pyramidal mode was first activated;+grains in which twinning mode was first activated.
mode, this angle is close to 45°. Twinning may occur when this axis is quasi parallel to the c-axis. This fact explains why the CRSS and hardening para-meters of twinning have a very low influence on the macroscopic behaviour: twinning concerns only a small fraction of specifically oriented grains. The grains which have the highest value of strain with the lowest value of stress correspond to grains with
c-axis normal to the stress axis.
5. Conclusions
In this study, the thermal residual stresses in a rolled Zr-αusing a self-consistent model have been evaluated and compared with X-ray diffraction results. A good agreement between the two methods has been obtained. The residual stresses due to ther-mal anisotropy are rather important (equivalent to 35% of the yield stress) and consequently they play an important role on the elastoplastic transition. The stress-free lattice parameters of our sample were determined with the model and we found a⫽
3.2365 A˚ and c⫽ 5.1498 A˚.
An elastoplastic self-consistent approach has been developed for modelling the mechanical
response of rolled Zr under uniaxial loading. We showed that the thermal stresses can explain the stress differential between RD and TD of the sam-ple and that the elastoplastic transition can be explained by the texture and the internal stresses. This study has enable us to check the capacity of our model to simulate the internal stresses in rolled Zr-αand explains its behaviour. Next step will be to verify the assumptions on the deformation mode activated in our calculation. For that, samples will be subjected to uniaxial loading with different total strain along the rolling and the transverse direc-tions. Stress measurements with diffraction tech-niques on these samples and simulation will allow a better prevision and interpretation of the mechan-ical behaviour of the material. A similar study on an hexagonal material (Ti-α) with c/a close to Zir-conium value (1.5873) is also beginning.
References
[1] Ortiz M, Pochettino AA. In: Denis S, et al., editors. Fourth European Conference on Residual Stresses, vol. 2 1996:971–6.
[2] Ortiz M, Pochettino AA. J Nucl Mat 1996;229:65–72. [3] Mac Ewen SR, Tome´ C, Faber J. Acta Mater
1989;37:979–89.
[4] Mac Ewen SR, Christodoulou N, Salinas-Rodriguez A. Metall Trans 1990;21A:1083–95.
[5] Turner PA, Tome´ CN. Acta Mater 1994;42:4143–59. [6] Turner PA, Christodoulou N, Tome´ CN. Int J Plasticity
1995;11(3):251–65.
[7] Pang JWL, Holden TM, Turner PA, Masson TE. Acta Mater 1999;47:373–83.
[8] Hill R. J Mech Phys Solids 1965;13:89–101.
[9] Lipinski P, Berveiller M. Int J Plasticity 1989;5:149–72. [10] Kocks UF, Tome´ CN, Wenk HR. Texture and anisotropy.
Cambridge: Cambridge University Press, 1998.
[11] Simmons G, Wang H. Single crystal elastic constants and calculated aggregate properties. Cambridge, (MA): MIT Press, 1971.
[12] Fisher ES, Renken C. Phys Rev 1964;135:484–94. [13] Goldak J, Lloyd LT, Barrer CS. Phys Rev
1966;144(2):478–83.
[14] Pochettino AA, Gannio N, Vial Edwards C, Penelle R. Scripta Metall 1992;27:1859–63.
[15] Tenckhoff E. Deformation mechanisms, texture, and ani-sotropy in zirconium and zircaloy. STP 966, 1916 Race Street, Philadelphia, PA 19103, 1988.
[16] Akhtar A. Acta Metall 1973;21:1–11. [17] Akhtar A. Met Trans 1975;6A:1105–13. [18] Akhtar A. J Nucl Mat 1973;47:79–86.