Available technical flexibility for balancing variable renewable energy
sources: case study in Belgium
Sylvain Quoilin*
European Commission, DG Joint Research Centre1 Energy Technology Policy Outlook
e−mail: sylvain.quoilin@ec.europa.eu
Ignacio Hidalgo Gonzalez, Andreas Zucker, Christian Thiel European Commission DG Joint Research Centre
Institute for Energy and Transport - ETPO P.O. Box 2 NL-1755 ZG Petten
ABSTRACT
The recent evolution in power systems, including increased share of renewables and a modification of the power plant fleets entail new constraints, e.g. on the peak capacity or on the technical flexibility required on the grid. This study simulates the Belgian power system using Dispa-SET, a unit commitment and optimal dispatch model developed within the Joint Research Centre. Different “what-if” scenarios are defined and evaluated by varying the availability of major nuclear and CCGT power plants, or the share of renewable capacity in the system. Key findings include:
• If the nuclear power plants of Doel 1, 2 and 4 had not been available in 2012-2013, 76 hours of capacity deficit would have been stated.
• If, in addition, the two CCGT power plants of Vilvoorde and Seraing had been disconnected, the number of deficit hours would have risen to 450.
• There is enough technical flexibility on the system to accommodate significant shares of renewable energy (up to 8 GW additional capacity, corresponding to 17% of the yearly generation).
• CCGT power plants are submitted to more on/off cycles as the share of renewable energy increases.
• In high renewable penetration scenarios, CCGT power plant are committed preferably over less flexible nuclear or coal power plants. It is therefore necessary to set up proper markets mechanisms to maintain these plants on the grid.
Keywords: Renewable energy, unit commitment, balancing, flexibility, simulation
INTRODUCTION
Since 2000, the share of variable renewable energy (VRE) has grown significantly in European markets. The underlying reasons are, amongst others, a will to decrease the dependency on fossil fuels (for environmental and geo-political reasons) and a phase-out of nuclear energy. Belgium is no exception, and the installed capacity of VRE has been growing steadily over the last few years. The "2020 climate and energy package" sets the target for European countries to 20% of their energy consumption produced from renewable resources. In Belgium, this corresponds to 13% of green energy in gross consumption, including 21% of electricity coming from renewable sources.
1 The views expressed are purely those of the authors and may not in any circumstances be regarded as stating an
However, the variability of VRE imposes technical constraints on the power system, and it is therefore essential to assess the physical capacities of the generation park to adapt to these new working conditions.
Variability and uncertainty are familiar aspects of all power systems. However, the increase of the share of renewable sources leads to new needs in terms of flexible resources. These resources can be provided by different means, including dispatchable power plants (i.e. with ramp up and ramp down capabilities), storage systems, grid interconnections, or Demand Side Management (DSM).
Various studies evaluate the flexibility needs to balance additional shares of renewables, e.g. [1-3]. The evaluation of the available technical flexibility to fulfil these requirements is less covered in the scientific literature. Some assessment, such as in [4], provide rough estimations of the current technical flexibility, leading to a VRE penetration potential varying from 19% (for Japan) to 63% (for Denmark). No estimation is provided for Belgium.
The present work focuses on the Belgian power system. To assess its flexibility, both the technical flexible resource available and the flexibility requirement are evaluated in the considered area. The VRE penetration potential is then evaluated using a unit commitment and optimal dispatch model. Various VRE penetration and unit phasing out scenarios are simulated and their impact on the fleet (e.g. the number of operating hours of CCGT plants) is evaluated.
TEST CASE DEFINITION
To evaluate the impact of VRE over the electric system, a particular area is modelled using historical data as input. The selected area is the Belgian power system, among others for the data availability regarding load, generation and interconnections on this area.
Considered time period and status of the fleet
The selected time period for the simulation is a one year period running from October 1st, 2012, till September 30th, 2013. The selection of the 2012-2013 winter instead of 2013-2014 is chosen in consideration of the fact that the latter was very mild, which might not be representative of usual operating conditions. Belgium is also an interesting test case because a number of power plants are being planned for phasing out and no new capacity (other than VRE) is expected for the near future. It is therefore relevant to evaluate what would be the effect of this phasing out on the considered time period, in terms of flexibility but also in terms of maximum capacity.
During the considered period, the net offtake was 81.06 TWh. The minimum and maximum loads are 5.9 GW and 13.4 GW, respectively. The net imports are significant and amount to 14.2 TWh, as Belgium was importing from France and the Netherlands during most of the time. Current discussions on the power system in Belgium focus on the phasing out of nuclear and on the future of CCGT plants because of their low running hours throughout the year. In particular:
• The nuclear reactors of Tihange 2 and Doel 3 (about 2 GW) are currently stopped because of defects in the high pressure vessels and it is not clear if they can be restarted in the future.
• The nuclear reactors of Doel 1 and Doel 2 are planned for phasing out in 2015.
• The nuclear plant of Doel 4 has undergone major damages during the summer 2014. It is not clear if it will be online for the next winter.
• Since 2012-2013, two major CCGT plants (Awirs and Ruien) have been disconnected.
• Two other CCGT plants (Vilvoorde and Seraing) are being phased out in 2014. Discussions are ongoing whether they could enter into a “strategic reserve”.
• Several projects of new CCGT plants have been abandoned in the past years because of an anticipated lack of profitability.
In conclusion, the Belgian power system is currently in chronic under-capacity and heavily relies on its importations. There does not seem any solution for the short term and major load shedding solutions could be required during winter periods.
It is therefore of particular interest to simulate this system and evaluate the impact of different power plants decommissioning scenarios. The goal is to answer questions such as:
• In the 2012-2013 conditions, would there be under-capacity if the above power-plants are not online?
• What is the technical flexibility available to balance VRE generation?
• Which share of VRE would have been allowed in the 2012-2013 conditions without major issue for the flexibility of the grid?
Data Sources
The recent EU directive [5] on the transparency on the wholesale electricity markets has lead TSOs and electric utilities to release a large amount of data and has opened opportunities for researchers to study flexibility, planning and adequacy issues in the corresponding areas.
Bottom-up energy systems models usually require a large amount of data, which is sometimes classified and uneasy to obtain. The data necessary to the Dispa-SET model has been gathered from different sources described hereunder. When necessary, data reconciliation has been performed, for example because of different accounting methods for time.
The present analysis was conducted using the 15-min data for the Belgian Transmission grid, operated by « Elia » [6], including:
• Vertical load data
• Power generation disaggregated by fuel type
• Interconnections and storage (pumped hydro) throughout the year
• VRE (wind and solar) generation and forecasts
There are 120 units connected on the transmission grid and subject to CIPU contracts (Contract for the Injection of Production Units), amongst which some which have been disconnected between 2012 and 2013.
The relevant data include the type of power plant, min/max capacity, starting time, ramp up/down times and minimum up/down times. When possible, the characteristics of the individual power plants they have been gathered from the power plants utilities. Generic values from the literature ([7-9]) have also been used when no other data was available.
UNIT COMMITMENT MODEL
The Dispa-SET model is a unit commitment and dispatch model developed within the “Joint Research Centre” and focused on the balancing and flexibility problems in European grids. It is written in GAMS and coupled to Matlab and Excel for input/output data handling and visualization. The selected Mixed-Integer Linear Programming (MILP) solver is CPLEX.
Model formulation
The model is expressed as a MILP problem. Continuous variables include the individual unit dispatched power, the shedded load and the curtailed power generation. The binary variables are the commitment status of each unit.
Even though a detailed formulation of the Dispa-SET model is out of the scope of this paper, the main model features are summarized hereunder:
• Minimum and maximum power for each unit
• Power plant ramping limits
• Reserves up and down
• Minimum up/down times
• Load Shedding
• Curtailment
• Pumped-hydro storage
• Non-dispatchable units (e.g. wind turbines, run-of-river, etc.)
• Start-up, ramping and no-load costs
• Multi-nodes with capacity constraints on the lines (congestion)
• Constraints on the targets for renewables and/or CO2 emissions • Yearly schedules for the outages (forced and planned) of each units
The demand is assumed to be inelastic to the price signal. The MILP objective function is therefore the total generation cost over the optimization period.
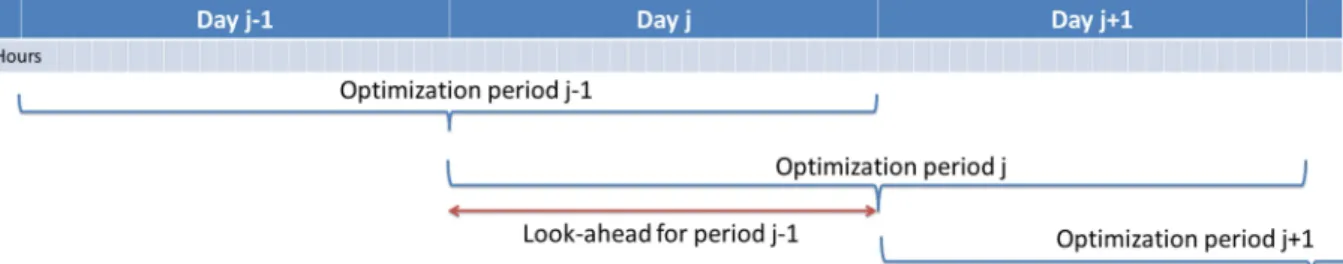
Figure 1: Time horizons of the optimization with look-ahead period
Since the simulation is performed for a whole year with a time step of one hour, the problem dimensions are not computationally tractable if the whole time horizon is optimized. Therefore, the problem is split into smaller optimization problems that are run recursively throughout the year. Figure 1 shows an example of such approach, in which the optimization horizon is one day, with a look-ahead (or overlap) period of one day. The initial values of the optimization for day j are the final values of the optimization of the previous day. The look-ahead period is modelled to avoid issues linked to the end of the optimization period such as emptying the hydro reservoirs, or starting low cost but non-flexible power plants. In this case, the optimization is performed over 48 hours, but only the first 24 hours are conserved.
Inputs and parameters
The hourly load curve is averaged from the available 15-min data. A residual load is defined as the load seen by the Belgian TSO during 2012-2013 when interconnections have been added and when the effect of additional VRE capacity has been substracted:
(1)
It was decided to include the interconnections into the residual load because of the difficulty to model them without a proper model of the neighbouring countries, and because the line capacity limits are not known. This methodology ensures that the imports are maximum during the most critical hours of the year.
and are the historical VRE generation curves scaled according to the installed capacity in the considered scenario. The grid losses are evaluated as a function of the current load using a calibrated polynomial curve.
Since this model focuses on the available technical flexibility and not on accurate market modelling, it is run using the measured historical data, and not the day-ahead forecasted load and VRE production. This can be partly justified by the fact that a fraction of the forecast errors can be solved on the intra-day market. This perfect foresight hypothesis is however optimistic and a more detailed stochastic simulation should be performed to refine the results. The introduction of variable renewable on the grid entails increased ramping rates at different time scales (e.g. 15 min, 1 hours, 6 hours, etc.). The model time step being one hour, it is not straightforward to simulate the 15-min ramping needs. This is addressed by considering them as reserve constraints: the maximum 15-min ramp up/down rate is computed for each hour of the simulation, and the required flexible capacity to fulfil this demand is put aside (i.e. not available for load following). This is performed using the reserve constraint of Dispa-SET: the automatic Frequency Restauration reserves (FRRa), the manual Freqency Restauration reserves (FRRm), and the 15-min ramping requirements are merged into one single variable:
/ ! max &! ', )* +,-,' ., / / (2)
The “max” function ensures that enough flexibility is made available for ramping, but also that enough tertiary reserve (FRRm) was contracted in case the ramping needs are low.
The values of !! and ! ' are imposed using the Elia 2018 reserve study [11]. This study presents the advantage of evaluating the reserve needs with increased penetration of VRE, which is of particular relevance in the scope of this work. An FRRa value of 140 MW is recommended for the base case (the year 2013), and a value of 172 MW is recommended for 2018, with a nominal capacity of VRE which has increased from 3.2 to 8 GW in the meantime. The required secondary reserves can therefore be expressed as a linear function of the VRE capacity with the following equation:
! 140 ,345,67
859.4 ∙ & <=> 3.2/ (3)
A similar approach is used for the evaluation of the tertiary reserve (FRRm) needs. These
needs are one order of magnitude higher than for the secondary reserve, with values up/down around 1000 MW.
As aforementioned, data is provided for 120 CIPU units connected to the transmission grid. However, some of these units present a low capacity and a high flexibility, such as the turbojets whose output power does not exceed a few MW and which can reach full power in less than 15 minutes. For these units, a unit commitment model with a time step of 1 hour is unnecessary and
computationally inefficient. Therefore, these units are merged into one single, highly flexible unit with averaged characteristics.
The minimum and maximum capacities of new aggregated units (indicated by *) are given by:
'∗ minD& D,' / (4)
' .∗ ∑ &D D,' ./ (5)
The unit marginal (or variable cost) is given by:
F <∗ G ∑ &HI I,JKL∙M NOKPQKRST,I/
HJKL∗ (6)
The start-up/shut-down costs are transformed into ramping costs (example with ramp-up):
F = ' U∗
∑ &HI I,JKL∙M NVKJWXW,I/ HJKL∗
∑ &MI NYZKPZXW,I/
HJKL∗ (7)
Other characteristics, such as the plant efficiency, the minimum up/down times or the CO2
emissions are averaged. It should however be noted that only very similar units are aggregated, which does not lead to significant averaging errors since their characteristic are equal or very close to one another. Using this methodology, the number of units could be significantly reduced, from 120 to 45.
The main model assumptions, inputs and parameters are summarized in Table 1.
Table 1 Modeling assumptions
Time Step 1 hour
Simulation period 8760 hours (1/10/2012 to 30/09/2013) Optimality criteria of the MILP solver 4%
Costs taken into account Fuel Costs
Minimum up/down times Depending on the unit type, from 0 to 24 hours
Technologies participating to reserve
market CCGT, Gas Turbines, Turbojets, Diesels Load Shedding 331 MW with large TSO-connected
industries
Power Curtailment Not allowed, except if residual load <0 Nodes and line capacities One single node (copper plate hypothesis)
Outages Historical values
Load curve, VRE and interconnections Historical values (possibly scaled)
SIMULATIONS RESULTS
To illustrate the model capabilities, different “what if” scenarios are defined and simulated. A “base scenario” is first defined, corresponding to the 2012-2013 situation. This allows comparing the simulation results with the actual generation data.
Then, the recent evolutions on the Belgian grid are evaluated by simulating the same system without a share of the capacity that has been planned for decommissioning in the following years, or unavailable due to long-term forced outages.
Finally, different simulations are performed with increasing share of VRE to evaluate the flexibility of the system.
Base case
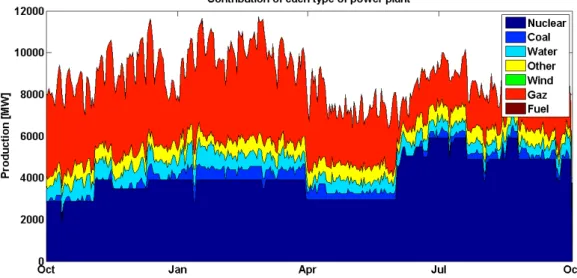
The base scenario corresponds to the actual state of the park and of the consumption during the year 2012-2013. The comparison between simulation and historical data is available in Figure 2 and Figure 3. A fair agreement between both trends is stated. It should be noted that wind is not displayed because it has been netted from the load.
The whole simulation showed that the power system was able to meet the demand (in terms of ramping and max capacity) without issue in the base case. However, it is interesting to note that load shedding had to be activated two times during the simulation, on January 17th at 9h45 (71 MW) at 18h45 (303 MW). This date indeed corresponds to the only day in the year during which the TSO had to activate the interruptible load contracts. It should also be noted that this results was obtained without tuning the model parameters.
Decommissioning of power plants
To assess the potential effect of the current plan to decommission two CCGT plants, and to evaluate the impact of the absence of one nuclear plant, two simulations are run:
1. In the first one, the nuclear plants of Doel 1,2 and 4 are unavailable for the whole year. This corresponds to a possible scenario for the year 2015, Doel 1 and 2 being planned for decommissioning and Doel 4 being out of service for an undetermined period. 2. In the second one, the two CCGT plants that are planned for decommissioning in 2014
are removed, in addition to the Doel 4.
The simulation results are presented in Figure 4, showing that in these two scenarios, the generation would have been insufficient at different moments in the year. Without the three nuclear plants, there would have been 11 shortage periods of time, for a total of 76 hours. The maximum amplitude of the lost load it about 2 GW. In case the two CCGT plants are disconnected as well, the magnitude of the deficit increases, with 450 hours of shortage throughout the year and a maximum loss of load of about 2.8 GW.
Figure 2 Simulated generation throughout the year
Figure 3 Historical values of generation throughout the year
Figure 4 Losses of load throughout the year in scenarios 2 (left) and 3 (right)
Increasing VRE penetration scenarios
In these scenarios, all power plants are kept online as in the 2012-2013 situation, and the share of VRE is increased. The nominal installed power of wind and PV is increased
successively by 4, 8 and 12 GW with respect to the base case, assuming an equal share between the two technologies.
Table 2 Characteristics of the residual with different VRE penetration scenarios
Base Case 4 GW VRE 8 GW VRE 12 GW VRE Additional VRE Share of total [%] 0 8.5 17.0 25.5
Load Max power [GW] 11.97 11.64 11.54 11.4
Min power [GW] 3.93 2.43 0 0 Ramping, 15 minutes Up [GW/h] 4.99 5.59 8.88 13.03 Down [GW/h] 4.71 4.8 8.91 13.36 Ramping, one hour Up [GW/h] 2.08 2.46 2.87 3.6 Down [GW/h] 2.09 2.09 2.46 3.56 Ramping, 6 hours Up [GW/h] 0.78 0.81 0.911 1.1 Down [GW/h] 0.63 0.65 0.851 9.5
Table 2 summarizes the characteristic of the residual load in the different scenarios. The provided ramping values are maximum values for the whole year. It can be stated that VRE do not have a significant influence on the maximum load, but decrease the minimum residual load, which becomes null for 8 GW of additional VRE, corresponding to 17% of the total yearly consumption. The maximum ramping constraints are shown for 3 different timeframes, and logically increase with the amount of VRE.
Simulations results indicate that enough technical flexibility is available for the base case and the 2 first scenarios. However, for the “12 GW VRE” scenario, ramping capabilities are insufficient during 3 time periods for downward ramping and 2 time periods for upwards ramping.
Furthermore, Figure 5 shows the impact of VRE penetration on the operation of CCGT plants throughout the year. The number of start-ups logically increases with the share of renewables. However, the number of operating hours only decreases for the 4GW case compared to the base case. It then slightly increases. This is due to the flexibility required for balancing VRE generation, which lead to optimization problem to commit CCGT plants instead of other units such as nuclear plants.
Figure 5 Number of ON/OFF cycles throughout the year and average number of operating hours for CCGT plants
0 500 1000 1500 2000 2500 3000 3500 4000 4500 Base case 4 GW VRE 8 GW VRE 12 GW VRE CCGT hours CCGT cycles
CONCLUSIONS
This work explores the technical capacity of the Belgian grid to respond to peak demand and to the flexibility constraints linked to the addition of new VRE capacity. To that aim, a reference time period has been considered and simulated in a dedicated unit-commitment and dispatch model.
In terms of maximum capacity, results indicate that the current and future outages and de-commissioning of CCGT and nuclear power plants would have been a problem during the considered time period. Depending on the number of disconnected power plants, significant capacity deficits have been computed, which could lead to black-outs if not properly handled by the transmission system operator.
In terms of flexibility, results indicate that there is enough technical flexibility available to balance a significant amount of renewable (up to 8 GW, corresponding to an additional share of 17%). For higher penetration scenarios, more flexibility would be required, e.g. by increased investments in flexible units (OCGT, Tubojets, CCGT, etc.). Pumped hydro could also play an increased role in reserve markets, as also suggested e.g. by [12] or by [13].
It should be noted that the present work focused on the technical aspects of flexibility, not on the market mechanisms allocating it. Future works might focus on more detailed market and cost modelling to evaluate these aspects.
The proposed model is a perfect foresight model, which might also constitute a limitation because the reserve allocation is performed in a heuristic way. Further improvements of the model might consider both the forecast and the actual load or VRE generation for the unit commitment problem and the dispatch problem, respectively. Stochastic approaches might also be relevant for a more accurate modelling of day-ahead commitment strategies.
REFERENCES
1. Denholm, Paul, and Maureen Hand. “Grid Flexibility and Storage Required to achieve Very High Penetration of Variable Renewable Electricity.” Energy Policy 39, 2011
2. Huber, Matthias, Desislava Dimkova, and Thomas Hamacher. “Integration of Wind and Solar Power in Europe: Assessment of Flexibility Requirements.” Energy, Energy & Environment:
Bringing together Economics and Engineering, 69, 2014
3. Schill, Wolf-Peter. “Residual Load, Renewable Surplus Generation and Storage Requirements in Germany.” Energy Policy 73, 2014
4. IEA, Harnessing Variable Renewables -- A Guide to the Balancing Challenge, 200 pages, ISBN 978-92-64-11138-7
5. Regulation on Wholesale Energy Markets Integrity and Transparency (EU No 1227/2011) 6. Elia, Grid Data, http://www.elia.be/en/grid-data (Database accessed on August 17th , 2014) 7. Brauner, G., and others. Erneuerbare Energie Braucht Flexible Kraftwerke–Szenarien Bis
2020. Studie Der Energietechnischen Gesellschaft Im VDE (ETG), Frankfurt April 2012 8. Bruynooghe Christiane, Eriksson Arne, Fulli Gianluca, Load-following operating mod at
Nuclear power plants, Joint Research Centre, Publications Office of the European Union, 2010
9. Domenichini, Rosa, Luca Mancuso, Noemi Ferrari, and John Davison. “Operating Flexibility of Power Plants with Carbon Capture and Storage (CCS).” Energy Procedia, GHGT-11, 37, 2013
10.IEA Statistics, Oil, Gas, Coal And Electricity. Quarterly Startistics – Fourth Quarter 2013, ISSN 1025-9988
11.Elia, Evolution of Ancillary services needs to balance the Belgian Control area towards 2018, May 2013
12. E. Ela , B. Kirby, A. Botterud and C. Milostan, I. Krad, V. Koritarov The Role of Pumped Storage Hydro Resources in Electricity Markets and System Operation, National Renewable Energy Laboratory, Proceedings of HydroVision International, 2013
13.Elia, Rapport portant sur les conditions nécessaires pour assurer l'équilibre dans la zone de réglage d'ELIA, 2013