Ascospore size declines with elevation in two tropical
parmelioid lichens
Didier Masson1* & Nicolas Magain2
Abstract. Spore size and shape are biometric parameters frequently used in lichen tax-onomy, especially in species characterization. However, the influence of environmental factors on the intraspecific variability of these characters remains very little investigated in lichenology. The elevational variation in spore length, width, volume and shape (length/ width ratio) of two species of the genus Hypotrachyna (H. aff. damaziana et H. altorum) occurring on Réunion Island (Indian Ocean) were studied. Spore length, width and volume significantly decrease with elevation in H. aff. damaziana, and spore width and volume also significantly decrease with elevation in H. altorum. There is no relation between spore shape and elevation in either of the two species. A significant correlation was further observed between the intra-individual variability in spore size of H. aff. damaziana and elevation. For this species, inter-individual variability in spore volume is also correlated with mean annual temperature and mean annual precipitation of the sampling locations, and spore width and length are correlated with mean annual temperature.
Key words: Ascomycota, Parmeliaceae, Hypotrachyna, Réunion Island, spore
morphom-etry, intraspecific variation
Introduction
Ascospore size provides a relevant diagnostic character frequently used for taxonomic purposes in lichenized fungi, including species delimitation (e.g., Poelt 1973; Löfgren & Tibell 1979; Clerc 1984; Martínez & Burgaz 1998; Doré et al. 2006; Argüello et al. 2007; Truong et al. 2009; Núñez-Zapata et al. 2011). However, the influence of environmental factors on spore size within a species remains largely unexplored in lichenology (Hawksworth 1973). In a review on environmental modification and lichen taxonomy, Weber (1977) wrote: ‘Differences in ascospores are accorded paramount importance in lichen systematics today, but at the species level one should perhaps be asking what effects the environment might have. Spore size, numbers and perhaps even the extent of septation suggest themselves as characters on which fur-ther studies should be carried out, but scant attention has been paid to these aspects in recent years’. Four decades later, the state of affairs remains unchanged.
Hypotrachyna aff. damaziana and H. altorum are two
fairly common foliose lichens on Réunion (van den Boom et al. 2011; Masson 2012), a rather young tropical volcanic island in the Mascarene Archipelago, with the highest
peak in the Indian Ocean (Piton des Neiges, 3070 m). These corticolous lichen-forming Ascomycota reproduce sexually, and their thalli generally produce apothecia with simple, hyaline mature spores. Hypotrachyna aff.
dama-ziana is a taxon with a well-defined phenotype on Réunion
Island (Masson unpubl. data). It is morphologically and chemically similar to H. damaziana from tropical America and Kenya (Hale 1976; Krog & Swinscow 1979; Eliasaro & Adler 2000; Flakus et al. 2012; Nash et al. 2016). Mole-cular data from thirteen specimens from Réunion (Masson & Sérusiaux unpubl. data) and one Kenyan specimen (Kirika et al. 2019) show that the two populations are most probably conspecific. However, since the type of H.
dama-ziana has been collected in Brazil, molecular studies on
Neotropical material are needed to determine whether the African and American specimens belong to the same species. Hypotrachyna aff. damaziana thrives on Réunion in five main habitat types (as defined by Strasberg et al. 2005): submontane and montane forests, Pandanus wet thickets, Acacia montane forests and subalpine thickets, in an elevation range from 620 m to 2375 m a.s.l. (Masson unpubl. data). Hypotrachyna altorum has a much more restricted elevation range, 1485–1850 m, and is confined to montane and Acacia montane forests (Masson 2012). The combination of regular spore production and wide elevational range makes H. aff. damaziana particularly interesting for testing the influence of environmental 1 386 rue des Flamboyants, F-40600 Biscarrosse, France
2 Evolution and Conservation Biology, InBios Research Center, Institut
de Botanique B22, Université de Liège, Chemin de la vallée 4, 4000 Liège, Belgium
* Corresponding author e-mail: [email protected]
Article info
Received: 31 Aug. 2019 Revision received: 9 Mar. 2020 Accepted: 15 Mar. 2020 Published: 2 Jun. 2020
Associate Editor
Bernard Goffinet
© 2020 W. Szafer Institute of Botany, Polish Academy of Sciences.
factors on spore size variability, whereas H. altorum, with its smaller elevational range but with a rather similar ecology, could provide an interesting model to compare. Elevational gradients are widely used as ‘natural’ exper-iments for testing the response of organisms to abiotic influences, although the diversity of environmental factors varying with elevation makes any interpretation rather tricky (Körner 2007).
Experimental studies have shown that ecological conditions, especially temperature and moisture, affect ascospore morphology in non-lichenized fungi (e.g., Williams 1959; Petrie 1994). Further, because of their unique physiology, lichens are highly sensitive to climatic conditions (Kershaw 1985; van Herk et al. 2002; Palm-qvist et al. 2008; Gauslaa 2014). The two Hypotrachyna species under consideration thrive mainly on branches of trees or shrubs with loose crowns and rather light foli-age, such as Acacia koa [= A. heterophylla, cf. Le Roux et al. (2014)], the main phorophyte for H. aff. damaziana (Masson unpubl. data) and the exclusive one for H.
alto-rum (Masson 2012). It is reasonable to assume that in
these well-lit, well-ventilated situations, these lichens are exposed to mesoclimatic variation.
The present work tests two assumptions: (i) spore size, and possibly also spore shape, of both
Hypotra-chyna species change with the elevation of the sampling
localities; and (ii) spore size and/or spore shape correlate with climatic variables such as temperature and/or rainfall and/or solar radiation.
Materials and methods
Specimen sampling and characterization of localities Fresh specimens of H. aff. damaziana and H. altorum were collected on Réunion by the first author between 2003 and 2017. They are preserved in the herbarium of the University of Liège (LG) and the first author’s private herbarium. Specimens with at least one well-developed and not parasitized apothecium were collected, for H. aff.
damaziana, in sixty localities distributed in 48 1 × 1 km
cells of the UTM grid system. Thirty-two of these cells (two-thirds) were randomly selected for a statistical study. Specimens of H. altorum were collected in twenty-two localities distributed in 14 1 × 1 km cells, and all of these
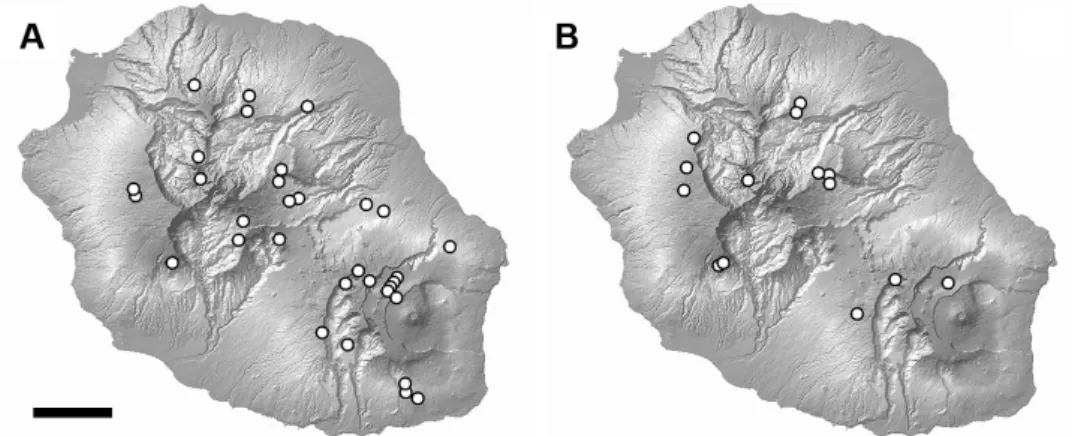
cells were included. Of the 46 cells selected for both species (32 for H. aff. damaziana, 14 for H. altorum), 19 contained more than one locality and/or more than one specimen. In this case, only one specimen from a single locality was randomly drawn for each of these 19 cells. Thus, each of the 46 samples studied consisted of a single specimen taken from a single locality in a 1 × 1 km cell of the UTM grid system. This procedure was chosen to avoid too close proximity between the sampling sites and thus to limit spatial autocorrelation. Data on the samples are included in Table 1 and Figure 1. Four collection sites are shared by the target species. All but three of the studied specimens were collected in July and August, during the ‘cool’ season (Jumaux et al. 2011).
The elevation of the forty-two localities was deter-mined in the field using a hand-held GPS receiver (Garmin eTrex) and subsequently controlled using CartoExploreur 3 (Bayo) software. Climate data (mean annual tempera-ture, mean annual precipitation, annual mean daily global solar radiation) for each locality were determined from the maps available in Jumaux et al. (2011). The averag-ing period is 1991–2010 for temperature, 1981 –2010 for precipitation, and 2001–2010 for global solar radiation. Spore measurements
Ascospores in their fully hydrated state were examined with a Zeiss PrimoStar compound light microscope after being freed from the asci in squash preparations of hand-cut sections of ascomata mounted in tap water. Only non-deformed spores with coloured cytoplasm filling the entire cell were taken into account. For each sample, 30 randomly selected spores from a single well-developed apothecium were measured using an ocular micrometre at 1000×. For one sample (H. aff. damaziana No. 15), spores from ten apothecia were studied to assess variabil-ity of spore size and shape within a single thallus. One of these ten apothecia (apothecium ‘A’; Fig. 2) was randomly selected for the comparisons among localities. Thus, the measurements obtained from this apothecium characterize sample No. 15 in the rest of the study. Length and width values were recorded to the nearest 0.5 µm. The length/ width ratio (Q) was used as an indicator of spore shape. The volume of each measured spore was estimated using the equation of an ellipsoid of revolution (Pentecost 1981).
The arithmetic mean spore length, width, Q and volume, their standard deviation and coefficient of variation (incl. Haldane correction; Haldane 1955) were calculated for each sample. Considering that the variation of spores between the different individuals of a species (intraspe-cific variation) is a trait of the species, whereas the spore variation within one individual (intra-individual variation) is only the attribute of that individual (Raitviir 1972; Parmasto & Parmasto 1987), statistics for the overall spore measurements of each of the two species studied
are presented in the format: (M – SD) – M – (M + SD), where M is the arithmetical mean of the mean values of the samples (in italics) and SD its standard deviation. Statistical analyses
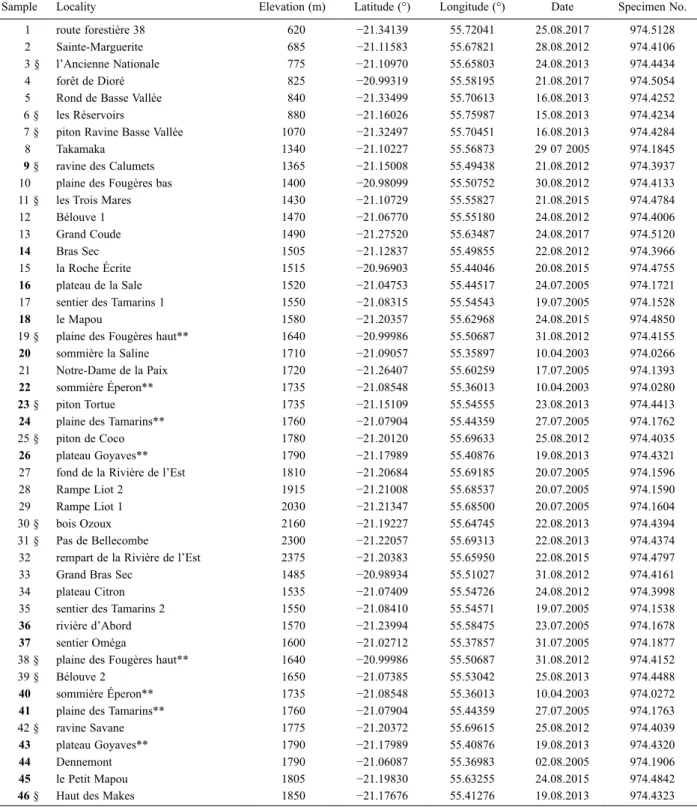
Statistical analyses were performed using R (R Core Team 2018) and R packages ‘car’ (Fox et al. 2012), ‘dplyr’ (Wickham et al. 2016), ‘ggpubr’ (Kassambara 2017) and ‘reshape2’ (Wickham 2012). The normality distribution of variables was checked using quantile-quantile (Q-Q) plots Table 1. Geographical characteristics of the sampling sites, and references of the specimens studied. Samples 1–32 pertain to H. aff. damaziana, samples 33–46 to H. altorum. Collection localities marked ** are shared by both species. Sample numbers in bold type indicate leeward localities; those marked § indicate specimens whose ITS has been studied.
Sample Locality Elevation (m) Latitude (°) Longitude (°) Date Specimen No.
1 route forestière 38 620 −21.34139 55.72041 25.08.2017 974.5128
2 Sainte-Marguerite 685 −21.11583 55.67821 28.08.2012 974.4106
3 § l’Ancienne Nationale 775 −21.10970 55.65803 24.08.2013 974.4434
4 forêt de Dioré 825 −20.99319 55.58195 21.08.2017 974.5054
5 Rond de Basse Vallée 840 −21.33499 55.70613 16.08.2013 974.4252
6 § les Réservoirs 880 −21.16026 55.75987 15.08.2013 974.4234
7 § piton Ravine Basse Vallée 1070 −21.32497 55.70451 16.08.2013 974.4284
8 Takamaka 1340 −21.10227 55.56873 29 07 2005 974.1845
9 § ravine des Calumets 1365 −21.15008 55.49438 21.08.2012 974.3937
10 plaine des Fougères bas 1400 −20.98099 55.50752 30.08.2012 974.4133
11 § les Trois Mares 1430 −21.10729 55.55827 21.08.2015 974.4784
12 Bélouve 1 1470 −21.06770 55.55180 24.08.2012 974.4006
13 Grand Coude 1490 −21.27520 55.63487 24.08.2017 974.5120
14 Bras Sec 1505 −21.12837 55.49855 22.08.2012 974.3966
15 la Roche Écrite 1515 −20.96903 55.44046 20.08.2015 974.4755
16 plateau de la Sale 1520 −21.04753 55.44517 24.07.2005 974.1721
17 sentier des Tamarins 1 1550 −21.08315 55.54543 19.07.2005 974.1528
18 le Mapou 1580 −21.20357 55.62968 24.08.2015 974.4850
19 § plaine des Fougères haut** 1640 −20.99986 55.50687 31.08.2012 974.4155
20 sommière la Saline 1710 −21.09057 55.35897 10.04.2003 974.0266
21 Notre-Dame de la Paix 1720 −21.26407 55.60259 17.07.2005 974.1393
22 sommière Éperon** 1735 −21.08548 55.36013 10.04.2003 974.0280
23 § piton Tortue 1735 −21.15109 55.54555 23.08.2013 974.4413
24 plaine des Tamarins** 1760 −21.07904 55.44359 27.07.2005 974.1762
25 § piton de Coco 1780 −21.20120 55.69633 25.08.2012 974.4035
26 plateau Goyaves** 1790 −21.17989 55.40876 19.08.2013 974.4321
27 fond de la Rivière de l’Est 1810 −21.20684 55.69185 20.07.2005 974.1596
28 Rampe Liot 2 1915 −21.21008 55.68537 20.07.2005 974.1590
29 Rampe Liot 1 2030 −21.21347 55.68500 20.07.2005 974.1604
30 § bois Ozoux 2160 −21.19227 55.64745 22.08.2013 974.4394
31 § Pas de Bellecombe 2300 −21.22057 55.69313 22.08.2013 974.4374
32 rempart de la Rivière de l’Est 2375 −21.20383 55.65950 22.08.2015 974.4797
33 Grand Bras Sec 1485 −20.98934 55.51027 31.08.2012 974.4161
34 plateau Citron 1535 −21.07409 55.54726 24.08.2012 974.3998
35 sentier des Tamarins 2 1550 −21.08410 55.54571 19.07.2005 974.1538
36 rivière d’Abord 1570 −21.23994 55.58475 23.07.2005 974.1678
37 sentier Oméga 1600 −21.02712 55.37857 31.07.2005 974.1877
38 § plaine des Fougères haut** 1640 −20.99986 55.50687 31.08.2012 974.4152
39 § Bélouve 2 1650 −21.07385 55.53042 25.08.2013 974.4488
40 sommière Éperon** 1735 −21.08548 55.36013 10.04.2003 974.0272
41 plaine des Tamarins** 1760 −21.07904 55.44359 27.07.2005 974.1763
42 § ravine Savane 1775 −21.20372 55.69615 25.08.2012 974.4039
43 plateau Goyaves** 1790 −21.17989 55.40876 19.08.2013 974.4320
44 Dennemont 1790 −21.06087 55.36983 02.08.2005 974.1906
45 le Petit Mapou 1805 −21.19830 55.63255 24.08.2015 974.4842
and the Shapiro-Wilk test. Homogeneity of variance was investigated using Levene’s test and by plotting residuals vs. fits. To verify whether, for each of the two species, the set of samples represents a single homogeneous pop-ulation, we used the Hartigans’ dip test for unimodality. One-way analysis of variance was chosen to compare the means of the spore variables between groups when the variances were homogeneous; otherwise Welch’s one-way ANOVA was used. The relationships between spore traits and elevation, spore traits and climatic variables, spore traits and apothecia diameter, and between climatic variables were determined with two-tailed Spearman rank correlation tests. When analysing associations between spore traits and climatic variables, the family-wise error rate was reduced by using the sequential Bonferroni procedure (Holm 1979; Rice 1989). When significant correlations were found, multiple linear regressions were performed. Adequacy of the regressions was assessed using the gvlma (Global Validation of Linear Models Assumptions) function of the gvlma R package (Pena & Slate 2012). Comparison of fitted models was per-formed with ANOVA tables using the Anova function.
Results
Variation of the climatic parameters of the sampling localities
Unsurprisingly, the mean annual temperature of a local-ity strongly depends on its elevation (Spearman rank correlation, rs = −0.8201, P = 3.0 × 10⁻¹¹, two-tailed).
However, there is no significant relationship between mean annual rainfall and elevation (rs = −0.1182, P = 0.46,
two-tailed), nor between mean annual rainfall and mean annual temperature at each locality (rs = −0.0343, P = 0.83,
two-tailed). The lack of correlation between rainfall and elevation could be partly related to local exposure to trade winds. The fourteen leeward localities sampled are dis-tributed between 1365 m and 1850 m a.s.l., while fifteen windward localities are in the same elevational range (Table 1). Comparison of the mean annual precipitation of these twenty-nine locations depending on their wind exposure (Student’s t-test, t = 4.146, df = 27, P = 1.5 × 10⁻⁴,
one-tailed) confirms that rainfall tends to be greater in windward situations (mean value 4060 mm) than in lee-ward situations (mean value 2479 mm).
Annual mean daily global solar radiation of the forty-two localities is significantly correlated with ele-vation (rs = 0.3228, P = 0.037, two-tailed), mean annual
temperature (rs = −0.3893, P = 0.011, two-tailed) and mean
annual rainfall (rs = 0.6087, P = 1.9 × 10⁻⁵, two-tailed).
Within-thallus spore variation in Hypotrachyna aff.
damaziana
Levene’s test does not support heterogeneity of variance for any of the four parameters tested (length, width, vol-ume and Q ratio) between ten different apothecia of the same thallus (sample No. 15; Table 2). Q-Q plots sug-gest normality of the data, even if Shapiro-Wilk tests are significant for lengths, widths and volumes. The mean lengths of spores do not significantly differ between the ten apothecia (one-way ANOVA, F9,290 = 1.185, P = 0.30);
the same is true for widths (F9,290 = 0.425, P = 0.92),
vol-umes (F9,290 = 0.295, P = 0.98) and Q values (F9,290 = 1.342,
P = 0.21). Moreover, the coefficients of variation of the
mean values of the samples are low and range between 1.1% and 2.2% for the four parameters studied (1.1% for width, 1.4% for length, 2.2% for volume and Q value). Spore variation and size of apothecia
The sampled apothecia vary in size, and therefore in age. The diameter of the hymenial disc varies from 1.2 to 6.4 mm (mean: 3.15 mm) for the samples of H. aff.
damaziana, and from 1.5 to 4.1 mm (mean: 2.50 mm) for
Figure 2. The ten apothecia investigated in sample No. 15 (Hypo-trachyna aff. damaziana, specimen No. 974.4755). Scale bar = 1 cm.
Table 2. Variation of mean spore measurements, Q values and their standard deviation (SD) in ten apothecia of the same H. aff. damaziana thallus (sample No. 15, specimen No. 974.4755). Thirty spores were measured in each apothecium.
Apothecia
Spore width Spore length Spore volume Q
mean
(µm) (µm)SD mean (µm) (µm)SD (µmmean 3) (µmSD3) mean SD
A 9.05 0.747 13.55 0.792 586.4 108.97 1.51 0.134 B 9.10 0.792 12.93 1.073 564.1 104.70 1.43 0.187 C 9.02 1.038 13.45 0.922 584.1 157.64 1.51 0.154 D 8.95 0.844 13.27 0.878 562.4 113.62 1.49 0.152 E 9.25 0.828 13.28 1.104 602.4 130.81 1.44 0.152 F 9.10 0.759 13.27 0.598 580.2 104.05 1.47 0.127 G 9.18 0.951 13.08 0.929 587.8 142.57 1.43 0.130 H 9.10 0.845 13.32 0.886 583.8 117.62 1.47 0.154 I 9.03 0.860 13.37 1.017 580.5 132.96 1.49 0.129 J 9.27 0.848 13.10 0.865 595.6 119.66 1.42 0.143
those of H. altorum. For the 32 samples of H. aff.
dama-ziana, mean spore width correlates significantly with the
diameter of the hymenial disc (Spearman rank correlation, rs = 0.5201, P = 0.0023, two-tailed); so does mean spore
volume (rs = 0.4915, P = 0.0043, two-tailed). There is no
significant relationship between mean length and disc diameter (rs = 0.2300, P = 0.21, two-tailed), nor between
Q and disc diameter (rs = −0.2384, P = 0.19, two-tailed)
in this species. Regarding the 14 samples of H. altorum, the mean length and mean volume of the spores are sig-nificantly correlated with the diameter of the hymenial disc (length: rs = −0.6042, P = 0.0221, two-tailed;
vol-ume: rs = −0.5954, P = 0.0247, two-tailed). However,
there is no significant correlation between disc diameter and mean width (rs = −0.4294, P = 0.13, two-tailed) or Q
ratio (rs = −0.1115, P = 0.70, two-tailed). No significant
relationship was found between the elevation of locali-ties and the diameter of the hymenial disc in samples of
H. aff. damaziana (rs = −0.2380, P = 0.19, two-tailed) or
H. altorum (rs = 0.2594, P = 0.37, two-tailed).
Spore variation among localities in Hypotrachyna aff.
damaziana
The overall dimensions of the ascospores measured from the 32 specimens are as follows: length 12.8–
13.51–14.2 µm, width 8.8–9.25–9.7 µm, volume 532.1–
614.20–696.3 µm3 and Q 1.40–1.47–1.55. Detailed
statistical parameters for each sample are presented in Table 3. It appears that spore size and spore shape vary appreciably from one sample to another. Welch’s one-way analysis of variance of the data on spore size and spore shape shows that there is a very significant difference across mean length (F31,329.26 = 20.519, P = 2.5 × 10−59),
width (F31,329.25 = 10.664, P = 7.7 × 10⁻³⁴), volume
(F31,329.21 = 15.043, P = 3.1 × 10−46) and Q (F31,329.25 = 8.725,
P = 1.2 × 10⁻²⁷) among the 32 samples. However, the
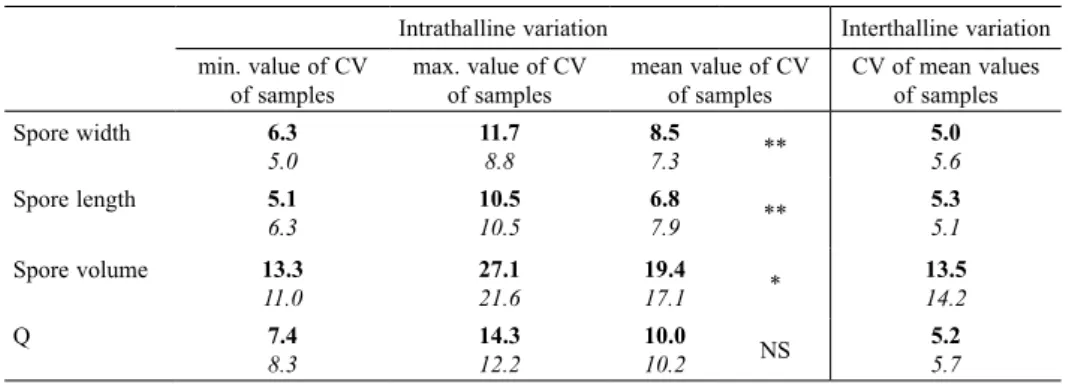
results of the Hartigans’ dip test on the data used show that there is no reason to consider the study population as heterogeneous, either for length (P = 0.58), width (P = 0.97), volume (P = 0.62) or Q values (P = 0.97). Furthermore, the comparison between the mean value of the coefficients of variation of the samples and the coef-ficient of variation for the mean values of the samples shows that the former (‘intrathalline variation’, or more exactly ‘intra-apothecial variation’) is greater than the latter (‘interthalline variation’) for each of the parameters studied (Table 4).
The average spore size of specimens varies with ele-vation. The mean values of width, length and volume correlate significantly with the elevation of the sampling localities: the three variables decrease as the elevation increases (Table 5). The best correlation was found with average volume (Fig. 3). The coefficients of variation (CV) for the three size parameters are also significantly correlated with elevation (Table 5). This suggests that intrathalline variability in spore size changes with elevation. The CV of length increases with elevation, while the CV of width and volume decreases. Unlike spore size variables, there is no significant relationship between the mean Q value, or the CV of Q values,
and elevation (Table 5, Fig. 5). While mean spore size decreases clearly with elevation, the shape of the spores does not change.
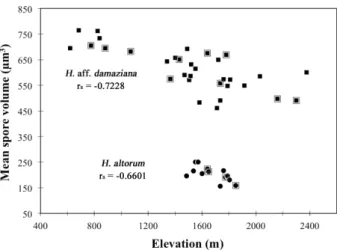
Among the three climatic parameters selected as variables likely to be linked to interthalline variation in spore size or shape, mean annual temperature of sampling Figure 3. Scatter plot of mean spore volume versus elevation for H. aff. damaziana and H. altorum, and Spearman’s rank correlation coefficients. Points within boxes are samples whose ITS has been studied.
Figure 5. Scatter plot showing the absence of relation (Spearman’s rank correlation, rs = −0.0187) between mean spore length/width ratio (Q)
and elevation among samples of H. aff. damaziana.
Figure 4. Scatter plot of mean spore volume versus elevation for sam-ples of H. aff. damaziana, with windward localities separated from leeward localities. Spearman’s rank correlation coefficient for windward localities only.
localities is positively and significantly correlated with mean spore length, width and volume, but not with mean Q value (Table 5). There is no significant relationship between spore size or shape parameters and mean annual precipitation, except for mean spore volume, which increases with annual rainfall. No correlation between annual mean daily global solar radiation and the size or shape of spores was found.
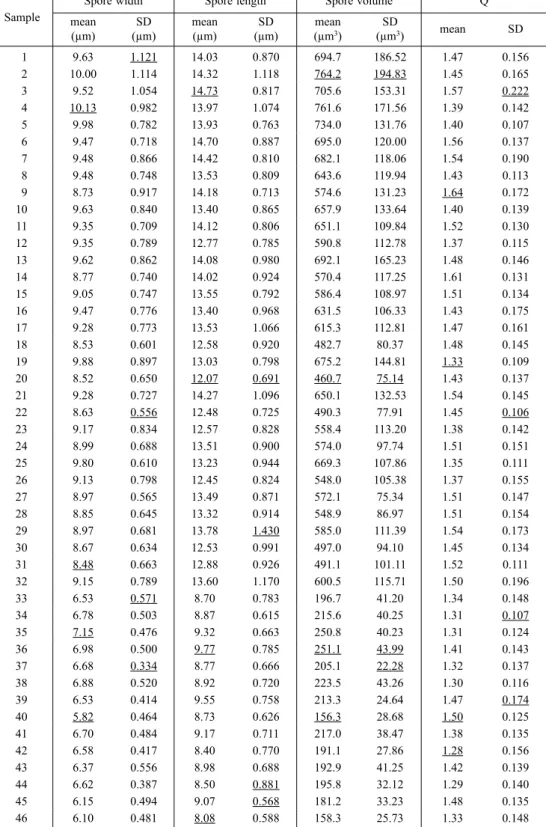
We tested multiple linear regressions with elevation, mean annual temperature, mean precipitation, as well as diameter of apothecia disc as explanatory variables for the variation in spore width, length and volume. For all multiple linear regressions, ANOVA tests never selected a model including both elevation and mean annual tem-perature. This can be linked to the high correlation of these two values (see above). For spore width, a model Table 3. Variation of mean spore measurements, Q values and their standard deviation (SD) in the 32 samples of H. aff. damaziana (samples 1–32) and the 14 samples of H. altorum (samples 33–46). Thirty spores were measured in each sample. Extreme values for each species are underlined for each parameter.
Sample mean Spore width Spore length Spore volume Q
(µm) (µm)SD mean (µm) (µm)SD (µmmean 3) (µmSD3) mean SD
1 9.63 1.121 14.03 0.870 694.7 186.52 1.47 0.156 2 10.00 1.114 14.32 1.118 764.2 194.83 1.45 0.165 3 9.52 1.054 14.73 0.817 705.6 153.31 1.57 0.222 4 10.13 0.982 13.97 1.074 761.6 171.56 1.39 0.142 5 9.98 0.782 13.93 0.763 734.0 131.76 1.40 0.107 6 9.47 0.718 14.70 0.887 695.0 120.00 1.56 0.137 7 9.48 0.866 14.42 0.810 682.1 118.06 1.54 0.190 8 9.48 0.748 13.53 0.809 643.6 119.94 1.43 0.113 9 8.73 0.917 14.18 0.713 574.6 131.23 1.64 0.172 10 9.63 0.840 13.40 0.865 657.9 133.64 1.40 0.139 11 9.35 0.709 14.12 0.806 651.1 109.84 1.52 0.130 12 9.35 0.789 12.77 0.785 590.8 112.78 1.37 0.115 13 9.62 0.862 14.08 0.980 692.1 165.23 1.48 0.146 14 8.77 0.740 14.02 0.924 570.4 117.25 1.61 0.131 15 9.05 0.747 13.55 0.792 586.4 108.97 1.51 0.134 16 9.47 0.776 13.40 0.968 631.5 106.33 1.43 0.175 17 9.28 0.773 13.53 1.066 615.3 112.81 1.47 0.161 18 8.53 0.601 12.58 0.920 482.7 80.37 1.48 0.145 19 9.88 0.897 13.03 0.798 675.2 144.81 1.33 0.109 20 8.52 0.650 12.07 0.691 460.7 75.14 1.43 0.137 21 9.28 0.727 14.27 1.096 650.1 132.53 1.54 0.145 22 8.63 0.556 12.48 0.725 490.3 77.91 1.45 0.106 23 9.17 0.834 12.57 0.828 558.4 113.20 1.38 0.142 24 8.99 0.688 13.51 0.900 574.0 97.74 1.51 0.151 25 9.80 0.610 13.23 0.944 669.3 107.86 1.35 0.111 26 9.13 0.798 12.45 0.824 548.0 105.38 1.37 0.155 27 8.97 0.565 13.49 0.871 572.1 75.34 1.51 0.147 28 8.85 0.645 13.32 0.914 548.9 86.97 1.51 0.154 29 8.97 0.681 13.78 1.430 585.0 111.39 1.54 0.173 30 8.67 0.634 12.53 0.991 497.0 94.10 1.45 0.134 31 8.48 0.663 12.88 0.926 491.1 101.11 1.52 0.111 32 9.15 0.789 13.60 1.170 600.5 115.71 1.50 0.196 33 6.53 0.571 8.70 0.783 196.7 41.20 1.34 0.148 34 6.78 0.503 8.87 0.615 215.6 40.25 1.31 0.107 35 7.15 0.476 9.32 0.663 250.8 40.23 1.31 0.124 36 6.98 0.500 9.77 0.785 251.1 43.99 1.41 0.143 37 6.68 0.334 8.77 0.666 205.1 22.28 1.32 0.137 38 6.88 0.520 8.92 0.720 223.5 43.26 1.30 0.116 39 6.53 0.414 9.55 0.758 213.3 24.64 1.47 0.174 40 5.82 0.464 8.73 0.626 156.3 28.68 1.50 0.125 41 6.70 0.484 9.17 0.711 217.0 38.47 1.38 0.135 42 6.58 0.417 8.40 0.770 191.1 27.86 1.28 0.156 43 6.37 0.556 8.98 0.688 192.9 41.25 1.42 0.139 44 6.62 0.387 8.50 0.881 195.8 32.12 1.29 0.140 45 6.15 0.494 9.07 0.568 181.2 33.23 1.48 0.135 46 6.10 0.481 8.08 0.588 158.3 25.73 1.33 0.148
with mean annual temperature and apothecia size as the explanatory variables was selected. A significant regres-sion equation was found [F2,29 = 17.83, P = 8.9 × 10⁻⁶, with
an R-squared of 0.5206]. Spore’s predicted width (in µm) is equal to 7.313 + 0.10 * mean temperature (in °C) + 0.12 * disc diameter (in mm). For spore length, a model with mean annual precipitation and elevation was selected. A significant regression equation was found [F2,29 = 12.13,
P = 1.5 × 10⁻⁴, with an R-squared of 0.418]. Spore’s
pre-dicted length (in µm) is equal to 14.248 + 0.00123 * mean precipitation (in mm) – 0.000819 * elevation (in m). For volume, a model with mean annual temperature and mean annual precipitation was selected. A significant regression equation was found [F2,29 = 26.48, P = 2.9 × 10⁻⁷, with an
R-squared of 0.6218]. Spore’s predicted volume (in µm3)
is equal to 216.824 + 21.81 * mean temperature (in °C) + 0.14 * mean precipitation (in mm). No significant regres-sion equation was found for Q.
Average spore size increases with annual rainfall in H. aff. damaziana (Table 5), and leeward localities are, at similar elevations, generally drier than windward localities (see above). Therefore, it is to be expected that
overall spore size will be smaller in the first ones, as highlighted in Figure 4. Taking separately into account samples collected in windward locations and those from leeward locations, the link between average spore vol-ume and elevation is clearly strengthened in the case of specimens from the twenty-three windward localities (Fig. 4; rs = −0.8409, P = 5.1 × 10⁻⁷, two-tailed), but it is
not significant for those from the nine leeward localities (Fig. 4; rs = −0.3515, P > 0.10, two-tailed).
Spore variation among localities in Hypotrachyna
altorum
The spores of H. altorum are smaller than those of H. aff.
damaziana, as shown by the measurements from 14
speci-mens: length 8.5–8.92–9.4 µm (Student’s t-test, t = 22.443, df = 44, P = 1.0 × 10⁻²⁵, two-tailed), width 6.2–6.56–
6.9 µm (Student’s t-test, t = 19.287, df = 44, P = 4.3 × 10⁻²³,
two-tailed), volume 175.1–203.48–231.9 µm3 (Welch’s
t-test, t = 25.068, df = 42, P < 0.0001, two-tailed). Over-all, they are also somewhat more globose (Q 1.29–1.37– 1.44) (Student’s t-test, t = 4.342, df = 44, P = 8.2 × 10⁻⁵,
two-tailed). One-way ANOVA of the data shows that Table 4. Intra- and interthalline variation of spore measurements and Q values estimated from the coefficients of variation (CV) of the samples for each of the two species H. aff. damaziana (in bold) and H. altorum (in italics). All values are in percentages. A two-tailed Student’s t-test was performed to compare the mean values of the CV of the samples between the two taxa (**: P < 0.01, *: P < 0.05, NS: not significant).
Intrathalline variation Interthalline variation min. value of CV
of samples max. value of CV of samples mean value of CV of samples CV of mean values of samples
Spore width 6.3 5.0 11.78.8 8.57.3 ** 5.05.6 Spore length 5.1 6.3 10.510.5 6.87.9 ** 5.35.1 Spore volume 13.3 11.0 27.121.6 19.417.1 * 13.514.2 Q 7.4 8.3 14.312.2 10.010.2 NS 5.25.7
Table 5. Results of two-tailed Spearman’s rank correlation between H. aff. damaziana spore traits and selected environmental factors. Correlation coefficients in bold type are statistically significant at P < 0.05 (significance levels adjusted with the sequential Bonferroni correction for tests involving climate parameters). CV: coefficient of variation.
Elevation Mean annual temperature Mean annual precipitation global solar radiationAnnual mean daily Mean width rs = −0.6413 P = 7.7 × 10⁻⁵ P = 8.9 × 10rs = 0.6981−6 rP = 0.076s = 0.3186 rsP = 0.053 = −0.3455 CV of width rs = −0.5653 P = 7.5 × 10⁻⁴ P = 1.7 × 10rs = 0.6829−5 rs = −0.1696P = 0.35 rsP = 0.029 = −0.3864 Mean length rs = −0.6268 P = 1.2 × 10⁻⁴ P = 8.9 × 10rs = 0.5587−4 rP = 0.056s = 0.3407 rsP = 0.94 = 0.0134 CV of length rs = 0.4953 P = 0.0039 rsP = 0.014 = −0.4284 rsP = 0.55 = 0.1109 rP = 0.042s = 0.3625 Mean volume rs = −0.7228 P = 3.0 × 10⁻⁶ P = 3.1 × 10rs = 0.7219−6 rP = 0.023s = 0.4020 rs = −0.2610P = 0.15 CV of volume rs = −0.3842 P = 0.030 rP = 0.0023s = 0.5203 rs = −0.1005P = 0.58 rs = −0.1861P = 0.31 Mean Q rs = −0.0187 P = 0.92 rs = −0.0736P = 0.69 rsP = 0.41 = 0.1504 rP = 0.029s = 0.3875 CV of Q rs = −0.1041 P = 0.57 rsP = 0.48 = 0.1294 rsP = 0.92 = 0.0176 rs = −0.0269P = 0.88
there is a very significant difference across mean length (F13,406 = 12.072, P = 2.7 × 10⁻²²), width (F13,406 = 17.253,
P = 1.1 × 10⁻³¹), volume (F
13,406 = 19.428, P = 2.3 × 10⁻³⁵)
and Q (F13,406 = 8.943, P = 3.3 × 10⁻¹⁶) among the 14
sam-ples. The Hartigans’ dip test shows, however, that there is no reason to consider the study population as heterogene-ous, either for length (P = 0.99), width (P = 0.98), volume (P = 0.61) or Q values (P = 0.82). Intrathalline variation of spore size or shape parameters is fairly comparable to that of H. aff. damaziana (Table 4). However, the mean CV values of the samples differ significantly between the two species for length (Student’s t-test, t = 3.428, df = 44, P = 0.0013, two-tailed), width (t = 2.930, df = 44,
P = 0.0054, two-tailed) and volume (t = 2.319, df = 44, P = 0.025, two-tailed). Interthalline variation, on the other
hand, is remarkably similar between the two species. As for H. aff. damaziana, the comparison between intra- and interthalline variation shows that the former is higher than the latter (Table 4).
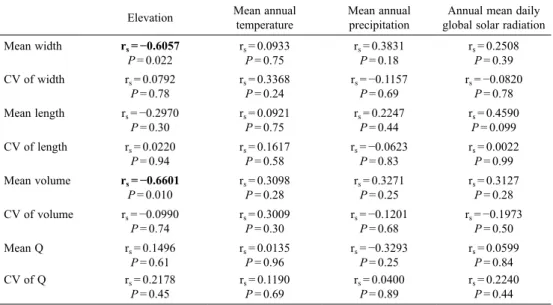
Despite the relatively narrow elevational range of
H. altorum (1485–1850 m), the mean width and volume
values are significantly correlated with the elevation of the surveyed localities. Both decrease as elevation increases (Table 6, Fig. 3). In H. altorum, as in H. aff. damaziana, the shape of spores does not appear to change with ele-vation (Table 6). For volume and width, a regression model with elevation as the only explanatory variable was selected. Significant regression equations were found [F1,12 = 8.442, P = 0.0132, with an R-squared of 0.3641 for
volume and F1,12 = 7.387, P = 0.0187, with an R-squared of
0.3295 for width, respectively]. Spore’s predicted volume (in µm3) is equal to 461.193 – 0.153 * elevation (in m)
and spore’s predicted width is equal to 9.708 – 0.00187 * elevation (in m), respectively. No significant regression equation was found for length and Q.
For H. altorum, no significant relation between the biometric parameters and the three selected climatic var-iables was found (Table 6).
Discussion
Intraspecific variation
The two species investigated belong to the same genus but are not closely related. According to a preliminary molecular phylogenetic analysis (Masson & Sérusiaux unpubl. data), including 14 of the 46 samples studied here (10 of H. aff. damaziana and 4 of H. altorum, cf. Table 1 & Fig. 3), H. aff. damaziana belongs to subge-nus Parmelinopsis and H. altorum to subgesubge-nus
Hypo-trachyna (as defined by Divakar et al. 2013), subgenera
that split off during the Oligocene according to Cubas et al. (2018). This phylogenetic analysis also shows that the 10 specimens attributed to H. aff. damaziana on morphological and chemical criteria are genetically very similar according to their ITS rDNA gene sequences, as are the 4 specimens attributed to H. altorum. This is in agreement with the ‘normal’ interthalline variability of the spore parameters of the two Hypotrachyna species (see comments on the evaluation of spore variability in Parmasto & Parmasto 1987) and with the results of the Hartigans’ dip test suggesting unimodality in interthalline variability of spore features in the two taxa. All these data are consistent with the hypothesis that each of the two species represents a homogeneous population. Therefore, the interthalline variation in spore size highlighted in this work is assumed to represent only intraspecific variation within the two species. Variation due to the additional presence of one or more cryptic taxa is unlikely.
Intraspecific variation in ascospore size and shape has rarely been studied in detail in lichens, and we are not aware of any comprehensive and synthetic work on this subject comparable to that of Parmasto & Parmasto (1987) on basidiospores in the hymenomycetes. Intra-in-dividual variation, in particular, is seldom investigated. In a pioneering work, Löfgren & Tibell (1979) studied the variation in mean length and width of ascospores between ten apothecia from a specimen of Sphinctrina Table 6. Results of two-tailed Spearman’s rank correlation between H. altorum spore traits and selected environmental factors. Correlation coeffi-cients in bold type are statistically significant at P < 0.05 (significance levels adjusted with the sequential Bonferroni correction for tests involving climate parameters). CV: coefficient of variation.
Elevation Mean annual temperature Mean annual precipitation global solar radiationAnnual mean daily Mean width rs = −0.6057 P = 0.022 rsP = 0.75 = 0.0933 rsP = 0.18 = 0.3831 rsP = 0.39 = 0.2508 CV of width rs = 0.0792 P = 0.78 rsP = 0.24 = 0.3368 rs = −0.1157P = 0.69 rs = −0.0820P = 0.78 Mean length rs = −0.2970 P = 0.30 rsP = 0.75 = 0.0921 rsP = 0.44 = 0.2247 rP = 0.099s = 0.4590 CV of length rs = 0.0220 P = 0.94 rsP = 0.58 = 0.1617 rs = −0.0623P = 0.83 rsP = 0.99 = 0.0022 Mean volume rs = −0.6601 P = 0.010 rsP = 0.28 = 0.3098 rsP = 0.25 = 0.3271 rsP = 0.28 = 0.3127 CV of volume rs = −0.0990 P = 0.74 rsP = 0.30 = 0.3009 rs = −0.1201P = 0.68 rs = −0.1973P = 0.50 Mean Q rs = 0.1496 P = 0.61 rsP = 0.96 = 0.0135 rs = −0.3293P = 0.25 rsP = 0.84 = 0.0599 CV of Q rs = 0.2178 P = 0.45 rsP = 0.69 = 0.1190 rsP = 0.89 = 0.0400 rsP = 0.44 = 0.2240
anglica. No coefficient of variation was calculated in
that work, but according to their figure 3 it is possible to estimate variation in mean spore size between apothecia of ~3–4%. The values obtained with H. aff. damaziana, fol-lowing a similar protocol, are quite comparable although somewhat lower: the four coefficients of variation calcu-lated from the means of size and shape parameters range between 1.1% and 2.2%. No significant differences in mean spore size or shape were observed between the ten apothecia of the same H. aff. damaziana specimen. Parmasto & Parmasto (1987) came to the same conclu-sion in a comparison of basidiospores from different pilei having a common stem in one Collybia and two Pleurotus species. It has been shown in Basidiomycota that the size of spores may depend on the size of the basidioma that produces them (e.g., Hanna 1926; Parmasto & Parmasto 1987). Depending on the species, the correlation between spore size and diameter of the pileus can be positive or negative (Clémençon 1979). The same is true for the two lichenized Ascomycota studied: a positive significant correlation between the diameter of the hymenial disc and mean spore width and volume in H. aff. damaziana, and a negative one between disc diameter and mean spore length and volume in H. altorum. However, when performing multiple linear regressions with elevation, climatic parameters and diameter of the apothecia as explanatory variables, the diameter of the apothecia was only selected as a significant explanatory variable for the width of spores in H. aff. damaziana. On the other hand, models with only elevation or climatic variables were selected to predict spore length and volume in H. aff.
damaziana, and spore volume and width in H. altorum.
The variation of size and shape between spores within an apothecium is much greater than the variation in mean spore size and shape between apothecia of the same thallus, and thus constitutes the essential component of intrathalline variation. The variability of the size and shape of spores produced by one individual is not negli-gible. Thus, the smallest and the largest spores, within the 90% tolerance limits of intrathalline variation, have a vol-ume ratio of 1/1.6–2.7 in H. aff. damaziana and 1/1.5–2.5 in H. altorum. The size variability of spores produced by the same thallus could be caused by ‘competition’ between developing spores within the limited volume of each ascus. However, similar values of intrathalline variation were obtained by Parmasto & Parmasto (1987) from basidiospores, whereas the development of these is much less constrained by the available space (Halbwachs & Bässler 2015). These authors have proposed to consider this intra-individual variation as a compromise, controlled by natural selection, meeting the need for local as well as long-distance dispersal. Small wind-borne spores are dispersed over greater distances than large spores are (Norros et al. 2014).
Influence of elevation and climatic factors
As expected, mean spore size varies with elevation. In both species studied, mean length, width and volume decrease as elevation increases, with particularly signifi-cant variation for spore width and spore volume. Unlike
size, the shape of spores (expressed by the Q value) does not vary significantly with elevation for the two species investigated. It is interesting to note that the intrathalline variability of the three spore size parameters of H. aff.
damaziana also changes with elevation. The CV of width
and volume decreases, while the CV of length increases with elevation.
Variation in mean spore volume between H. aff.
dama-ziana specimens could be correlated with two climatic
variables: mean annual rainfall and, especially, mean annual temperature of the sampling localities. Mean vol-ume is greater in places with higher average temperature or higher rainfall. In this species, the change in tempera-ture leads not only to a substantial change in mean spore size between specimens, but also to a significant change in intrathalline variability. No significant correlation between climatic variables and the mean spore size of H. altorum was found, although size decreased with elevation. It is likely that the low resolution of the available climatic data, the small number of localities investigated, and their heterogeneity with regard to their exposure to trade winds (6 windward vs. 8 leeward localities) are responsible for the lack of correlation in this species. Laboratory and out-door cultures of various species of non-lichenized fungi have shown that the size of their spores varied significantly under the effect of various environmental factors such as temperature, humidity, light, pH, etc. (e.g., Williams 1959; Dingley 1962; Petrie 1994). These studies also make it clear that responses vary among taxa. For example, the length of spores decreases when the temperature rises from 15°C to 25°C in Mucor dispersus but increases in Sordaria fimicola (Williams 1959). The underlying mechanisms leading to these differences in variation are unfortunately not identified. The growth of a single cell such as an ascospore of Hypotrachyna is not directly comparable to that of the whole thallus of a lichen, but in both cases the influence of temperature seems to have the same effect. Depending in particular on their respec-tive elevations, the thirty-two localities where specimens of H. aff. damaziana were collected have annual mean temperature varying from 11°C to 21.5°C. It has been shown that within this temperature range the growth of numerous lichen mycobionts in isolated culture increases with temperature (Thomas 1939; Henriksson 1964). Net photosynthesis, on the other hand, increases from 10°C to ~20°C in several tropical epiphytic foliose lichens (Zotz et al. 1998, 2003; Lange et al. 2004), whereas mean radial growth, measured in the field, shows a significant posi-tive linear correlation with mean air temperature (range: ~ −5°C to +15°C) in two parmelioid lichen species of the genus Xanthoparmelia (Benedict 1990).
Taxonomic observations
The variability in the size and shape of mature spores pro-duced by an individual, as well as the variability among individuals of the same species, are due to environmen-tal and genetic factors. The present study suggests an influence of elevation on spore size in two species of lichenized fungi. This influence would be exerted at both intra- and inter-individual levels in H. aff. damaziana
and at least at the inter-individual level in H. altorum. It is noteworthy that the interthalline variation, that is, the variation in mean spore dimensions or shape index (Q) between specimens of one species, remains relatively low despite the wide elevational range of H. aff. damaziana (from 620 m to 2375 m a.s.l.). This inter-individual vari-ability is also remarkably similar between the two species
H. altorum and H. aff. damaziana for all four investigated
variables. The coefficients of variation for length, width or shape are between 5.0% and 5.7% for the two
Hypo-trachyna species. These results are slightly lower than the
average values obtained by Parmasto & Parmasto (1987) from basidiospores for the same parameters (length: 6.5%, width: 6.3%, Q: 6.1%). In three parmelioid lichens of the genus Parmelina, interthalline variation, estimated with coefficients of variation values, ranged from 2.8% to 6.4% for length, 3.9% to 7.4% for width, and 3.4% to 10.2% for Q (our own calculations, adapted from Argüello et al. 2007 – Table 2).
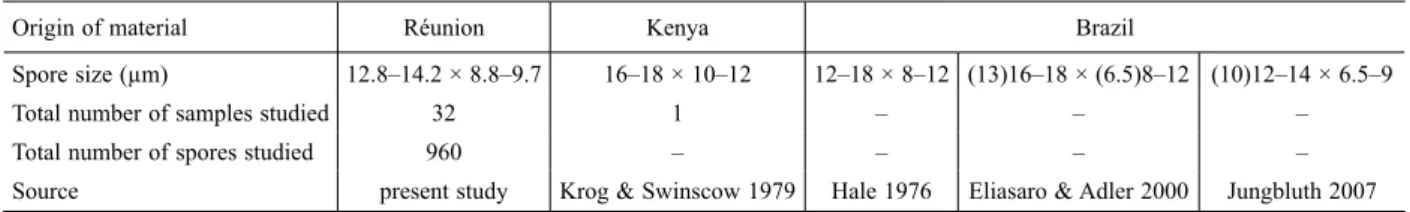
Measurements of spores constitute an essential part of descriptions of fungi, whether lichenized or not (Hawksworth 1974). The general usage is to present the range of the ‘normal’ variation of spore measurements, often with the extremes recorded in parentheses. Most often, unfortunately, the values presented combine both intra- and inter-individual variability. The variation of spores between individuals of a species is a character of that species, and not the variation within one individual, which is a character of that particular individual. In addi-tion, intra-individual variability in spore size and shape is not an adequate indicator of inter-individual variability (see Parmasto & Parmasto 1987 for a detailed discussion). The generally applied combination of intra- and inter-in-dividual variation leads to a wider range of variability than that obtained only from the individual mean values of spore measurements, and it introduces considerable background noise (Raitviir 1972). The current lack of standardization in establishing ranges of variation in spore measurements usually prevents any relevant comparison between the data published by different authors. This is the case, for example, for the taxa in the H. damaziana complex (Table 7).
Acknowledgements
We warmly thank Paul Diederich (Luxembourg), Claude Roux (Mirabeau) and the anonymous reviewers for helpful suggestions and constructive comments on various versions of the manu-script. Fieldwork of the first author in Réunion National Park was carried out under permits DIR/I/2012/034, DIR/I/2013/046, DIR/I/2015/102 and DIR/I/2017/100. It is a great pleasure to dedicate this contribution to Emmanuël Sérusiaux for his
assistance and encouragement in the study of parmelioid lichens in Réunion by the first author.
References
Argüello, A., Del Prado, R., Cubas, P. & Crespo, A. 2007. Parmelina quercina (Parmeliaceae, Lecanorales) includes four phylogeneti-cally supported morphospecies. Biological Journal of the Linnean Society 91: 455–467.
Benedict, J. B. 1990. Experiments on lichen growth. I. Seasonal pat-terns and environmental controls. Arctic and Alpine Research 22: 244–254.
Clémençon, H. 1979. Biometrische Untersuchungen zur Variabilität der Basidiosporen. Beihefte zur Sydowia 8: 110–138.
Clerc, P. 1984. Contribution à la révision systématique des Usnées (As-comycotina, Usnea) d’Europe I. Usnea florida (L.) Wigg. emend. Clerc. Cryptogamie, Bryologie et Lichénologie 5: 333–360. Cubas, P., Lumbsch, H. T., Del Prado, R., Ferencova, Z., Hladun, N. L.,
Rico, V. J. & Divakar, P. K. 2018. Historical biogeography of the lichenized fungal genus Hypotrachyna (Parmeliaceae, Ascomy-cota): insights into the evolutionary history of a pantropical clade. The Lichenologist 50: 283–298.
Dingley, J. M. 1962. Pithomyces chartarum, its occurrence, morphology, and taxonomy. New Zealand Journal of agricultural Research 5: 49–61.
Divakar, P. K., Crespo, A, Núñez-Zapata, J., Flakus, A., Sipman, H. J. M., Elix, J. A. & Lumbsch, H. T. 2013. A molecular perspec-tive on generic concepts in the Hypotrachyna clade (Parmeliaceae, Ascomycota). Phytotaxa 132: 21–38.
Doré, C. J., Cole, M. S. & Hawksworth, D. L. 2006. Preliminary sta-tistical studies of the infraspecific variation in the ascospores of Nesolechia oxyspora growing on different genera of parmelioid lichens. The Lichenologist 38: 425–434.
Eliasaro, S. & Adler, M. T. 2000. The species of Canomaculina, Mye-lochroa, Parmelinella, and Parmelinopsis (Parmeliaceae, lichenized Ascomycotina) from the ‘Segundo Planalto’ in the state of Paraná, Brazil. Acta Botanica Brasilica 14: 141–149.
Flakus, A., Etayo, J., Schiefelbein, U. L. F., Ahti, T., Jablónska, A., Oset, M., Bach, K., Flakus, P. R. & Kukwa, M. 2012. Contribution to the knowledge of the lichen biota of Bolivia. 4. Polish Botanical Journal 57: 427–461.
Fox, J., Weisberg, S., Adler, D., Bates, D. et al. 2012. Package ‘car’. Vienna: R Foundation for Statistical Computing.
Gauslaa, Y. 2014. Rain, dew, and humid air as drivers of morphology, function and spatial distribution in epiphytic lichens. The Liche-nologist 46: 1–16.
Halbwachs, H. & Bässler, C. 2015. Gone with the wind – a review on basidiospores of lamellate agarics. Mycosphere 6: 78–112. Haldane, J. B. S. 1955. The measurement of variation. Evolution 9: 484. Hale, M. E. 1976. A monograph of the lichen genus Parmelina Hale
(Parmeliaceae). Smithsonian Contributions to Botany 33: 1–60. Hanna, W. F. 1926. The inheritance of spore size in Coprinus
sterquili-nus. Transactions of the British Mycological Society 11: 219–238. Hawksworth, D. L. 1973. Ecological factors and species delimitation
in the lichens. In: Heywood, V. H. (ed.), Taxonomy and Ecology, pp. 31–69. Academic Press, London.
Table 7. Ascospore dimensions of taxa of the H. damaziana complex according to different authors.
Origin of material Réunion Kenya Brazil
Spore size (µm) 12.8–14.2 × 8.8–9.7 16–18 × 10–12 12–18 × 8–12 (13)16–18 × (6.5)8–12 (10)12–14 × 6.5–9
Total number of samples studied 32 1 – – –
Total number of spores studied 960 – – – –
Hawksworth, D. L. 1974. Mycologist’s Handbook. An introduction to the principles of taxonomy and nomenclature in the fungi and lichens. Commonwealth Mycological Institute, Kew.
Henriksson, E. 1964. Studies in the physiology of the lichen Collema. V. Effect of medium, temperature, and pH on growth of the mycobiont. Svensk Botanisk Tidskrift 58: 361–370.
Holm, S. 1979. A simple sequentially rejective multiple test procedure. Scandinavian Journal of Statistics 6: 65–70.
Jumaux, G., Quetelard, H. & Roy, D. 2011. Atlas climatique de La Réunion. Météo-France.
Jungbluth, P. 2006. A família Parmeliaceae (fungos liquenizados) em cerrados do Estado de São Paulo, Brasil. Dissertação (mestrado), Instituto de Botânica da Secretaria de Estado do Meio Ambiente, São Paulo.
Kassambara, A. 2017. ggpubr: ‘ggplot2’ based publication ready plots. R package version 0.1.6.
Kershaw, K. A. 1985. Physiological ecology of lichens. Cambridge University Press, Cambridge.
Kirika, P. M., Divakar, P. K., Crespo, A. & Lumbsch, H. T. 2019. Molec-ular and phenotypical studies on species diversity of Hypotrachyna (Parmeliaceae, Ascomycota) in Kenya, East Africa. The Bryologist 122: 140–150.
Körner, C. 2007. The use of ‘altitude’ in ecological research. Trends in Ecology & Evolution 22: 569–574.
Krog, H. & Swinscow, T. D. V. 1979. Parmelia subgenus Hypotrachyna in East Africa. Norwegian Journal of Botany 26: 11–43. Lange, O. L., Büdel, B., Meyer, A., Zellner, H. & Zotz, G. 2004. Lichen
carbon gain under tropical conditions: water relations and CO2
exchange of Lobariaceae species of a lower montane rainforest in Panama. The Lichenologist 36: 329–342.
Le Roux, J. J., Strasberg, D., Rouget, M., Morden, C. W., Koordom, M. & Richardson, D. M. 2014. Relatedness defies biogeography: the tale of two island endemics (Acacia heterophylla and A. koa). New Phytologist 204: 230–242.
Löfgren, O. & Tibell, L. 1979. Sphinctrina in Europe. The Lichenologist 11: 109–137.
Martínez, I. & Burgaz, A. R. 1998. Revision of the genus Solorina (Li-chenes) in Europe based on spore size variation. Annales Botanici Fennici 35: 137–142.
Masson, D. 2012. Hypotrachyna altorum sp. nov., a new lichen from the cloud forests of Réunion Island, Indian Ocean. Cryptogamie, Mycologie 33: 203–212.
Nash III, T. H., Pérez-Pérez, R. E. & Elix, J. A. 2016. Hypotrachyna in Mexico. Bibliotheca Lichenologica 110: 155–256.
Norros, V., Rannik, U., Hussein, T., Petäjä, T., Vesala, T. & Ovaska-inen, O. 2014. Do small spores disperse further than large spores? Ecology 95: 1612–1621.
Núñez-Zapata, J., Divakar, P. K., Del-Prado, R., Cubas, P., Hawksworth, D. L. & Crespo, A. 2011. Conundrums in species concepts: the discovery of a new cryptic species segregated from Parmelina tiliacea (Ascomycota: Parmeliaceae). The Lichenologist 43: 603–616.
Palmqvist, K., Dahlman, L., Jonsson, A. & Nash III, T. H. 2008. The carbon economy of lichens. In: Nash III, T. H. (ed.), Lichen Biol-ogy. Ed. 2, pp. 182–215. Cambridge University Press, New York.
Parmasto, E. & Parmasto, I. 1987. Variation of basidiospores in the Hymenomycetes and its significance to their taxonomy. Bibliotheca Mycologica 115: 1–168.
Pena, E. A. & Slate, E. H. 2012. gvlma: Global validation of linear models assumptions. R package version 1.0. 0.1.
Pentecost, A. 1981. Some observations on the size and shape of lichen ascospores in relation to ecology and taxonomy. New Phytologist 89: 667–678.
Petrie, G. A. 1994. Effects of temperature and moisture on the num-ber, size and septation of ascospores produced by Leptosphaeria maculans (blackleg) on rapeseed stubble. Canadian Plant Disease Survey 74: 141–151.
Poelt, J. 1973. Systematic evaluation of morphological characters. In: Ahmadjian, V. & Hale, M. E. (ed.), The lichens, pp. 91–115. Aca-demic Press, New York and London.
R Core Team 2018. R: A language and environment for statistical com-puting. R Foundation for statistical computing, Vienna.
Raitviir, A. 1972. Statistical methods and species delimitation in the genus Otidea. Persoonia 6: 415–423.
Rice, W. R. 1989. Analyzing tables of statistical tests. Evolution 43: 223–225.
Strasberg, D., Rouget, M., Richardson, D. M., Baret, S., Dupont, J. & Cowling, R. M. 2005. An assessment of habitat diversity and transformation on La Réunion Island (Mascarene Islands, Indian Ocean) as a basis for identifying broad-scale conservation priorities. Biodiversity and Conservation 14: 3015–3032.
Thomas, E. A. 1939. Über die Biologie von Flechtenbildnern. Beiträge zur Kryptogamenflora der Schweiz 9: 1–205.
Truong, C., Naciri, Y. & Clerc, P. 2009. Multivariate analysis of ana-tomical characters confirms the differentiation of two morpholog-ically close species, Melanohalea olivacea (L.) O. Blanco et al. and M. septentrionalis (Lynge) O. Blanco et al. The Lichenologist 41: 649–661.
Van den Boom, P. P. G., Brand, M., Ertz, D., Kalb, K., Magain, N., Masson, D., Schiefelbein, U., Sipman, H. J. M. & Sérusiaux, E. 2011. Discovering the lichen diversity of a remote island: working list of species collected on Reunion (Mascarene archipelago, Indian Ocean). Herzogia 24: 325–349.
Van Herk, C. M., Aptroot, A. & van Dobben, H. F. 2002. Long-term monitoring in the Netherlands suggests that lichens respond to global warming. The Lichenologist 34: 141–154.
Weber, W. A. 1977. Environmental modification and lichen taxonomy. In: Seaward, M. R. D. (ed.), Lichen Ecology, pp. 9–29. Academic Press, London.
Wickham, H. 2012. reshape2: Flexibly reshape data: a reboot of the reshape package. R package version 1.2
Wickham, H., François, R., Henry, L. & Müller, K. 2016. dplyr: A gram-mar of data manipulation. R package version 0.5.
Williams, C. N. 1959. Spore size in relation to culture conditions. Trans-actions of the British Mycological Society 42: 213–222.
Zotz, G., Büdel, B., Meyer, A., Zellner, H. & Lange, O. L. 1998. In situ studies of water relations and CO2 exchange of the tropical
macrolichen, Sticta tomentosa. New Phytologist 139: 525–535. Zotz, G., Schultz, S. & Rottenberger, S. 2003. Are tropical lowlands
a marginal habitat for macrolichens? Evidence from a field study with Parmotrema endosulphureum in Panama. Flora 198: 71–77.