Biogeochemistry and carbon budget during a coccolithophorid bloom
in the northern Bay of Biscay (June 2006)
INTRODUCTION
During coccolithophorid blooms, carbon (C) cycling in the photic zone is driven by the production and the degradation of organic matter (primary production and community respiration), as well as the production and the dissolution of biogenic calcium carbonate (CaCO3). Organic and inorganic metabolisms lead to a transfer of carbon to depth and both impact the flows of carbon dioxide (CO2) in the water column and the CO2 flux across the air-sea interface. Furthermore, due to complex dynamics of coccolithophores, the impact of metabolic C fluxes on CO2 fluxes is variable in time, depending on the stage of the bloom development, and mainly on the ratio of calcification to primary production (CAL:GPP). Understanding and quantifying C cycling of coccolithophorid blooms in natural conditions is a prerequisite to correctly validate biogeochemical models aiming at predicting feedbacks related to ocean acidification, which incorporate knowledge obtained from perturbation laboratory experiments.
We carried out a trans-disciplinary cruise on board the R/V Belgica at the continental margin of the Bay of Biscay in June 2006 (Fig. 1), in the midst of a coccolithophorid bloom, during which 14C primary production (GPP
p), 14C calcification (CAL) and O2-based pelagic community respiration rates (PCR) were determined in the water column.
Harlay J.
1, Borges A.V.
2, De Bodt C.
1, d’Hoop Q.
1, Piontek J.
3, Roevros N.
1, Suykens K.
2, Van Oostende N.
4,
Engel A.
3, Groom S.
5, Sabbe K.
4, and Chou L.
1Fig. 1: a- AVHRR sea surface temperature (SST) in the northern Bay of Biscay, showing the location of the stations, the 200 m and 2000 m isobaths, b- MODIS chlorophyll-a (Chl-a) and c- Reflectance satellite images.
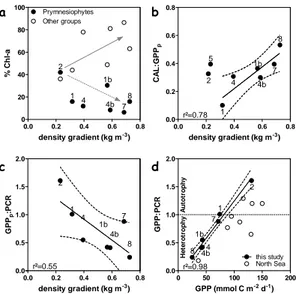
Fig. 3: a- Depth averaged HPLC relative percentage of Prymnesiophytes (filled circles) and other phytoplankton groups (open circles) in the 30 m top layer, b- calcification to gross particulate primary production (CAL:GPPp) ratio and c- GPPpto pelagic respiration
(GPPp:PCR) ratio versusthe degree stratification computed as the difference of density at
3 m depth and at 100 m depth. The linear regression and the 95% confidence interval (dashed curves) are represented together with the determination coefficient (r²). d-GPP:PCR ratio versusGPP in June 2006 in the Bay of Biscay (filled circles) and in June 1999 (open circles) for the North Sea (Robinson et al., 2002).
Table 1: Carbon fluxes [mmol C m-2d-1] based on a mass balance where the 14C incubations are
assumed to correspond to gross primary production (GPPp), where pelagic community
respiration (PCR) is the sum of autotrophic and heterotrophic respiration based on oxygen incubations converted to C units using a respiratory quotient of 1, and where CAL is the rate of calcification based on 14C incubations.
CONCLUSIONS
Our classical C-budgeting approach suffers from several caveats. Firstly, steady state is assumed but C production and degradation are decoupled in time and space, as well as biomineralization and dissolution. Secondly, the dissolved production (GPPd) is not considered here. The importance of GPPdand its potential fate to be transformed into transparent exopolymer particles (TEP) could constitute a significant C flux (12% of the POC, Harlayet al., 2009) to sustain the heterotrophic C demand in the twilight zone, as suggested by Koeve (2005).
The estimate of GPPdfrom the particulate nitrogen to carbon ratio in surface waters, based on the parameterization by Joassinet al. (2008) and the computation of C budget based on GPPtot(GPPtot= GPPd+ GPPp) contributes to the budgeting of C fluxes to the twilight zone by providing a net export of the same magnitude as the aphotic demand (Harlayet al. in prep).
0.2 0.4 0.8 2 5 0.08 1 2 3 4 5 6 7 8 2006/06/05 1 2 3 4 6 7 8 2006/06/05 5 6 W 8 W 12 W 10 W 14 W 14 W 12 W 10 W 8 W 6 W a 52 51 50 49 48 47 b 6 W 8 W 12 W 10 W 14 W 52 51 50 49 48 47 1 3 4 5 6 7 8 2006/06/05 c 2 20 0 m 20 00 m 0.2 0.4 0.8 2 5 0.08 1 2 3 4 5 6 7 8 2006/06/05 0.2 0.4 0.8 2 5 0.08 1 2 3 4 5 6 7 8 2006/06/05 1 2 3 4 6 7 8 2006/06/05 5 12 3 4 6 7 8 2006/06/05 1 2 3 4 6 7 8 2006/06/05 5 6 W 8 W 12 W 10 W 14 W 14 W 12 W 10 W 8 W 6 W a 52 51 50 49 48 47 b 6 W 8 W 12 W 10 W 14 W 52 51 50 49 48 47 1 3 4 5 6 7 8 2006/06/05 c 2 1 3 4 5 6 7 8 2006/06/05 c 2 20 0 m 20 00 m 0 50 100 150 200 m ixed l a y e r dept h (m ) 0.00 0.25 0.50 0.75 1.00 1.25 1.50 mW c m -2 µm -1 sr -1 0 1 2 3 4 5 10 12 14 16 18 20 22 J F M A M J J A S Months (2006) µg L -1 °C Chl-a nWLr SST MLd Cruise
Fig. 2: Time series of remotely sensed weekly Chl-a concentrations and normalized water-leaving radiance @555 nm (nWLr), modelled daily mixed layer depth (MLd) and SST in the study area from January to September 2006. Chl-a and nWLr are Level-3 SeaWiFS data (http://reason.gsfc.nasa.gov/Giovanni/) and MLd and SST were simulated with Met Office National Centre for Ocean Forecasting for the North-East Atlantic 1/8° model (http://www.nerc-essc.ac.uk/godiva/).
Station Date pCO2 GPPp CAL PCR GPPp CAL PCR
Net CO2 flux based on metabolic rates Net CO2 flux based on measured pCO2 Export Aphotic C demand 5 2 June 320 74.2 24.2 - -74.2 14.5 - - -9.1 - -2 1 June 306 130.8 51.7 81.3 -130.8 31.0 81.3 -18.5 -11.4 49.5 89.0 1 31- May 265 74.2 7.5 73.7 -74.2 4.5 73.7 4.0 -17.8 0.5 98.2 4 (HR) 2 June 293 43.3 13.3 78.9 -43.3 8.0 78.9 43.6 -13.4 -35.6 66.9 1b 9 June 273 43.3 15.8 103.5 -43.3 9.5 103.5 69.7 -16.1 -60.2 159.0 4b (HR) 8 June 307 41.7 12.5 101.2 -41.7 7.5 101.2 67.0 -10.7 -59.5 168.5 7 (HR) 7 June 309 71.7 28.3 81.4 -71.7 17.0 81.4 26.7 -10.2 -9.7 35.1 8 (HR) 6 June 325 25.0 13.3 104.3 -25.0 8.0 104.3 87.3 -8.5 -79.3 72.3 C fluxes
Rate measurements CO2 Fluxes
RESULTS
The time series of remotely sensed parameters reveals a rise of SST accompanied by a shoaling of the thermocline to 25 m depthduring the period
of the cruise (Fig. 2). This situation is favourable for coccolithophorid
development, as indicated by the elevated nWLr and moderate (~1 µg L-1) Chl-a concentration (Fig. 2) and nutrient exhaustion (not shown).
In agreement with Margalef’s Mandala, the degree of stratification was hypothesized to control the biological processes and allowed the reconstruction of the succession phases of the coccolithophore-dominated bloom (Fig. 3). Bloom aging was characterized by a decrease in Prymnesiophyte biomass relative to other phytoplankton groups (Fig. 3a). With increasing stratification from early coccolithophorid bloom stations (1-2-5) to the later stages (station 8), GPPp decreased as CAL increased over the shelf, leading to a significant CAL:GPPpratio for later stages of the bloom (Fig. 3b). The aging of the bloom resulted in a lower GPP:PCR ratio (Fig. 3c) and an evolution from net phytoplanktonic community autotrophy to net heterotrophy (Fig. 3d). Consistency of this ratio was checked against Robinson et al. (2002) in the North Sea (Fig. 3d).
A C-budget was computed along a gradient from the productive (station 2) to the high reflectance zone (station 8). Surface waters remained as a net sink for atmospheric CO2(Table 1), although total alkalinity data (not shown) indicated that calcification had a large impact on surface carbonate chemistry. However, net autotrophy was only found for the early phase of the bloom (station 2) where the potential export was of the same magnitude as the aphotic C demand. In other cases, the C export was null or negative and insufficient to sustain aphotic demand.
References:
Harlayet al. (2009) Abundance and size distribution of transparent exopolymer particles (TEP) in a coccolithophorid bloom in the northern Bay of Biscay.Deep Sea Research part I. accepted
Joassinet al. (2008) A mathematical modeling of an Emiliania huxleyi coccolithophores bloom occuring in a mesocosm experiment. Biogeoscience discussions.
Koeve (2005) Magnitude of excess carbon sequestration into the deep ocean and the possible role of TEP. Marine Ecology Progress series. 291: 53-64
Robinson et al. (2002) Plankton community respiration during a coccolithophore bloom. Deep Sea Research Part II. 49(15): 2929-2950
a d c b 0.0 0.2 0.4 0.6 0.8 0 20 40 60 80 100 Prymnesiophytes Other groups 8 7 4b 1b 4 1 2 density gradient (kg m-3) % C h l-a 0.0 0.2 0.4 0.6 0.8 0.0 0.2 0.4 0.6 0.8 8 7 4b 1b 4 1 5 2 r²=0.78 density gradient (kg m-3) CA L :GP Pp 0.0 0.2 0.4 0.6 0.8 0.0 0.5 1.0 1.5 2.0 8 7 4b 1b 4 1 2 r²=0.55 density gradient (kg m-3) GPP p :P C R 0 50 100 150 200 0.0 0.5 1.0 1.5 2.0 North Sea this study r²=0.98 H e te ro tr op hy A u to tr o p h y 2 1 7 1b 4 4b 8 GPP (mmol C m-2 d-1) GPP: PC R Affiliations:
1. Université Libre de Bruxelles (ULB) - Laboratoire d’Océanographie physique et Géochimie des Eaux 2. Université de Liège (ULg) - Chemical Oceanography Unit
3. Alfred Wegener Institut (AWI) - HGF Young Investigator Group 4. Ghent University (UGhent) - Protistology & Aquatic Ecology 5. Plymouth Marine Laboratory (PML) - Remote Sensing Group Acknowledgments:
The authors would like to thank the officers and crewmembers of the R/V Belgica and the Unit of the North Sea Mathematical Models (Brussels/Oostende, Belgium) for their support in data acquisition. We are grateful to T. Smyth and P. Miller for the AVHRR image. This study was financed by the Belgian Federal Science Policy Office in the framework of the PEACE project (contract no. SD/CS/03A/B) and by the Helmholtz Association (contract no. HZ-NG-102). AVB is a research associate at the FNRS. C. De Bodt was supported by a PhD grant from the EU FP6 IP CarboOcean project (contract no. 511176–2). N. Van Oostende received a PhD grant from the Institute for the Promotion of Innovation through Science and Technology in Flanders (IWT-Vlaanderen). This work is a contribution to the EU FP6 European Network of Excellence EUR– OCEANS (contract no. 511106-2) and EU IP CARBOOCEAN (contract no. 511176).
http://www.co2.ulg.ac.be/peace European Geosciences Union
General Assembly 2009