Subfield effects on the core of coauthors
Hassan Bougrine1(1) Bibliothèque des Sciences et Techniques (BST), Université de Liège, B6a, allée de la Chimie 3, 4000 Liège, Belgium
Hassan Bougrine
Email: [email protected]
Published online: 27 June 2013 , Scientometrics (2014) 98:1047–1064 DOI 10.1007/s11192-013-1066-9
Abstract
It is examined whether the number (J) of (joint) publications of a "main scientist" with her/his coauthors ranked according to rank (r) importance, i.e. J ∝ 1/r, as found by Ausloos
(Scientometrics 95:895–909, 2013) still holds for subfields, i.e. when the "main scientist" has worked on different, sometimes overlapping, subfields. Two cases are studied. It is shown that the law holds for large subfields. As shown, in an Appendix, is also useful to combine small topics into large ones for better statistics. It is observed that the sub-cores are much smaller than the overall coauthor core measure. Nevertheless, the smallness of the core and sub-cores may imply further considerations for the evaluation of team research purposes and activities. Keywords
Ranking. Power laws. Co-authorship. Research topics. Coauthor core
Introduction
Ausloos (2013) has found a simple power law relating the number of coauthors of a scientist with their rank, measured through the number of coauthored papers. The number (J) of (joint) publications with coauthors ranked according to rank (r) importance, indicates that J ∝ 1/r
α
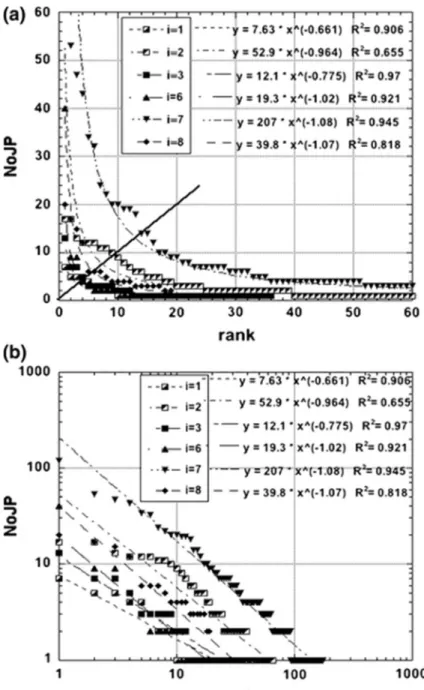
, with α ≃ 1. For example, comparing Ausloos (MRA) and another major scientist in statistical physics H.E. Stanley (HES) list of coauthors (more than 310 and 480 respectively) and the joint publications (more than 560 and 870 respectively) of MRA and HES with such coauthors, see Table 1 for a summary, one obtains a remarkable hyperbolic fit, Fig. 1- at least in the central region. This hyperbolic law seems to be more precise when the scientist has many publications and many coauthors. Compare the R2 values for MRA and HES in Fig. 1. Deviations are seen mainly in the extreme regions. Moreover, the power law exponent is not exactly +1. It depends on the examined data range, see Fig. 1b- as usual and as is well known (Clauzet et al. 2009) .
Table 1 Summary of data characteristics for publications for MRA and HES, up-dated till Dec. 12, 2012 : number of publications (NoP) and of joint publications (NoJP); oldest and latest publication (P); total number of coauthors (ToNCA); coauthor (CA) core measure (m a ) (Ausloos 2013)
MRA HES NoP 583 NoP 1160 NoJP >560 NoJP >870 Oldest P 1971 Oldest P 1965 Latest P 2012 Latest P 2012 ToNCA >310 ToNCA >480 m a 20 m a 25
However, the law is interesting for two main reasons. First, instead of focussing on (the number of) citations of papers, like for the Hirsch index (Hirsch 2005, 2010) h, Ausloos focussed on (the number of) coauthors. It has to be emphasized that this is quite different from several variants of the h-index which attempted to take into account some role of coauthors for obtaining some measure of some author scientific impact, in the literature. Next, the approach of Ausloos leads to some insight into team functioning. Thus, it allows to define the core of coauthors of a scientist, through (m a ≡ r = J) in contrast to the the core of papers of an author, i.e. h. Technically, one could thus measure the relevant strength of a research group centered on some leader. The invisible college (Kretschmer 1994, Zuccala 2006) would become visible and easily quantified, including hubs in so doing.
Two indirect, but not to be neglected, arguments for examining team co-authorship rather than citations stem also in the observed fact (Persson et al. 2004) that in general, co-authored publications are cited more frequently than single-authored papers. Moreover, increasingly, public and private research funding agencies require not only international and inter-institutional collaboration, but also claim to search for interdisciplinary and multidisciplinary scientists, and to promote such collaborations. To estimate the quality of such persons is far from obvious.
However, as mentioned, Ausloos law seems to be best for large teams, or for authors having many publications and many coauthors. It is easily understandable, as pointed out already in Ausloos (2013), that when an author has not many publications, or few coauthors, the law might be statistically poor. On the other hand, deviations in presence of a large set of publications and a large set of coauthors might be due to several reasons. So called "intrinsic causes" might arise from the large productivity of the group based on a high turnover of young researchers, with r ≫ 1, as well as a steady contribution from stable partners, with r ≃ 1. An "extrinsic reason" might arise from a large quantity of so called proceedings papers or invited lectures, on which the list of coauthors might be large in order to take into account various contributions on the reviewed subject and/or promote team size visibility.
Moreover, most prolific scientists have joint publications on different subjects. Thus, coauthors might be specific to some research subfield of a leader. It is thus if interest to examine, for such teams and leaders, whether the law is obeyed when the research publications pertain to different subfields. Automatically, this implies to search for very prolific scientists having worked on many different subfields.
Fig. 1 Number of joint publications (NoJP) for HES and for MRA, with coauthors ranked by decreasing importance: a in the vicinity of the so called Ausloos coauthor core measure (Ausloos 2013), shown by the diagonal; values for MRA and HES are indicated by arrows; b log-log scale display of a; best fits are given for the central plot region in a and b, and also for the overall range in b
Two cases are hereby examined. One is in fact the list of coauthors of Ausloos (MRA). He has published a little bit less than 600 papers in international journals or proceedings with reviewers. The other scientist, i.e. HES, here below studied from the co-authorship point of view, is a guru of statistical mechanics, for which the publication list amounts to more than 1100 "papers", and for which his group website distinguishes between subfields.
After some brief introduction of the so called state of the art, in "State of the art", the methodology is explained in "Methodology" The data analysis of the subfield co-authorship features is reported in "The data and its statistical analysis", for both MRA and HES. In "Analysis and Discussion of the data set", some discussion on the statistical mechanics aspects of these illustrative cases are presented in line with general considerations on "sub-cores" of coauthors, in "Numerical Analysis". In Appendix A, "small (in terms of the number of relevant publications) subfields" are considered, combining them into a larger subfield, such that the process can mimic the combination of subfields into the overall research field of a scientist, at different scales.
N.B. It will appear that data fitting is performed as is usually done in physics, namely a least squares fit of log-log data of the rank-frequency form. Yet, in Informetrics one prefers to fit the equivalent size-frequency form using a maximum likelihood fit. The Informetrics approach is certainly the better one1. The approach as used here seems however "good enough". Since each rank-frequency form has an equivalent size-frequency one (Egghe 2005; Adamic 2005; Adamic and Huberman 2002), one could indeed have redrawn all figures from the original to the revised version of this paper. For the sake of simplicity, saving time and energy two arbitrary chosen case have been used for comparing the methods, and subsequent result. This is done in Appendix B. It is (fortunately) found that the results are comparable, within reasonable error bars for the numerical values.
State of the art
Disregarding disturbing effects of multi-authorship on citation impact, as shown in bibliometric studies (Persson et al. 2004) and the effect of multiple co-authorship through the h-index, as yet modified in Hirsch (2005, 2010), let "authors" rather than "citations" be rather emphasized, in order to quantify research collaboration on scientific productivity (Melin and Persson 1996; Lee and Bozeman 2005).
Not much seems to have been written on the measure of teams from the coauthor number point of view (Egghe and Rousseau 1990). Cooperation structure, group size and productivity in research groups have been studied in a modern (quantitative) way as far as apparently as 1985 by Kretschmer (1994, 1985). Estimates of the returns on quality and co-authorship outputs have been studied for economic academia by Sauer (1988) or/and Holis (2001). In the medical field, the "White Bull effect", i.e. abusive co-authorship and publication parasitism, has been emphasized by Kwok (2005). Not much more to my knowledge.
More positively, let us mention, beside the above references, work on the critical mass and the dependency of research quality on group size by Kenna and Berche (2011). Note also White’s ”Toward Ego-centered Citation Analysis” which provides a method for identifying sets of relationships between an author and others in order to define the author’s multiple social networks (White 2000), though the problem of scientific networks (Newman 2001) is outside the present study. Note as well a multistep process for generating bibliometric mappings of research fields and their community structure in Velden and Lagoze (2012). Last, but not least, let the review by Sonnenwald (2007) on scientific collaboration terminology, concepts, classes, stages, positive and negative aspects, political and socio-economic constraints— though without quantification, be mentioned.
Methodology
In order to quantify Ausloos law and verify its validity limit, two cases have been selected for several reasons. First, the list of coauthors of Ausloos (MRA) and that of HES, are available
under different conditions: on one hand, through web sites, on the other hand through personal contacts. For example, MRA website http://www.ulg.ac.be/supras/groupe/Staff/ ausloos.html gives his first 360 publications, as distributed into 8 subfields. Other papers are also found on http://orbi.ulg.ac.be/. Moreover, MRA sent me his updated full publication list, according to subfields, as requested. Book chapters and papers subsequent to scientific presentation at various scientific meetings are included, but books and edited proceedings are not counted.
HES publication list amounts to more than 1.100 "papers", and for which his group website distinguishes between subfields. Its Curriculum Vitae & Selected Publications, taken on polymer.bu.edu/hes/vitahes − messina.pdf, lists, among other things, like edited books, 14 book chapters and 5 encyclopedia articles, 619 articles, in the period 1966–1999 plus more than 490 journal articles in the period 2000-up to the end of 2012. [Listed in rank order by citation count]. It is also claimed that HES has supervised 104 Ph.D. Theses. Interestingly for our purpose, his CV mentions 131 Research Associates and Visiting Scholars. HES seems to have the largest h-index among physicists (h > 112). However, in order to consider subfields, the HES "pre-broken list", taken from http://polymer.bu.edu/hes/topics.html, has been used. Its content will be discussed next, some warning being necessary.
In the present approach, in order to emphasize the co-authorship features within different sub-fields of a (main) author, it seems fair to me to accept a priori the sub-sub-fields selected by this "leader". It occurs, nevertheless, that the same papers are found in different subfields, in the case of HES. There are duplications. Let it be mentioned that the case does not occur frequently. I consider that it would be very unfair to manipulate the lists a posteriori in order to decide in which subfield a paper has to be put. It seems to me that there is no "good criterion" allowing to eliminate a specific paper from one (or several) list(s). However, it has been noticed that, in several cases, coauthors necessarily have, in so doing, 2 or 3 or 4 "joint publications", instead of 1 or 2—thus overestimating this coauthor importance—if the sum of parts is carelessly made. On the other hand, in the present kind of study, this "error" in estimating the number of joint publications (NoJP) seems weakly relevant in estimating the importance of a very frequent coauthor. His/her rank will not likely be much changed— though the NoJP is, admittedly, overestimated. More positively, the fact that a paper appears several times is an indication of the leader multidisciplinary activity, and of his coauthors as well. Most annoying appears to be the lack of identity between the 2012 CV list (not broken) into subfields, and the website subfield list, which seems sometimes incomplete. Also several papers seem strangely appearing in some list; the most amazing is a 2002 paper on metal-insulator transition (MIT) found in the ’"Physiology and Medicine" subfield, while another on MIT does not appear anywhere.
In a somewhat amazing way, it was observed that a paper on where both HES and MRA are coauthors (Ivanova et al. 2003) does not appear in any subfield list.
Great care has been taken with the misprints of coauthor names: e.g., Gilgor, Zaleski, Kutzarova, Buldryev, Kumer, and Giovanbattista, are surely Gligor, Zalesky, Koutzarova, Buldyrev, Kumar, and Giovambattista, respectively. Great care has also been taken concerning polish, spanish, chinese and korean names. First (given) names and middle names, the latter sometimes missing, have been checked: e..g., T. M. Petersen and A. M. Petersen are the same person. This manual check has allowed to distinguish name homonyms, like Ch. Laurent and Ph. Laurent. HES also mentions a famous paper attributed to some HFS!—in the surface physics subfields. All such and similar misprints have been a posteriori corrected before manually counting the authors.
In conclusion, although, the final data might still be containing some "error", most of it has been manually verified and is taken as sufficiently reliable for the present investigation. This analyzed data is available from the author if necessary.
The data and its statistical analysis
The 8 subfields of publications by MRA, according to the web site http: http://www.ulg.ac.be/ supras/groupe/Staff/ausloos.html , can be defined as
1. Condensed matter: Disordered or Non-magnetic Materials (1)
2. Condensed matter: Magnetic Materials
3. Statistical physics: Liquid and Amorphous States. Meteorology.
4. Condensed matter: Granular Materials
5. Condensed matter: Fractures and Surfaces
6. Statistical physics: Kinetic Growth and Spin Models
7. Condensed matter: Superconductivity
8. Statistical physics: Econophysics, Sociophysics
Due to the rather small number of joint publications and coauthors, in subfields 4 and 5, they are below combined into a "5&4" topic, for statistical purposes. The fields can be considered to be a "Surface Physics" one. The overlap amounts to two authors, one being the main CA in both 4&5 fields—who keeps his r = 1 rank after the merging, of course. A discussion of such a case is found in the Appendix.
The 12 subfields of publications by HES, according to the web site http://polymer.bu.edu/hes/ topics.html, are
1. Aggregation, Snowflakes, and Viscous Fingering
2. Statistical Physics and Neuroscience (Alzheimer’s Disease)
3. Barkhausen Effect and Microfracture
4. DNA
5. Econophysics & Social Science
6. Granular Materials
7. Physical and Social Networks
8. Percolation, Geometric Phase Transitions
9. Phase Transitions and Critical Phenomena
10.Physiology and Medicine
12.Water
Due to the rather small number of joint publications and coauthors, in subfield 3, it has been combined with subfield 6, into a "6&3" topic, for statistical purposes. The fields can be considered to be a "Surface Physics" one again. The overlap amounts to two authors, whose rank is modified through the merging.
The data is summarized in Tables 2 and 3 for MRA and HES, respectively. Recall that the joint publications (JP) are put in different subfields, see tables. The number of different coauthors (NoDCA) is given with the NoJP with the most frequent (mf) coauthor (r = 1) depending on the subfield, i.e., NoJPmfCA. The number of CA having only one paper with the leader and the total number of coauthors are given as NoJP1CA and TNoCA respectively. Of course, NoJP with only 1CA is equivalent to the number of JP for such authors, with the main researcher. The total number of coauthors in a list, TNoCA, is also reported.
The characteristics of the relevant distributions are also given in Tables 2 and 3. Statistical notations to read the statistical Tables are standard ones, i.e. Mean (m), Median, RMS, Std. Dev. (σ), Variance (Var.), Std. Err., Skewness (Skewn.), Kurtosis (Kurt.); m/σ is also given.
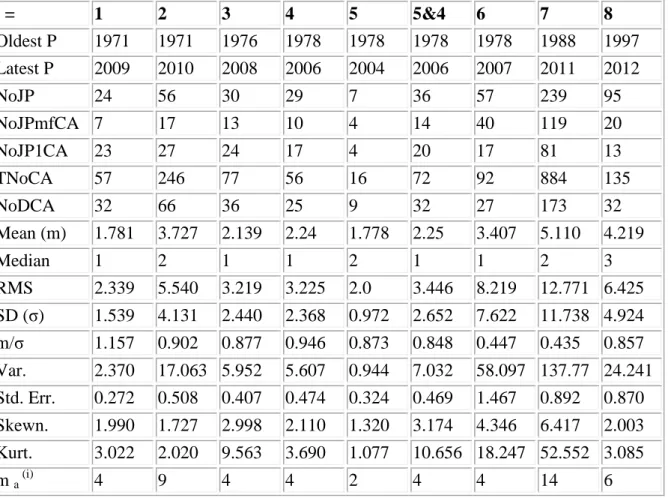
Table 2 Summary of data characteristics for joint publications of MRA according to i=1,…,8 sub-fields (see text, "The data and its statistical analysis"); sub-fields 4 and 5 are here combined into "5&4" for statistical purposes; see text for statistical notations
i = 1 2 3 4 5 5&4 6 7 8 Oldest P 1971 1971 1976 1978 1978 1978 1978 1988 1997 Latest P 2009 2010 2008 2006 2004 2006 2007 2011 2012 NoJP 24 56 30 29 7 36 57 239 95 NoJPmfCA 7 17 13 10 4 14 40 119 20 NoJP1CA 23 27 24 17 4 20 17 81 13 TNoCA 57 246 77 56 16 72 92 884 135 NoDCA 32 66 36 25 9 32 27 173 32 Mean (m) 1.781 3.727 2.139 2.24 1.778 2.25 3.407 5.110 4.219 Median 1 2 1 1 2 1 1 2 3 RMS 2.339 5.540 3.219 3.225 2.0 3.446 8.219 12.771 6.425 SD (σ) 1.539 4.131 2.440 2.368 0.972 2.652 7.622 11.738 4.924 m/σ 1.157 0.902 0.877 0.946 0.873 0.848 0.447 0.435 0.857 Var. 2.370 17.063 5.952 5.607 0.944 7.032 58.097 137.77 24.241 Std. Err. 0.272 0.508 0.407 0.474 0.324 0.469 1.467 0.892 0.870 Skewn. 1.990 1.727 2.998 2.110 1.320 3.174 4.346 6.417 2.003 Kurt. 3.022 2.020 9.563 3.690 1.077 10.656 18.247 52.552 3.085 m a (i) 4 9 4 4 2 4 4 14 6
Table 3 Summary of data characteristics for joint publications of HES according to i=1,…12 subfields (see text, "The data and its statistical analysis"); subfields 3 and 6 are not shown here, but are combined into "6&3" for statistical purposes and reported in Table 4 in Appendix; see text for statistical notations
i = 1 2 4 5 7 8 9 10 11 12 Oldest P 1983 1995 1992 1994 2000 1976 1966 1972 1985 1979 Latest P 2004 2009 2008 2012 2007 2009 1999 2009 1999 2012 No JP 50 40 45 187 77 79 68 116 23 181 NoJPmfCA 18 27 39 59 61 39 10 52 13 66 NoJP1CA 30 18 28 60 32 36 29 63 15 49 TNoCA 156 210 244 649 301 246 144 558 81 667 NoDCA 61 43 45 114 68 68 63 135 31 104 Mean (m) 2.557 4.884 5.422 5.693 4.426 3.618 2.286 4.13 2.613 6.413 Median 2 3 1 1 2 1 2 2 2 2 RMS 3.867 8.029 11.478 11.903 9.717 6.954 2.884 8.700 3.746 12.441 SD (σ) 2.924 6.448 0 10.230 10.500 8.715 5.983 1.773 7.684 2.729 10.712 m/σ 0.874 0.757 0.53 0.542 0.508 0.605 1.289 0.537 0.964 0.599 Var. 8.551 41.581 104.66 110.25 75.950 35.792 3.143 59.042 7.445 114.75 Std Err. 0.374 0.983 1.525 0.983 1.057 0.726 0.223 0.661 0.490 1.050 Skewn. 3.290 2.254 2.431 3.482 4.857 3.842 1.977 4.208 2.517 3.237 Kurt. 12.611 4.404 1 4.398 13.219 26.401 17.404 4.728 18.924 6.239 11.991 m a (i) 6 8 6 13 7 8 5 10 4 13
Analysis and discussion of the data set
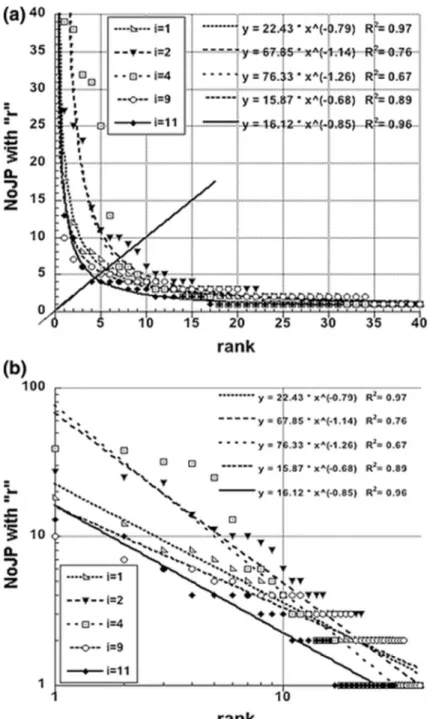
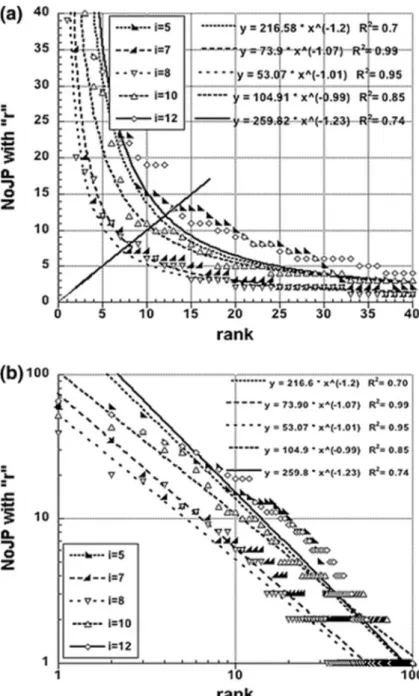
The data is displayed and numerically fitted on Figs. 2, 3 and 4, in these two cases, grouped according to the size of NoJP, NoJPmfCA, and the number of ranks for better visibility; thus in Fig. 3, one finds the i = 1, 2, 4; 9, 11 subfields, and in Fig. 4, the i = 5, 7, 8, 10, 12 subfields.
The case of subfields i = 4 and 5, for MRA, and of subfields i = 3 and 6, for HES, are treated in the Appendix.
Numerical analysis
First, observe whether the hyperbolic law is obeyed or not. In the MRA case, Fig. 2, the R2 = 0.655 value should be considered as pretty low; it occurs for the i = 2 case. The R2 value is not large, but falls within usual acceptable range in this kind of studies, with non-laboratory
taken data, for i = 8. However the R2 value is quite high for the other cases, i.e. i = 1, 3, 6, 7. In these cases, the exponent is even quite close to +1 for the i = 6 and 7 subfields. Note that the exponent is close to +1 as well for i = 8—the most recent subfield for investigations, see Table 2. It should be noted that the i = 2 and 7 cases are those having the largest NoJP and NCA.
In the HES case, Figs. 3 and 4, the R 2 value should be considered as pretty low for the i = 2 and 4 cases, and barely acceptable for the i = 5 and 12 cases. The exponent α is close to +1 (±0.25), in almost all cases, except for i = 9 where it is ≃ 0.68.
In either case, it can be observed that the ma(i) values are rather small and all fall much below the overall m a coauthor core value.
Influence of subfields content over coauthor ranking
The anomalous behavior of the i = 2 case in MRA can likely be traced back to the (time) distribution of the publications. Indeed, there are two regimes in such a list. The first one pertains to the study of magnetic phase transitions and critical exponents through measurements and subsequent analysis of transport properties. This leads to a large list of (portuguese) coauthors (6 in fact, led by J.B. Sousa, with equivalent NoJP): crystal growth chemists, experimental physicists, and theoretical physicists. One obtains a so called "queen effect" (Ausloos 2013) indicated by a sort of horizontal line in the data, see Fig. 2b. A hyperbolic Bradford-Zipf-Mandelbrot-like law,
J=J
*/(ν+r)
ζ,
(1)with
ζ
≃1
, might have to be considered for such cases (Fairthorne 1969). The second regime pertains to more recent work on colossal magneto resistance. The first three coauthors being on the contrary responsible for the so called "king effect" (Laherrère and Sornette 1998), i.e. a sharp upturn at low r values (here, r = 1, 2, 3). In fact, the tail of the NoJP versus r (for r > 10) gives a remarkable hyperbola with R 2 = 0.98, and α = 1.25. A huge king effect is seen for the i = 6 and 7 cases, with two different mfCA, i.e., Vandewalle and Cloots, respectively.In the case of HES, one also encounters a king and a queen effect, in several cases. The king effect is due to Gopikrishnan, Plerou and Amaral in the i = 5 case, to Havlin in cases 1, 7, and 8, and to Ivanov in case 10. According to the subfield definitions, the cases are much concerned with medical topics. It is understandable that a team effect, with kings and queens, see i = 4, 2, and 10, are to be expected in such domains.
Also observe that the case with the "worse" exponent, i.e. rather away from +1, corresponds to the oldest subfield of investigations by HES, see Table 3.
Finally, the ma(i) values falling much below the overall m a coauthor core value can be interpreted as being due to the fact that most of the subfield core CA occur in several subfields, boosting their role in the measurement of the main author core of coauthors. These also have much sub-field disciplinarity to show on their CV.
Fig. 2 Number of joint publications (NoJP) for MRA, with coauthors ranked by decreasing importance for 6 different subfields (i; see text for i=1,…, 8 : (a) in the vicinity of the so called Ausloos coauthor core measure (Ausloos 2013); (b) log–log scale display of (a); the best fits are given for the overall range
Fig. 3 Number of joint publications (NoJP) for HES, with coauthors ranked by decreasing importance for the 5 "less prolific" subfields (i; see text for i = 1, 2, 4, 9, 11: (a) in the vicinity of the so called Ausloos coauthor core measure (Ausloos 2013); (b) log-log scale display of (a); best fits are given for the overall range
Fig. 4 Number of joint publications (NoJP) for HES, with coauthors ranked by decreasing importance for the 5 "most prolific" subfields (i; see text for i = 5, 7, 8, 10, 12: (a) in the vicinity of the so called Ausloos coauthor core measure (Ausloos 2013); (b) log-log scale display of (a); the best fits are given for the overall range
Conclusions
An old question is : "What is measured through co-authorships?" (Laudel 2001) Indeed, if it is possible to establish ranks between scientific products and other empirical facts, like citations and (joint) publications, as Beck (1984) discussed, it seems that only scientific achievements equal in "epistemological rank" might be admitted for statistical counts (Fernández-Cano et al. 2004), in order to measure some value of a scientist or a team. A test can be made if one breaks a ranking list into sublists and observe regularities and irregularities. The more so if the ranking is modified when breaking the list according to "inner criteria" or "intrinsic parameters".
Of course, one could warn that the statistical methods based on mere arithmetic counts at the aggregate-level are inadequate for at least two reasons: a quantitative bias omits relevant qualitative features and, due to its simplicity, the counting is insensitive to interactions and contextual variations (Fernández-Cano et al. 2004). Moreover, duplicate papers, sometimes with only cosmetic changes, are counted several times, and the number of coauthors seem to grow also. However, since it is natural to prefer a quantitative approach, even if inexact, to any purely qualitative analysis, it is necessary to seek any data that can be obtained by a process of ”head-counting” (de Solla Price 1956).
Ausloos coauthor core definition and measure tackles such considerations in a constructive way, through the relationship between the number (J) of (joint) publications with coauthors ranked according to rank (r) importance. A test of his findings (Ausloos 2013), i.e., J ∝ 1/r α, with α ≃ 1, has been made and is here above presented based on two prolific authors, i.e., having a long list of publications, and known to have many coworkers in different subfields. Each publication list has been broken into subfields. For one, MRA, the requested sublists have no overlap; for the second, HES, the website lists have overlaps, but miss a few papers— likely outside the main subfields of interest of the scientist.
The effects of data size of data and concatenation have been studied in an Appendix— considering that merging of microcosmic subfields into a larger one is indicative of what can be suggested, for example, when considering only a large field made of several arbitrary distinguished subfields.
Several final observations are to be outlined. First of all, as already pointed out by Ausloos in (2013), the simple hyperbolic law holds best for large data sets, with homogeneous distributions of NoJP and TNoCA. The effect of NoDCA entices a long tail, but a relevant observation in the present work is the king and queen effects which force much deviation from Ausloos law at low r. A Bradford–Zipf–Mandelbrot-like law, Eq. (1), might have to be tested, - with the delicate need of thereafter interpreting the two additional parameters. This is suggested for further work.
One may also conjecture that irregularities maybe due to different causes: publication inflation, proceedings counting, co-authorship inflation, for whatever reason (Kretschmer and Rousseau 2001). Moreover, it seems that Ausloos law should be better followed for more recent investigated subfields, i.e. when NoJP is becoming large.
Interestingly, for maybe practical considerations, a difference in research team behavior can be observed through the NoJP exponent and coauthor core value. This goes in line with the usual knowledge that scientists who collaborate bring additional, individual goals to a collaboration as studied by Sonnenwald (2003). As she points out: a typical example is a junior scientist who wishes to be promoted and receive tenure, in addition to contributing to a collaboration. Thus individual goals influence a scientist’s ongoing commitment to a collaboration and his/her perspective on many aspects of the work (Sonnenwald 2007). In so doing it brings much (unduly or not) influence on the co-authorship list (Kwok 2005).
Nevertheless, the smallness of the core and sub-core values may imply further considerations for the evaluation of team research purposes and activities, beside co-authorship need and necessity, within multidisciplinary aspects.
The ma(i) values of the so called coauthor sub-core fall much below the overall ma coauthor core value. Practically, it indicates the need for globalization of measures in considering the role of the main author, and in ranking his team mates.
The above analysis also indicates the sensitivity of the subfield notion, on one hand, and of the coauthor distribution, on the other hand, on the core measure. More work will be useful along such lines, for better quantification. However, this observation can be considered to be already useful in order to imagine that one can be introducing selection and rewarding
policies in the career of members of teams, along Ausloos coauthor core measure (Ausloos 2013), ma .
Acknowledgement
Thanks to M. Ausloos for private communications on (Ausloos 2013), comments prior to manuscript submission and making available his publication list broken into sub-fields. Suggestions by R. Cerquetti, J.M. Kowalski, J. Miśkiewicz, and an anonymous reviewer - see Appendix B for this, have been welcomed.
Appendix A: on merging sub-fields
In order to investigate the effect of reduced size of data in subfields, it has been mentioned that two related subfield have been merged a posteriori both in the MRA and HES cases. The relevant data is given in Table 4; the corresponding display is shown in Fig. 5. It is apparent that in both cases the R2 value is rather large. It increases with the data size in the MRA case, but decreases in the HES case. In fact, the statistical data shown in Table 4 indicates marked differences in the variance and kurtosis of the coauthor number of joint publications distribution. In the MRA case, the NoJP1CA, TNoCA and NoDCA are quite large. In the HES case, the merging stretches upward the NoJP values at low rank. This indicates a different type of research team behavior, for such "minority subfields", by the main researchers. I conjecture that in the former case, a more pedagogical approach is taken, frequently involving many younger researchers; in contrast with the latter team, more prone to emphasize work by confirmed researchers. It is observed that the sub-cores are much smaller than the overall core. In so doing, the m a (i) core value is steady in the case of MRA but increases for HES, after merging. These features indicate the sensitivity of the subfield definition, on one hand, and of the coauthor distribution, on the other hand, on the core measure.
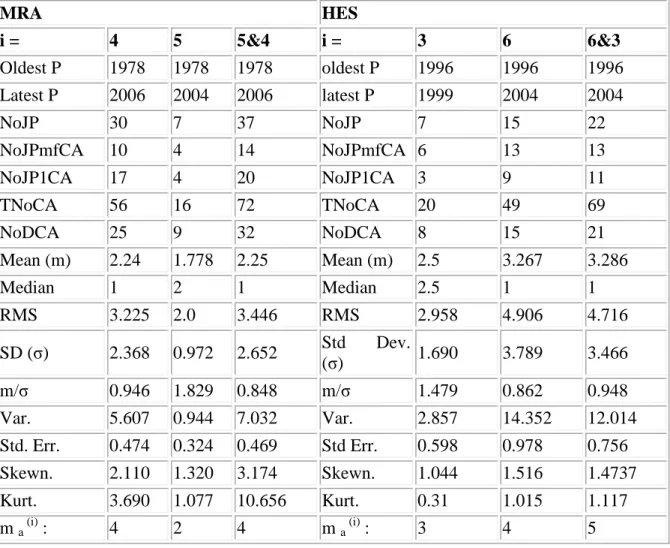
Table 4 Summary of data characteristics for joint publications according to merged subfields; e.g., for MRA and HES respectively, subfields 4 and 5 are combined into "5&4", and subfields 3 and 6 are combined into "6&3" ; see "The data and its statistical analysis" for
i=…
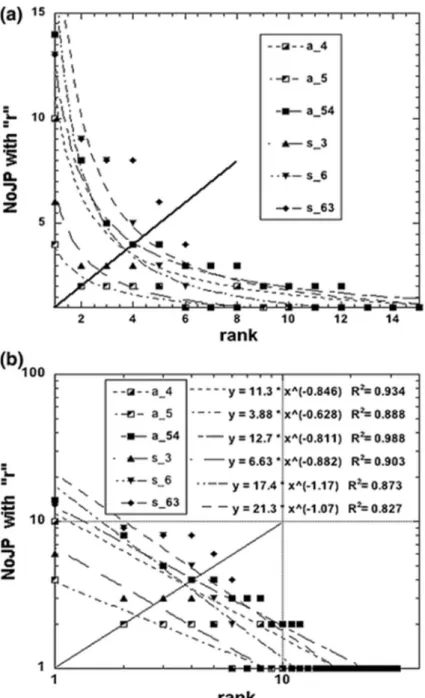
notations MRA HES i = 4 5 5&4 i = 3 6 6&3 Oldest P 1978 1978 1978 oldest P 1996 1996 1996 Latest P 2006 2004 2006 latest P 1999 2004 2004 NoJP 30 7 37 NoJP 7 15 22 NoJPmfCA 10 4 14 NoJPmfCA 6 13 13 NoJP1CA 17 4 20 NoJP1CA 3 9 11 TNoCA 56 16 72 TNoCA 20 49 69 NoDCA 25 9 32 NoDCA 8 15 21 Mean (m) 2.24 1.778 2.25 Mean (m) 2.5 3.267 3.286 Median 1 2 1 Median 2.5 1 1 RMS 3.225 2.0 3.446 RMS 2.958 4.906 4.716 SD (σ) 2.368 0.972 2.652 Std Dev. (σ) 1.690 3.789 3.466 m/σ 0.946 1.829 0.848 m/σ 1.479 0.862 0.948 Var. 5.607 0.944 7.032 Var. 2.857 14.352 12.014 Std. Err. 0.474 0.324 0.469 Std Err. 0.598 0.978 0.756 Skewn. 2.110 1.320 3.174 Skewn. 1.044 1.516 1.4737 Kurt. 3.690 1.077 10.656 Kurt. 0.31 1.015 1.117 m a (i) : 4 2 4 m a (i) : 3 4 5Fig. 5 Number of joint publications (NoJP) with coauthors ranked by decreasing importance, in the case of subfields 4 and 5 (for MRA) and 3 and 6 (for HES), and their merging into a subfield "Surface physics", i.e. 5&4 and 6&3 respectively; a −4 corresponds to i = 4 for MRA, s −3 to i = 3 for HES, etc.; the so called Ausloos coauthor core limit (Ausloos 2013) is shown by the diagonal line; the best power law fits are given
Appendix B: on rank-frequency or size-frequency fits
An anonymous reviewer kindly pointed out that in Informetrics one prefers to fit data to some size-frequency functional form using a maximum likelihood fit, rather than making a least squares fit to log-log data for the rank-frequency distribution, as more usual in physics research. Indeed, according to Zipf’s law (Adamic 2005; Adamic and Huberman 2002; Hill 1974; West and Deering 1994, 1995), in other words, the rank-frequency relationship, the (number or) frequency y of the occurrence of an "event" relative to its rank r follows an inverse power law, y ∼ r −α. However, one can also ask (Pareto 1896) how many times one can find an "event" greater than some size y, i.e. the size-frequency relationship. Pareto’s
found out that the the cumulative distribution function (CDF) of such events follows an inverse power of y, or in other words,
P[Y>y]∼y
−κ. Thus, the (number or) frequency f ofsuch events of size y, (also) follows an inverse power of y, i.e. f ∼ y −λ. Some algebra (Adamic 2005) indicates that (1/α) = κ.
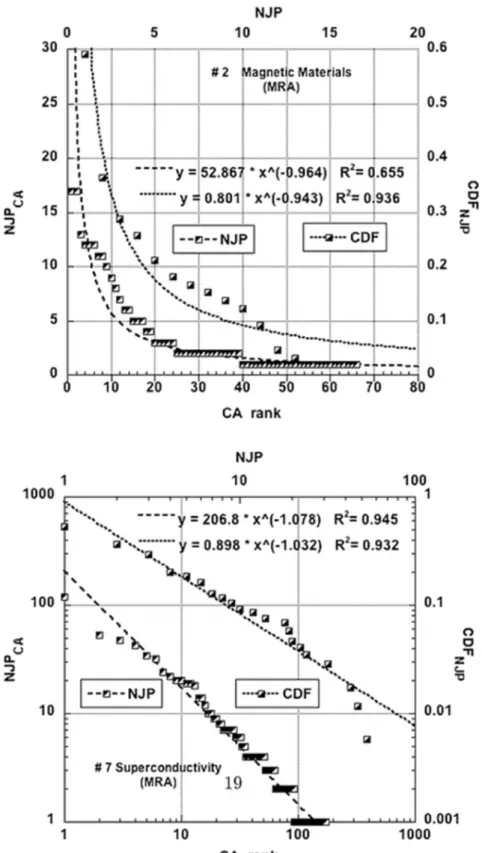
Both sides of the alternative make sense. Thus, one could redraw all figures from the main text and turn them into size-frequency plots. For the sake of simplicity, saving time and energy, two cases have been quite arbitrarily chosen for comparing the methods and subsequent results. This is presented in Fig. 6. The data on two subfields of MRA: (a) Magnetic Materials (field #2) and (b) Superconductivity (field #7) are analyzed in two ways. First, as in the main text, the Number of Joint Publications (NJP) is shown as a function of the rank r of coauthors (CA), in order to find the Zipf exponent. Next, the cumulative distribution function (CDF) of the number of coauthors (NCA) is presented. A classical plot is shown as well as a log–log scale display in order to illustrate the methods. The best fits are given according to the least-square fit method. The resulting numerical values and the corresponding R2 values are given. In the Magnetic Materials case, the R2 value is rather low (≃0.655), but this can be attributed to the very small number of data points, as discussed in the main text. For such a case, the CDF versus NCA plot is much better (R2 ≃ 0.936); it leads to κ2 ≃ 0.943, in obvious notations. A direct fit gives of f(y) gives λ2 ≃ 1.085 (R2 ≃ 0.947). The exponent α 2 ≃ 0.964 seems thus reliable, accepting the error bars. Concerning the log– log plot display (Fig. 6) for the case of the papers on Superconductivity, R2 values are fine (∼0.945 and 0.932) for α7≃ 1.078 and κ7 ≃ 1.033, respectively, while λ7 ≃ 0.96 (R2 ≃ 0.932). If one wishes to use the maximum likelihood method (Clauzet et al. 2009; Egghe 2005; Mitchener 2010), but assuming for comparison with the above that the optimal function is a mere power law, one finds using the Table 1 of (Rousseau 1993) (reproduced in (Egghe 2005)) in order to estimate the exponent of interest from the ratio −ζ′/ζ : α2≃1.357(0.051),
λ2≃1.76(0.912), and κ2≃ 1.745(0.132); on the other hand, α7 ≃ 1.338(0.823), λ7 ≃ 1.775(0.98), and κ7 ≃ 1.665(0.474), where in the (…) is given the corresponding R2.
As expected, the results are thus different, but often comparable, within reasonable error bars. Of course, other theoretical laws can be examined. The exponential and the logarithmic forms have been tested for these cases. They lead to so bad results (sometimes R2 < 0.2) that they are not shown; no other functional form has been investigated. The case of a generalized Pareto distribution (Fairthorne 1969; Mandelbrot 1960), as mentioned in the main text, is left for further work. In any case, however, the possible power law relations seem to indicate that co-authors do form clusters which are locally scale-free, within the overall scientific network (Newman 2001).
Fig. 6 Comparison of the Number of Joint Publications (NJP) as a function of the rank r of coauthors (CA), and that of the cumulative distribution function (CDF) of the number of coauthors (NCA) as a function of NJP, for the case of two subfields of MRA: (top) Magnetic Materials; (bottom) Superconductivity. A classical plot as well as a log-log scale display are presented with the best fits given according to the least-square fit method. The resulting numerical values and the corresponding R 2 values are given
References
Adamic, L. A., & Huberman, B. A. (2002). Zipf’s law and the Internet. Glottometrics, 3,143–150. Adamic, L.A. (2005). Zipf, Power-laws, and Pareto - a ranking tutorial, http://www.hpl.hp.com/shl/ papers/ranking/ranking.html.
Ausloos, M. (2013). A scientometrics law about co-authors and their ranking. The co-author core. Scientometrics, 95, 895–909.
Beck, I. M. (1984). A method of measurement of scientific production. Science of Science, 4, 183– 195.
Clauzet, A., Shalizi, A. C. C., & Newman, M. E. J. (2009). Power-law distributions in empirical data. SIAM Rev, 51, 661–703.
Egghe, L. (2005). Power laws in the information production process: Lotkaian informetrics. Oxford: Elsevier Academic Press.
Egghe, L., & Rousseau, R. (1990). Introduction to Informetrics. Quantitative Methods in Library, Documentation and Information Science. Amsterdam: Elsevier.
Fairthorne, R. A. (1969). Empirical hyperbolic distributions (Bradford-Zipf-Mandelbrot) for bibliometric description and prediction. Journal of Documentation, 25, 319–343.
Fernández-Cano, A., Torralbo, M., & Vallejo, M. (2004). Reconsidering Price’s model of scientific growth: An overview. Scientometrics, 61, 301–321.
Hill, B. (1974). The Rank-Frequency Form of Zipf’s Law. Journal of American Statistical Association, 69, 1017–1026.
Hirsch, J. E. (2005). An index to quantify an individual’s scientific research output. Proceedings of the National Academy of Sciences USA, 102, 16569–16572.
Hirsch, J. E. (2010). An index to quantify an individual’s scientific research output that takes into account the effect of multiple coauthorship. Scientometrics, 85, 741–754.
Hollis, A. (2001). Co-authorship and the output of academic economists. Labour Economics, 8, 505– 530.
Ivanova, K., Ackerman, T. P., Clothiaux, E. E., Ivanov, P. Ch., Stanley, H. E., & Ausloos, M. (2003). Time correlations and 1/f behavior in backscattering radar reflectivity measurements from cirrus cloud ice fluctuations. Journal of Geophysical Research - Atmospheres, 108, 4268–4281.
Laherrère, J., & Sornette, D. (1998). Stretched exponential distributions in nature and economy: fat tails with characteristic scales. European Physics Journal B, 2, 525–539.
Kenna, R., & Berche, B. (2011). Critical mass and the dependency of research quality on group size. Scientometrics, 86, 527–540.
Kretschmer, H. (1985). Cooperation structure, group size and productivity in research groups. Scientometrics, 7, 39–53.
Kretschmer, H. (1994). Coauthorship networks of invisible colleges and institutional communities. Scientometrics, 30, 363–369.
Kretschmer, H., & Rousseau, R. (2001). Author inflation leads to a breakdown of Lotka’s Law. Journal of the American Society for Information Science and Technology, 52, 610–614.
Kwok, L. S. (2005). The White Bull effect: abusive coauthorship and publication parasitism. Journal of Medical Ethics, 31, 554–556.
Laudel, G. (2001). What do we measure by co-authorships? In Davis, M., Wilson, C. S. (Eds.), Proceedings of the 8th international conference on scientometrics and informetrics (pp. 369–384). Sydney, NSW: Bibliometrics & Informetrics Research Group.
Lee, S., & Bozeman, B. (2005). The impact of research collaboration on scientific productivity. Social Studies of Science, 35, 673–702.
Mandelbrot, B. (1960). The Pareto-Levy Law and the distribution of income. International Review of Economics, 1, 79–106.
Melin, G., & Persson, O. (1996). Studying research collaboration using co-authorships. Scientometrics, 36, 363–377.
Mitchener, W. G. (2010). Inferring leadership structure from data on a syntax change in english, in scientific applications of language methods, Carlos Martín-Vide (Ed.) pp. 633-662, Imperial College Press, (ch. 13) ; Curve fitting How-to, http://mitchenerg.people.cofc.edu/MathematicaHowTo/ CurveFittingHowTo.pdf.
Newman, M. E. J. (2001). The structure of scientific collaboration networks. Proceedings of the National Academy of Sciences USA, 98, 404–409.
Pareto, V. (1896). Cours d’Economie politique. Geneva: Droz.
Persson, O., Glänzel, W., & Danell, R. (2004). Inflationary bibliometric values: The role of scientific collaboration and the need for relative indicators in evaluative studies. Scientometrics, 60, 421–432. de Solla Price, D. J. (1956). The exponential curve of science. Discovery, 17, 240–243.
Rousseau, R. (1993). A table for estimating the exponent in Lotka’s law. Journal of Documentation, 49(4), 409–412.
Sauer, R. D. (1988). Estimates of the returns to quality and coauthorship in economic academia. The Journal of Political Economy, 96, 855–866.
Sonnenwald, D. H. (2007). Scientific collaboration. Annual Review of Information Science and Technology, 41, 643–681.
Sonnenwald, D. H. (2003). Expectations for a scientific collaboratory: A case study: Proceedings of the ACM GROUP 2003 Conference (pp. 68–74). New York: ACM.
Velden, Th., & Lagoze, C. (2012). Mapping scientific communities to scale-up ethnographies: In Proceedings of the 2012 iConference (pp. 563–564). NY: ACM.
West, B. J., & Deering, W. (1994). Physics Reports, 246, 1–100.
West, B. J., & Deering, B. (1995). The lure of modern science: Fractal thinking. Singapore: World Scient.
White, H. D. (2000). Toward ego-centered citation analysis. In: The Web of knowledge. A Festschrift in Honor of Eugene Garfield, edited by Blaise Cronin and Helen Barsky Atkins. (ASIS Monograph Series). Medford, NJ: Information Today, pp. 475–496.
Zuccala, A. (2006). Modeling the invisible college. Journal of the American Society for Information Science and Technology, 57, 152–168.