Effets des conditions environnementales, de la
condition corporelle et du statut hormonal
sur la mue de la grande oie des neiges
(Chen caerulescens atlantica)
Mémoire
Vincent Marmillot
Maîtrise en biologie
Maître ès sciences (M.Sc.)
Québec, Canada
© Vincent Marmillot, 2015
RÉSUMÉ
Les oiseaux en mue font face à des contraintes temporelles et environnementales, surtout chez certains Anatidae parce qu’ils muent toutes leurs plumes de vol simultanément durant le court été arctique. Nous avons examiné comment ces contraintes influencent la phénologie de la mue de la grande oie des neiges ainsi que le rôle des hormones et des facteurs environnementaux dans le contrôle de la mue et de la qualité des plumes. Nous avons utilisé une base de données de plus de 20 ans afin d’examiner l’effet des conditions environnementales et de la reproduction sur la phénologie de la mue, et des hormones thyroïdiennes (T3) et de stress et de la condition physique des individus durant deux ans afin de voir leurs effets sur le déroulement de la mue et la qualité des plumes. Nos résultats mettent en évidence une plasticité phénotypique basée sur un ajustement de la vitesse de croissance des plumes plutôt que sur un avancement de la date de début de la mue lors d’années tardives. Une baisse de la vitesse de croissance des plumes vers la fin de la mue pourrait s’expliquer par une chute de T3 à ce moment. Nous montrons par ailleurs que l’intensité de la mue et la condition corporelle sont réduits par des niveaux élevées d’hormones de stress. Toutefois, la rigidité flexionnelle des plumes, un indice de leur qualité, n’était pas affectée par la condition physique ou le niveau d’hormone de stress des individus. La plasticité phénotypique de la mue permettrait d’achever le renouvellement des plumes de vol avant la fin du court été arctique, indépendamment de la phénologie de la reproduction et des conditions environnementales printanières, tout en maintenant un niveau élevé de qualité des plumes.
ABSTRACT
Molting birds are facing temporal and environmental constraints, especially in some Anatidae because they renew all their flight feathers simultaneously during the short Arctic summer. We examined how these constraints could influence the molt phenology of greater snow geese and we explored the role of hormones and environmental factors in controlling molt and feather quality. We used a 20+ year database to examine the effects of environmental conditions and reproduction on molt phenology and we measured thyroid (T3) and stress hormones and body condition of individuals for two years to examine their effects on molt and feather quality. Our results show phenotypic plasticity based on an adjustment of feather growth speed rather than on advancement of the molt initiation date during late years. A decline in feather growth rate at the end of molt could be explained by a drop in T3 at this time. We also show that high levels of stress hormones could reduce molt intensity and body condition. However, the bending stiffness of feathers, an index of their quality, was not affected by body condition or stress hormone level. The phenotypic plasticity of molt allows a complete renewal of flight feathers before the end of the short arctic summer, regardless of reproductive phenology and spring environmental conditions, while maintaining a high level of quality for feathers.
TABLE DES MATIÈRES
RÉSUMÉ ... iii
ABSTRACT ... v
TABLE DES MATIÈRES ...vii
LISTE DES TABLEAUX ... ix
LISTE DES FIGURES ... xi
LISTE DES APPENDICES ... xiii
REMERCIEMENTS ... xv
AVANT-PROPOS ...xvii
INTRODUCTION GENERALE ... 1
Les contraintes du milieu arctique sur les oiseaux migrateurs ... 1
Phénologie et phénomènes de synchronie/asynchronie ... 3
Physiologie et coût énergétique de la mue ... 4
Facteurs environnementaux et endogènes pouvant influencer la phénologie de la mue ... 6
Stress durant la mue et qualité des plumes ... 7
Objectifs de l’étude ... 9
CHAPITRE 1 ... 11
PLASTICITY IN MOLT SPEED AND TIMING IN AN ARCTIC-NESTING GOOSE SPECIES ... 11
RESUMÉ ... 12
ABSTRACT ... 13
INTRODUCTION ... 14
MATERIALS AND METHODS ... 16
Study area ... 16
Goose reproductive data ... 17
Capture and measure of molting geese ... 18
Environmental covariates ... 19
Analysis ... 20
Molt phenology ... 24
Factors affecting molt ... 26
DISCUSSION ... 28
CHAPITRE 2 ... 33
PHYSIOLOGICAL DETERMINANTS OF MOLT AND FEATHER QUALITY IN ARCTIC GEESE: THE ROLE OF THYROID AND STRESS HORMONES ... 33
RESUMÉ ... 34
ABSTRACT ... 35
INTRODUCTION ... 36
MATERIALS AND METHODS... 38
Study area and species ... 38
Field methods ... 39
Corticosterone (CORT) measurements ... 39
Triiodothyronine (T3) measurements ... 40 Stiffness measurements ... 40 Data analysis ... 41 RESULTS ... 43 DISCUSSION ... 49 CONCLUSION GÉNÉRALE ... 53 BIBLIOGRAPHIE ... 59 ANNEXES ... 72
LISTE DES TABLEAUX
Table 1.1: Model selection for the effect body condition index (SMIr, corrected for capture
date and year effects; see methods), temperature (TEMP) and 2 way interaction on 9th
primary length………...27
Table 2.1 : Model selection for the effect of capture date (Date), year and their interaction
on 9th primary lentgh of adult female greater snow geese (linear model; n = 375)………..43
Table 2.2 : Model selection for the effect 9th primary lentgh (Prim9), year and their
LISTE DES FIGURES
Figure 1 : Phénologie des principales activités estivales d’un oiseau migrateur arctique….2 Figure 1.1: Map showing the study areas on the south plain of Bylot Island and localisation
on Nunavut, Canada………..17
Figure 1.2: Relationship between ninth primary length of adult female greater snow geese
and capture date on Bylot Island, Nunavut, in 2012……….22
Figure 1.3: Relationship between annual molt speed and mean 9th primary length during
annual median date of capture with standard error bars………23
Figure 1.4: Relationship between the residuals of the relationship between annual molt
speed and 9th primary length (from Fig 1.3) and annual median hatching date of adult
female greater snow geese on Bylot Island, Nunavut………...24
Figure 1.5: Relationships between estimated molt initiation date (A) or molt completion
date (B) and hatching date of adult female greater snow geese on Bylot Island, Nunavut...25
Figure 1.6: Relationships between annual median dates of laying, hatching, molt initiation
and 75% molt completion of female greater snow geese in relation date of 50% snow cover in spring on Bylot Island………...26
Figure 1.7: Relationship between the residual 9th primary length and the residual body
condition………28
Figure 2.1: Relationship between plasma T3 level and 9th primary length of molting adult
female greater snow geese……….44
Figure 2.2: Relationship between plasma T3 level corrected for molting stage (i.e.
residuals of the relationship between T3 and 9th primary length) and molt initiation date of
molting adult female greater snow geese………..46
Figure 2.3: Relationship between plasma T3 levels corrected for molting stage (i.e.
residuals of the relationship between T3 and 9th primary length) and body condition of
molting adult female greater snow geese………..47
Figure 2.4: Relationship between plasma T3 level corrected for molting stage (i.e. residuals
of the relationship between T3 and 9th primary length) and corticosterone (CORT)
measured in growing feathers of molting adult female greater snow geese in 2012………48
Figure 2.5: Relationship between body condition and corticosterone (CORT) measured in
LISTE DES APPENDICES
Appendix 1: Summary table of median hatching date, capture date and mean 9th primary
length during the 22 years of sampling……….73
Appendix 2: Eigenvalues and loading extracted from Principal component Analysis
output……….74
Appendix 3: Annual relationships between 9th primary length of adult female greater snow
geese and capture date on Bylot Island, Nunavut, during the 22 years of the study……….76
Appendix 4: Model selection for the effect of capture Date , Year and their interaction on
9th primary lentgh of adult female greater snow goose……….77
Appendix 5: Experimental device used to measure bending stiffness of feathers………...78 Appendix 6: Relationship between 9th primary length and capture date of molting adult
female greater snow geese……….79
Appendix 7: Relationship between T3 and residuals of 9th primary length vs capture date in
molting adult female greater snow geese………..80
Appendix 8: Relationship between corticosterone (CORT) measured in feather of molting
adult female greater snow geese and molt initiation date……….81
Appendix 9: Relationship between bending stiffness of growing feathers and body
condition of molting adult female greater snow geese………..82
Appendix 10: Relationship between bending stiffness of growing feathers and
REMERCIEMENTS
Cette étude à été financé par le Conseil de Recherche en Sciences Naturelles et en Génie du Canada, Le Plan Conjoint des Oies de l’Arctique (Environnement Canada), le réseau de Centre d’excellence ArcticNet, le Centre d'Études Nordiques et le Programme du Plateau Continental Polaire (ressources Naturelles Canada).
J’aimerais remercier Gilles Gauthier, qui m’a fait confiance pour assurer la continuité de la base de données sur l’oie des neiges à Bylot et qui m’a ainsi permis de continuer mes rêves et mon cheminement polaire. Merci aussi pour sa pédagogie et sa patience face à mes analyses statistiques et mon anglais.
J’aimerais remercier Pierre Legagneux pour son aide précieuse tout au long de ma maîtrise. Au-delà des sciences, merci pour son soutien et ses conseils qui resterons toujours utiles.
Merci à Jacques Larochelle, merci infiniment pour ces moments de partage et pour ces heures de discussion économico-socio-psycho-physico-mécano-éco-physiologique qui m’ont énormément apporté tant sur le plan humain que scientifique.
Merci à l’ensemble des membres du laboratoire qui ont rendu ces trois années particulièrement agréables. Merci DD, Dom, Audrey, Cynthia, Christine et Marie-Claude pour votre aide et votre bonne humeur.
Merci à tous les Bylotien(nes) avec qui j’ai eu la chance de partager des moments de terrain, de vie et qui ont contribué à rendre ceci encore plus beau. Merci entre autres à Audrey, Caro, Clément, David, Don-Jean, Eric, Etienne, Flo, Fred, Gab, Isabeau, J-Choubinou-F, Jo, Joasie, Joël, Pascal, Steph, Veillette…
Merci à ma copine pour son soutien, sa compréhension et pour le partage de cette passion débordante.
AVANT-PROPOS
Ce mémoire est composé d’une introduction, d’une conclusion générale ainsi que deux chapitres rédigés en anglais pour publications dans des revues scientifiques. Les co-auteurs des articles ont contribué de la manière suivante :
Gilles Gauthier (chapitre 1 et 2) a fourni l’idée originale du projet et a contribué à sa planification, aux analyses et à la rédaction du manuscrit.
Pierre Legagneux (chapitre 1 et 2) a contribué aux analyses et à la rédaction du manuscrit.
Marie Christine Cadieux (Chapitre 1) a contribué au traitement des données et à la logistique de terrain.
Jacques Larochelle (Chapitre 2) a contribué à la conception et la réalisation du dispositif expérimental permettant de mesurer la rigidité des plumes.
INTRODUCTION GENERALE
Les contraintes du milieu arctique sur les oiseaux migrateurs
Selon l’IPCC (2013), la température terrestre moyenne a augmenté de 0.85°C au cours du dernier siècle. Cette augmentation est pratiquement deux fois plus rapide dans les régions arctiques que sur le reste de la planète et pourrait atteindre entre 1.8 et 4°C à la fin du XXI siècle. Les projections concernant le réchauffement font apparaître une réduction de la couverture neigeuse et une augmentation d’épaisseur de la couche de dégel dans la plupart des régions à pergélisol (IPCC, 2013). Pourtant, d’autres modèles prévoient également une augmentation des précipitations dans les hautes latitudes (Hassol, 2004) et il est possible que dans les régions arctiques, ces précipitations tombent sous forme de neige au printemps. Quoi qu’il en soit, les changements climatiques constatés et annoncés ont un impact direct sur les conditions de neige, de glace et sur l’épaisseur de la couche active. Ces caractéristiques environnementales contraignent fortement le cycle de vie de nombreuses espèces. Les oiseaux migrateurs qui se reproduisent en Arctique pourraient être considérablement impactés par ces changements.
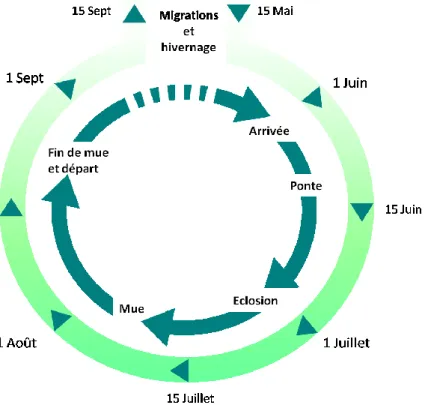
Les oiseaux migrateurs sont contraints par un été très court pour compléter leur cycle vital dans l’Arctique. Ces oiseaux doivent terminer la totalité du cycle de reproduction avant la fin de la saison estivale pour permettre aux juvéniles d’effectuer leur premier envol lors de la migration vers les sites d’hivernages (Lesage et Gauthier, 1998). En plus de la reproduction, la mue est une autre activité du cycle vital de ces oiseaux qui doit être achevée, généralement, après la reproduction et avant la migration automnale (Fig. 1). La mue est un processus qui intervient annuellement et qui permet le renouvellement des plumes usées (Holmgren et Hedenström, 1995). Chez la plupart des espèces d’oiseaux migrateurs, la mue est initiée peu de temps après l’élevage des jeunes. Cette activité perturbe les fonctions remplies par les plumes soit le vol et l’isolation thermique des oiseaux (Jenni et Winkler, 1994). Le contrôle de la mue est complexe et fait intervenir de nombreux facteurs endogènes et environnementaux. La période de mue est en effet contrainte par la longueur des saisons (Earnst, 1992) et par la latitude des sites de nidification et d’élevage de la progéniture (Van Der Jeugd et al. 2009).
Figure 1 : Phénologie des principales activités estivales d’un oiseau migrateur Arctique.
Les dates correspondent à l’oie des neiges sur l’île Bylot (Nunavut ,Canada)
L’impact des conditions environnementales et climatiques sur la reproduction a été beaucoup étudié et représente une contrainte importante pour des oiseaux dont le cycle vital est long. La date de ponte de ces oiseaux est en effet fortement reliée à la couverture de neige et aux températures printanières sur les sites de nidification (Bêty et al. 2003; Gauthier et al. 2003; Dickey et al. 2008). Bien que l’effet des conditions environnementales sur la reproduction des oiseaux qui nichent en arctique soit bien documenté, très peu d’études se sont intéressées à l’impact que cela pourrait avoir sur la mue.
Cette étude s’intéresse au cas de l’oie des neiges (Chen caerulescens), une espèce qui niche dans l’Arctique et qui fait face à des contraintes environnementales sévères durant la reproduction et la mue. Le projet permettra d’appréhender l’effet des conditions environnementales et des facteurs endogènes comme la condition corporelle ou le statut hormonal des individus sur la phénologie d’une activité essentielle du cycle annuel des oiseaux telle que la mue et sur la qualité des plumes produites chez l’oie des neiges.
Phénologie et phénomènes de synchronie/asynchronie
La phénologie correspond au calendrier d’initiation des activités essentielles du cycle vital d’un organisme selon les saisons (Berteaux et al. 2004). Il apparaît clairement que dans un contexte arctique où les changements climatiques sont accélérés, la phénologie des différentes espèces locales peut être rapidement bouleversée. D’après Both et Visser (2001), les organismes vivants devraient répondre à l’augmentation des températures printanières par un avancement de la période de reproduction. Pourtant, cette adaptation aux changements climatiques est souvent contrainte par des facteurs qui interviennent durant la période de migration, notamment chez les espèces migratrices parcourant de longues distances (Both et Visser, 2001). La photopériode, qui n’est aucunement affectée par les changements climatiques, influence fortement le rythme circannuel propre à chaque espèce et détermine par exemple la date de migration (Gwinner, 1996; Both et Visser, 2001). Ainsi, la réponse au réchauffement climatique à travers les changements phénologiques peut s’avérer bien différente entre les espèces sédentaires et les espèces migratrices. Selon Durant et al. (2007), quand tous les organismes ne répondent pas à la même vitesse aux changements climatiques, cela peut conduire à une asynchronie trophique (match/mismatch hypothesis en anglais).
En allongeant la durée de la saison estivale, un printemps précoce pourrait avoir des effets bénéfiques pour les oiseaux nichant en Arctique (Møller et al. 2009). Pourtant, des effets négatifs dus à une asynchronie avec la disponibilité en nourriture sont également possibles (Visser et Both, 2005; Doiron, 2014). Par exemple, des études réalisées sur la mésange charbonnière (Parus major) ou le gobemouche noir (Fidecula hypoleuca) ont montré que l’avancement du pic d’abondance de chenilles due aux changements climatiques n’est plus synchronisé avec la demande énergétique maximale de la progéniture de ces oiseaux (Both et Visser, 2001; Visser et al. 2004). Chez les espèces herbivores, une accélération de la croissance des plantes suite au réchauffement pourrait induire une asynchronie entre le pic de production végétale et le pic de demande en énergie et en nutriments pour la croissance des jeunes (Dickey et al. 2008, Doiron et al. 2014). Si la demande énergétique des consommateurs est synchronisée avec le pic de disponibilité de nourriture, alors le recrutement sera maximal. Dans le cas contraire, la disponibilité de
nourriture ne concorderait pas avec les exigences énergétiques des consommateurs (i.e. asynchronie) et se traduirait par une baisse de recrutement (Both et al. 2006). Il est aussi possible que la discordance entre les besoins énergétiques d’un consommateur et la disponibilité des ressources puissent affecter d’autres activités du cycle vital comme la mue.
Physiologie et coût énergétique de la mue
Coût énergétique de la mue
La mue est un processus physiologique qui intervient annuellement et qui est énergétiquement coûteux, surtout chez les oies et les canards (Dean, 1978; Raveling, 1979; Guillemette, 2007). En effet, chez ces espèces toutes les plumes de vol sont remplacées simultanément plutôt que séquentiellement comme chez la plupart des autres espèces d’oiseaux, ce qui empêche les individus de voler pendant 3 à 4 semaines chaque été. De plus, chez les oies, la mue chevauche la reproduction car elle survient pendant l’élevage des jeunes en été, ce qui est exceptionnel chez les oiseaux. Bien que ceci ait été rendu possible par le mode de reproduction nidifuge de ces oiseaux où les parents ne nourrissent pas leurs jeunes, les adultes fournissent néanmoins des soins parentaux durant l’élevage, ce qui représente un coût (e.g. vigilance accrue, temps d’alimentation réduit, défense face aux prédateurs, Schindler et Lamprecht, 1987).
La durée de la mue varie d’une espèce à l’autre et dépend entre autre de la distance de migration et de la latitude des sites de mue (Payne, 1972). D’après Murphy et King (1992), la dépense énergétique de la mue est corrélée à la durée de celle-ci. Des études menées sur la bernache nonette (Branta leucopsis) en captivité rapportent que ces oiseaux perdent environ 25% de leur masse entre le début et la fin de la mue (Portugal et al. 2007). Les même tendances de réduction de la masse des individus en mue ont été mis en évidence sur des bernaches en milieu naturel sur l’archipel du Svalbard (Tombre et Erikstad, 1996; Phillips et al. 2003). Cette perte de poids serait liée à une augmentation importante du métabolisme et une dépense énergétique élevée. L’augmentation du métabolisme durant la mue, mesurée à partir de la consommation d’oxygène, à été mise en évidence chez différentes espèces d’oiseaux (Payne, 1972; Green et al. 2004). Dans leurs travaux,
Portugal et al. (2007) concluent que la perte de poids est principalement causée par le fait que la forte demande énergétique de la mue pour la synthèse de nouvelles plumes est assurée principalement par les réserves endogènes. Les travaux réalisés par Owen et Ogilvie (1979) sur la bernache du canada (Branta canadensis) ont permis d’estimer qu’environ 10% des dépenses énergétiques de l’oiseau sont allouées à l’activité de mue durant l’été.
La plume est composée à 95% de kératine, une protéine riche en acides aminées sulfurées (cystéine et méthionine; Murphy et King, 1992). La synthèse protéique est un processus énergétiquement coûteux mais la dépense énergétique totale des oiseaux en mue est largement supérieure au seul coût de la synthèse de kératine. Les travaux de Murphy et Taruscio (1995) rapportent que le coût total de synthèse de nouveaux tissus par un individu en mue peut être trois fois supérieur au coût de synthèse de la kératine seule. Le maintien des tissus nécessaires à la production de la kératine pourrait représenter en effet la majorité des dépenses énergétiques lors de la mue (Lindström et al. 1993; Dawson, 2003). Des changements physiologiques énergétiquement coûteux comme l’augmentation de la volémie ou de la vascularisation sont également observés lors du processus de la mue (Chilgren et DeGraw, 1977; Murphy et al. 1992). Enfin, le renouvellement des plumes entraine une déperdition de chaleur due notamment à l’augmentation de la conductance et de l’évaporation, ce qui provoque des coûts supplémentaires pour la thermorégulation des oiseaux lors de l’activité de mue (Chilgren et DeGraw, 1977)
Contrôle physiologique de la mue
La mue chez les oiseaux est sous contrôle hormonal et serait notamment influencée par les hormones thyroïdiennes (Davis et Davis 1954; Wilson et Farner 1960). La thyroxine (T4) et la triiodothyroïne (T3) sont deux hormones circulantes secrétées par la glande thyroïde. L’activité de cette glande endocrine est contrôlée notamment par les hormones hypophysaires et par la photopériode. Les hormones thyroïdiennes sont impliquées dans de nombreux processus physiologiques complexes comme la prolifération cellulaire, le développement, la croissance et la thermogénèse (Hulbert, 2000). Du fait que ces hormones aient différentes fonctions (hormones pléiotropiques), il est parfois difficile de conclure à
une relation de cause à effet en présence d’une corrélation entre une activité physiologique précise et l’augmentation des hormones thyroidiennes (Jenni-Eiermann et al. 2002). Néanmoins, de nombreuses études mettent en évidences les variations saisonnières de l’activité de la thyroïde grâce aux mesures des niveaux circulatoires de T3/T4 (Scanes, 1979; Campbell et Leatherland, 1980; Groscolas et Leloup 1986; Lien et Siopes, 1993). Plusieurs travaux ont montré une relation entre l’augmentation des hormones thyroïdiennes, notamment de la thyroxine circulante, et l’activité de mue (Smith et al. 1982; Groscolas et Leloup, 1986 ; Groscolas et Cherel, 1992; Jenni-Eiermann et al. 2002). D’après Newcomer (1957), les hormones thyroïdiennes stimulent la croissance et la prolifération cellulaire dans la papille dermique de la plume et selon Stokkan et al. (1985) les niveaux élevés de thyroxine circulant coïncident avec le renouvellement des plumes chez le lagopède alpin (Lagopus muta hyperborea). Enfin, Vézina et al. (2009) rapportent que l’augmentation des niveaux de thyroxine est reliée à une augmentation du métabolisme basal d’environ 10% lors de la mue chez le bécasseau maubèche (Calidris canutus islandica).
Facteurs environnementaux et endogènes pouvant influencer la
phénologie de la mue
L’effet des conditions environnementales sur la phénologie de la mue a été peu étudié comparativement aux autres activités du cycle vital comme la reproduction, notamment à cause de la difficulté logistique de suivre plusieurs espèces en milieu naturel au moment de la mue. De nombreux travaux ont permis d’évaluer l’impact des conditions climatiques sur la phénologie de la reproduction (Both et Visser, 2001; Durant et al. 2007; Post et Forchammer, 2008). Ces impacts sont particulièrement importants chez les espèces nichant dans l’Arctique. Par exemple, des travaux ont mis en évidence la corrélation entre la couverture neigeuse au printemps et l’initiation de la reproduction chez différentes espèces d’oies (voir Bêty et al. 2003 ; Dickey et al. 2008 chez la grande oie des neiges Chen
caerulescens atlantica ou Madsen et al. 2007 chez l’oie à bec court Anser brachyrhynchus).
Le début de la nidification est en effet retardé et la taille des couvées réduite lors des années où la couverture de neige est importante au printemps. Lorsque les oies échouent leur nidification, la mue intervient généralement plus tôt que chez les oiseaux qui nichent avec succès et qui doivent élever des jeunes. La date de mue apparaît donc comme un
compromis entre les coûts d’une initiation tardive de la mue (e.g. lorsque les oies se reproduisent) et les bénéfices associés au commencement de la mue tôt dans la saison (e.g. lorsqu’il n’y a pas la contrainte de reproduction).
Les oies sont un modèle biologique très pertinent pour étudier les compromis possibles entre mue et reproduction car les individus reproducteurs demeurent sur les sites de reproduction pour effectuer leur mue, ce qui facilite le suivi (Reed et al. 2003). Les oies dépendent à la fois des réserves endogènes accumulées lors des haltes migratoires et de la disponibilité de nourriture sur les sites de nidification pour investir dans la reproduction et notamment dans la formation des œufs (Choinière et Gauthier, 1995; Gauthier et al. 2003). Lors d’un printemps tardif, non seulement le début de la nidification sera retardé mais la condition corporelle des individus risque aussi d’être réduite à cause d’un manque de ressources en pré-ponte. Ceci pourrait avoir des répercussions importantes sur la mue, notamment en retardant le début de cette activité ou en forçant les individus à l’entreprendre avec une condition corporelle réduite. Si le début de la mue est retardé, les oies pourraient manquer de temps pour compléter cette activité importante avant la fin du court été arctique. D’autre part, si la phénologie de la mue n’est pas retardée lors de printemps tardifs, les oies pourraient ne pas avoir assez de temps pour reconstituer leurs réserves endogènes après la fin de l’incubation, ce qui pourrait affecter le déroulement de la mue, notamment en diminuant la qualité des nouvelles plumes (voir plus bas). Des études menées sur différentes populations de bernache nonette (Branta leucopsis) suggèrent que la phénologie de la mue apparaît moins flexible que la phénologie de la reproduction (Van der jeudg, 2009), peut-être à cause de facteurs de régulations endogènes (e.g. hormones) qui seraient peu sensibles aux facteurs environnementaux.
Stress durant la mue et qualité des plumes
Des conditions environnementales difficiles ou une condition physique réduite des individus peuvent être des sources importantes de stress chez les animaux et avoir des répercussions sur certaines fonctions physiologiques. La réponse au stress chez les oiseaux est accompagnée d’une libération d’hormone stéroïde telle que la corticostérone (Romero, 2004) qui permet notamment de maintenir en alerte un individu en situation de stress et de
mieux y répondre (Sapolsky et al. 2000). Les oiseaux migrateurs nichant en Arctique sont souvent exposés à des conditions climatiques très rudes comparativement aux espèces qui nichent dans les milieux plus tempérés, ce qui peut induire une source de stress supplémentaire (Wingfield et Hunt, 2002; Bokony et al. 2009). Toutefois, des niveaux prolongés de corticostérone peuvent avoir un effet négatif sur certaines fonctions physiologiques comme le système immunitaire (Khansari et al. 1990; O’Neal et Ketterson 2012) ou le renouvellement des plumes en ralentissant ou en provoquant des interruptions de croissance comme chez l’étourneau sansonnet (Sturnus vulgaris; Strochlic et Romero, 2008). D’autres expérimentations réalisées sur la même espèce ont montré qu’un stress chronique comme la restriction en nourriture pouvait aussi influencer la qualité des nouvelles plumes formées lors de la mue (Desrocher et al. 2009). En effet, dans des conditions de stress chronique, la distance inter-barbule augmente, le nombre de barbules sur les primaires diminue et les plumes deviennent plus cassantes lorsqu’elles sont soumises à des contraintes de tension.
La régulation de la corticostérone pourrait apparaître comme un compromis entre des niveaux élevés permettant une bonne réponse à un stress aigu et des niveaux relativement bas qui assurent par exemple une bonne croissance des plumes lors de la mue (Romero et al. 2005; Strochlic et Romero, 2008). Il faut toutefois rester prudent car les expérimentations induisant une diminution de la qualité des plumes ont été réalisées à des taux de corticostérone supérieurs à ce qu’on retrouve en milieu naturel. Néanmoins, plusieurs travaux rapportent que la contraction de la durée de la mue altère aussi la qualité des plumes (Dawson et al. 2000; Hall, 2000; Serra, 2001) et pourrait se répercuter sur les capacités de vols, la survie et la reproduction des oiseaux (Dawson et al. 2000).
La mesure du stress d’un individu est particulièrement difficile puisque la capture et la manipulation lors du prélèvement d’échantillons provoquent une élévation des niveaux de corticostéroïde, ce qui peut biaiser les résultats si la prise de sang n’est pas réalisée immédiatement après capture (Romero et Reed, 2005). De plus, il n’existe pas de relation entre le niveau basal de corticostérone plasmatique d’un individu et l’élévation des niveaux hormonaux suite à la capture chez l’oie des neiges (Legagneux et al. 2011). Par contre, d’après Bortolotti et al. (2008), la corticostérone mesurée dans les plumes de perdrix rouge
(Alectoris rufa) reflète bien les niveaux plasmatiques de l’hormone durant la croissance des plumes et pourrait donc être un bon indice pour la mesure du stress aviaire pendant la mue.
Objectifs de l’étude
Ce projet vise à évaluer l’impact des conditions environnementales, de la condition corporelle et du statut hormonal des individus sur la mue de l’oie des neiges en combinant des données à long terme (> 20 ans) et une approche éco-physiologique. La grande oie des neiges est une espèce migratrice qui se reproduit dans le haut arctique canadien et qui peut être ainsi confrontée à de sévères conditions environnementales. La date de ponte (médiane = 12 juin) suit de près la disparition du couvert neigeux. Peu de temps après l’éclosion (début du mois de juillet), les oies initient leur mue et renouvellent la totalité des plumes de vol, ce qui entraine une incapacité de voler durant 3 à 4 semaines. Le recouvrement des capacités de vol intervient au mois d’août et précède la migration automnale vers les sites d’hivernage.
Le premier chapitre de ce mémoire vise à examiner, à l’échelle populationnelle, l’effet de la phénologie annuelle de la reproduction et des conditions environnementales sur la phénologie de la mue et la condition corporelle des oies adultes femelles en mue. Face aux contraintes temporelles auxquelles sont confrontées les oies nichant en arctique, nous nous attendons à de possibles ajustements de la date d’initiation de la mue et nous émettons l’hypothèse que la phénologie de la mue est moins flexible que la phénologie de la reproduction.
L’objectif principal du deuxième chapitre vise à examiner, à l’échelle individuelle, l’effet de la phénologie de la mue, des hormones thyroïdiennes (T3), du stress (corticostérone) et de la condition corporelle sur le déroulement de la mue de l’oie des neiges et la qualité des plumes nouvellement synthétisées. Nous émettons l’hypothèse que la date d’initiation de la mue se répercute sur l’activité métabolique et sur les niveaux de corticostérone mesurés durant la mue. De plus, nous émettons l’hypothèse que la condition corporelle et les niveaux de corticostérone pourraient affecter la qualité des nouvelles plumes.
CHAPITRE 1
PLASTICITY IN MOLT SPEED AND TIMING IN AN
ARCTIC-NESTING GOOSE SPECIES
VINCENT MARMILLOT1, GILLES GAUTHIER1, MARIE-CHRISTINE CADIEUX1 &
PIERRE LEGAGNEUX2
1 Département de Biologie & Centre d’études nordiques, 1045 avenue de la Médecine,
Pavillon Vachon, Université Laval – Québec, QC, Canada, G1V 0A6
2 Département de Biologie, chimie et géographie & Centre d’études nordiques, Université
RESUMÉ
Les contraintes environnementales sont particulièrement fortes chez les espèces migratrices qui se reproduisent dans l’Arctique. En plus de la reproduction, les Anatidae doivent renouveler simultanément l’ensemble de leurs plumes de vol durant la courte période estivale. Nous examinons ici comment les contraintes temporelles et climatiques affectent la phénologie de la mue des plumes de vol chez une espèce qui niche dans le Haut Arctique, la grande oie des neiges (Chen caerulescens atlantica). Nous utilisons une base de données comprenant 1412 femelles adultes en mue mesurées pendant 15 ans à l’île Bylot, Nunavut. La longueur de la 9e primaire a été utilisée pour déterminer le stade et la
vitesse de mue. Nous avons trouvé une relation positive entre les dates annuelles médianes d’éclosion et d’initiation de la mue, et la pente ne différait pas de 1 (b1 = 1.3, 95% CI : 0.9-1.7). Ceci suggère que l’intervalle entre l’éclosion et la mue est fixe et que les oies ne devancent pas la mue lorsque la phénologie de la reproduction est tardive. Il n’y avait par contre aucune relation entre les dates annuelles médianes d’éclosion et de recouvrement des capacités de vol en fin de mue. Ceci suggère que la date de fin de la mue est indépendante de la phénologie de la reproduction. La vitesse de croissance des plumes semblait augmenter dans les années où l’éclosion était tardive et ceci pourrait être le principal mécanisme par lequel les oies ajustent la phénologie de la mue. Finalement, une relation positive entre la longueur de la 9e primaire (corrigée pour les variations interannuelles) et la
condition corporelle a été trouvée, suggérant un retard dans la mue chez les individus en mauvaise condition. Ces résultats mettent en évidence une plasticité de la mue de l’oie des neiges caractérisée par un ajustement de la vitesse de croissance des plumes. Cette plasticité phénotypique permettrait d’achever le renouvellement des plumes de vol avant la fin du court été Arctique, indépendamment de la phénologie de la reproduction et des conditions environnementales printanières. Ces résultats sont particulièrement novateurs car jusqu’ici, il était admis que la vitesse de mue était très peu flexible chez les oies.
ABSTRACT
Environmental constraints are particularly strong in migratory species that breed in the Arctic. In addition to breeding, Anatidae have to renew simultaneously all their flight feathers during the short Arctic summer. We examine how temporal constraints and climate affect the phenology of flight feather molt in the greater snow goose (Chen caerulescens
atlantica), a High Arctic nesting species. We used a database of 1412 molting adult females
measured over 15 years on Bylot Island, Nunavut. Ninth primary length was used to determine the molt stage and speed of feather growth. We found a positive relationship between median annual hatching and molt initiation dates and the slope did not differ from 1 (b1 = 1.3, 95% CI: 0.9-1.7). This suggests that, contrary to our expectation, the interval between hatching and molt initiation is rather fixed and geese do not advance the start of molt when the reproductive phenology is late. Nonetheless, there was no relationship between median hatching date and the date at which birds regained flight capacity at the end of molt. This suggests that date of end of molt is relatively fixed and independent of the reproductive phenology. There was a trend for an increase in the speed of flight feather growth in years when hatching date was delayed and this could be the main mechanism that could explain adjustment in molt phenology in this species. Finally, we found a positive relationship between ninth primary length (corrected for inter-annual variations) and body condition, suggesting a delay in molting for individuals in poor condition. These results suggest that molt plasticity is primarily achieved by variations in feather growth speed in snow geese. This phenotypic plasticity could be necessary to complete flight feather renewal before the end of the short summer in the High Arctic, independently of reproductive phenology and spring environmental conditions. These results are particularly novel because until now, molt speed had be found to be rather in flexible in geese.
INTRODUCTION
Timing of breeding is a key determinant of reproductive success in many species. (Perrins, 1970; Lepage et al. 2000; Dickerson et al. 2005). In migratory species, reproduction is conditioned by arrival date on the breeding ground, which is thus crucial for the chain of events leading to a successful reproduction (Both and Visser, 2001; Bêty et al. 2003, 2004). Environmental conditions encountered during the migration and upon arrival on the breeding ground are both susceptible to affect the timing of breeding, either directly or indirectly by affecting arrival date or body condition (Both et al. 2005, Eichhorn et al. 2009; Van der Jeudg et al. 2009; Legagneux et al. 2012). In addition to the reproduction, molting is another important activity of the life cycle of birds that often needs to be completed during the summer. In many migratory species, the annual molt follows shortly after the completion of breeding. Thus, delays in breeding may lead to a delay in molting, or an overlap between molt and reproduction or migration, potentially increasing stress and energetic costs for individuals (Hemborg and Lundberg, 1998).
Molting is a complex process that requires large amounts of nutrients and energy. Protein requirement increases to build new feathers, which are composed at 95% of keratin (Murphy and King 1984). In addition, several other metabolic and physiologic changes are required for integument regeneration such as increases in vascularisation, blood volume and erythrocytes (Meister, 1951; Chilgren and DeGraw, 1977; DeGraw and Kern, 1985; Murphy et al. 1992). Moreover, feather renewal potentially increases the energetic cost of thermoregulation due to a decrease in plumage insulation. Loss of wing feathers also disrupts flight efficiency or totally eliminates flight capabilities as in some waterbirds that shed all flight feathers simultaneously (Slagsvold and Dale, 1996; Swaddle and Witter, 1997; Portugal, 2010). Depending on species and duration of feathers renewal, energetic cost of molt may represent up to 20% of daily energy expenditure, such as in the white-crowned sparrow (Zonotrichia leucophrys), and result in a body mass loss of up to 25 %, as in barnacle geese (Branta leucopsis) (Murphy and King, 1992; Portugal et al. 2007).
Several authors have suggested that the timing of molt has evolved to avoid overlap with other energetically-demanding processes such as breeding or migration (Foster, 1974;
Heitmeyer, 1987; Svensson and Nilsson, 1997; Yuri and Rohwer, 1997, Singer et al. 2012). However, for some species that molt flight feathers all at once rather than sequentially, such overlap is difficult to avoid. This is the case in many Anatidae species, and especially swans and geese, which have a lengthy breeding season due to their large body size. In order to complete their flight feather molt before the onset of the fall migration, it must occurs during the brood-rearing season, when adult are caring for their young (Dean, 1978; Raveling, 1979; Ankney 1984). This may create a conflict between brood-rearing and molting, especially in females which must replenish their body reserves depleted during incubation before initiating their remigial molt.
Temporal constraints faced by molting birds have been recently studied in the black brant (Branta bernicla nigricans) in Alaska. Timing of molt initiation was found to be partially dependent upon nesting phenology (Singer et al. 2012). A minimum of 16 days was required between hatching and molt initiation, leading to a delay in molt initiation during late nesting years. However, in early nesting years, the interval between hatching and molt initiation lengthened to 19 days in average. This suggests an advantage for females to delay their molt in order to restore more fully their body reserves when temporal constraints are relaxed (Singer et al. 2012).
Depending of the local climatic conditions where species breed in the Arctic, environmental and temporal constraints vary. For species breeding further north, the snow-free period is shorter and climatic conditions are harsher and more variable (Lesage and Gauthier, 1997). This is the case of the greater snow goose (Chen caerulescens atlantica), a species that breeds in the High Arctic and where the phenology of reproduction is highly dependent upon the timing of snow melt and temperature near laying time (Bêty et al. 2003; Dickey et al. 2008). Here, we examined how both temporal and climatic constraints affect the timing of remigial molt in this species.
Considering that previous studies in brants found little variation in the speed of feather growth (Taylor, 1995; Singer et al. 2012), we expected that possible adjustments in molt phenology in response to environmental conditions should be primarily governed by change in the timing of molt initiation. We hypothesized that the timing of molt should be
less flexible than the timing of breeding due to the constraint of regaining flight capabilities before the onset of the fall migration. We predicted (1) greater inter-annual variability in the egg-laying and hatching dates compared to date of molt initiation; (2) In late-nesting years, the interval between hatching and molt initiation should be reduced; (3) molt initiation should be less strongly related to snow-melt date than egg-laying; and (4) female body condition of molting females should be reduced in late-nesting years, due to a reduced interval between hatching and the onset of molt. However, an alternative hypothesis could be that birds adjust their molt phenology by modulating molt speed rather than by change in molt initiation date. Under this hypothesis, we predicted that (1) the interval between hatching date and molt initiation should be constant and (2) molt speed should increase in late-nesting year to ensure that molt completion is not delayed in those years. We examined these predictions using a 15-year dataset.
MATERIALS AND METHODS
Study area
This study was carried out on Bylot Island, Nunavut, Canada (73°08N, 80°08W; Fig. 1.1) from 1992 to 2013. The south plain of the island (ca 1600 km2) supports a colony of greater
snow geese estimated at 20,000 pairs (Reed et al. 2002). Geese typically arrive in late May/early June and initiate nesting around 12 June. Most geese nest in a large colony located in the central part of the south plain. Hatching occurs around 10 July and most goose families disperse across much of the island for brood-rearing, though mostly in a northward direction (Mainguy and Gauthier, 2006). They select freshwater wetlands such as tundra polygons for foraging. By the end of August, shortly before the onset of the fall migration in early September, both adults and young are able to fly (Menu et al. 2005).
Figure 1.1: Map showing the study area on the south plain of Bylot Island and its
localisation in Nunavut, Canada. Black dots represent capture sites during the 15 years of data used in the analysis and the thick line represents the limit of the nesting colony.
Goose reproductive data
Since 1992, we monitored the nesting biology of greater snow geese. In the core of the colony, we systematically searched the same area (~ 50 ha) and monitored ca. 200 nests each year. A second sample of ca 200 nests was also monitored in a variable number of 100x100 or 200x200 m plots (≥ 10 plots/year) randomly located throughout the colony. We determined the date at which the first egg was laid (i.e. laying date) by different methods depending of the nest stage. When a nest was found during egg-laying, we back calculated from the date of discovery assuming a laying interval of 33h between each egg. For nests found during incubation with a known hatching date, laying date was estimated by back-calculating from hatching date based on the recorded clutch size and the incubation length (23 days). Finally, laying date of nests found during incubation with unknown hatching
from measure of egg length, width and mass) and incubation stage (see Lepage et al. 1999 for details). Hatching date was defined as the date at which at least half of the brood was hatched and clutch size as the maximum number of eggs recorded in a nest after the start of incubation. Laying date differed between nests located in the core and in the rest of the colony (F [1; 2992] = 93.2, p < 0.001) with a significant interaction between location and year
(F [3; 2990] = 57.3, p < 0.001). However, the magnitude of the difference between the two
locations was small (i.e. 0.6 d; Core = 163.9 (day of the year), rest of the colony = 164.5) and we decided to pool all nests monitored to calculate median laying date each year.
Capture and measure of molting geese
Goose families composed of flightless molting adults and their young were captured, with the help of a helicopter, in mass banding drives between 5 and 17 August each year, toward the end of the molting period (Menu et al. 2005). Only successful breeding adults were susceptible to be captured because most of the non-breeders or failed breeders (those that failed to hatch a brood) leave the island to molt (Reed et al. 2003). Moreover, the few non-/failed breeders that remain on the island start molting earlier and have regained flight ability by the beginning of August. Most banding drives occurred north of the colony and where concentrated in a valley located ~25 km from the colony (Fig. 1.1), which had the highest concentration of wetlands on the island and was heavily used by geese (Hughes et
al. 1994, Reed et al. 2002). Thus, 95% of the captures were made within an area of
approximately 350km² (Fig. 1.1).
Each year, captures were spread over 4 to 9 days and included from 1 to 4 captures (capture groups) per day (mean = 1.2). We moved > 2 km between each capture in a systematic fashion to avoid recapturing the same individuals. Capture groups averaged 395 geese including both young and adults (min = 13, max = 1185). We took morphometric measurements (culmen, tarsus and head length with an electronic calliper to the nearest 0.1 mm), body mass (to the nearest g with an electronic balance) and the length of the 9th
primary feather (to the nearest mm with a ruler) to estimate the molt stage on a sample of adult females. We measured on average 15 females per catch (min = 1, max = 49) and 89
females per year (min = 32, max = 189) for a total of 1967 females during the 22 years of data collection (Appendix 1).
Environmental covariates
We monitored snow-melt at the study site by visually estimating snow cover from a vantage point every 2 days from 1 June until snow disappearance. We used the date at which snow had melted over 50% of the study area as an index of snow-melt phenology (SNOW). An automated weather station located at the study site recorded hourly air temperature, ground temperature (2 and 10cm) and snow depth since 1994 (CEN 2013). For the period before 1994 and some months with missing data, we extended the times series using weather data recorded at the Environment Canada weather station located at the Pond Inlet airport, 80 km away. Data from the two stations were highly correlated and we used the same approach as Dickey et al. (2008) to correct the Pond Inlet data. The mean of monthly July and August temperature (TEMP in °C) as well as the sum of mean daily temperature above 0°C from June to 15 August (cumulative thawing degree-days, TDD) were used as two temperature metrics in the analyses. Moreover, we used monthly North Atlantic Oscillation (NAO) indices as a global climatic index of atmospheric circulation in the Artic (data obtained from www.cpc.ncep.noaa.gov/products/precip/)
To estimate food availability for geese, which may influence body condition, annual plant production in wetlands was monitored. Each year, twelve exclosures were installed in mid-June to prevent goose grazing. In early August, when plant growth is completed, the vegetation was sampled by removing a piece of turf (20 x 20 cm) from inside the exclosures. Live (i.e. green) aboveground biomass was extracted, sorted out by taxa (grasses, Eriophorum and Carex; graminoids accounted for >95% of the biomass), dried and weighed. Annual standing crop is a good measure of annual plant production in this habitat (for details see Gauthier et al. 1995). Plant biomass (PLANT) was based on lived parts of Eriophorum, Dupontia and Carex combined (dry matter, g/m²).
Analysis
A preliminary check of the 9th primary length measurements of the 1967 individuals
revealed the presence of 9 measurements that were clearly outliers (Grubbs test, p < 0.05), likely due to measurement errors; these were deleted from the dataset. We used measurements of the 9th primary feather taken on different days during the banding period
to obtain an estimate of average speed of feather growth (hereafter referred to as molt speed). We used linear mixed models (nlme package of R) with 9th primary length as
dependant variable, capture date as explicative variable and the capture group as a random factor. This assumes that random samples of the local population are captured every day (this assumption will be addressed in the discussion). The slope of the relationship between the 9th primary length and capture date was used as an index of annual, population-level
molt speed. We tested if molt speed differed among years by including year and the year x capture date interaction in the model selection. We used AICc to rank our models and determine if molt speed was constant among years.
Using molt speed determined in the previous analysis, we could, in theory, calculate the annual median molt initiation date (MI; day of the year) by subtracting the 9th primary
length (L; in mm) divided by yearly specific molt speed (MS; in mm/day) to the date of capture (DC; day of the year) of each individual: MI = DC – L/MS. However, due to annual differences in phenology, measurements of geese did not occur exactly at the same stage of molt each year (mean annual 9th primary length ranged from 124 to 189 mm; appendix 1).
We found that annual MS was inversely related to mean L at the time of measurement (see results), suggesting that molt speed decreased near the end of molt. We corrected for that as follows. We first determined MS predicted by the previous relationship for the average L at capture, plus the residual from that relationship to account for the annual variation in molt speed (MSpred+resid). We used this value to determine L the day (d) before (Ld-1 = Ld –
MSpred+resid). We then obtained a new MSpred value from the relationship for the value Ld-1,
to which we added again the residual and calculated L on d-2 using the same process (i.e. Ld-2 = Ld-1 – MSpred+resid). We continued this procedure iteratively until reaching a L value
of 121 mm. Because we had no information < 121 mm (i.e. the minimum value in our relationship between MS and L), we considered that molt speed was constant and similar
below that value in all year and we used the same MSpred value to continue calculation until
L = 0. Molt initiation date was the date when L = 0 was reached. The same approach was used in the opposite direction to estimate the date when the 9th primary reached 75% of its
final length i.e when birds regain their flight capabilities (Mathiasson, 1973; Brown and Saunders, 1998; Guillemette, 2007; we will hereafter refer to this date as molt completion). Final length of 9th primary was 271mm (calculated from the mean of 138 adult females
measured in October from 1993 to 1997) at the fall migratory stopover site of this population in southern Quebec (Gauthier unpublished data). We also applied a constant value of molt speed in our calculations beyond the largest value of L in our relationship between MS and L (192 mm).
We determined if intrinsic (e.i. body condition) and environmental (e.i. temperature, plant biomass, snow cover) covariates could affect molt initiation and molt speed. Body condition was based on body mass corrected for body size. As an index of body size, we used the individual scores from the first axis (PC1) of a principal component analysis (PCA) based on the morphometric measurements (head, culmen and tarsus length, for details see appendix 2). We used the scale mass index (SMI) as an index of condition as recommended by Peig and Green (2009). We first calculated the slope (b) of the relationship between body mass (M) and (PC1) on a log-log scale using a standardized major axis (SMA) regression (r2 = 0.32, n = 1391, p < 0.001). Condition of each individual
was then obtained by 𝑀𝑖× (𝑃𝐶1𝑚𝑒𝑎𝑛⁄𝑃𝐶1𝑖)𝑏𝑆𝑀𝐴. Because SMI differed according to year, capture date and 2 way interaction (delta AIC vs null model: 223.3), we used residuals from this analysis as an index of condition (SMIr) to control for year and capture date variation.
The effect of SMIr, PLANT, TEMP, NAO and TDD on 9th primary length corrected for
date of capture and year effects (see results) was assessed using a mixed linear model with catch size as the random factor. Model selection was based on AICc. We also tested for possible non-linear relationships using square terms.
RESULTS
Molt speed
Typically, the 9th primary length showed a linear relationship with capture date in a given
year (see example in Fig. 1.2). Such linear relationships were significant (p < 0.05) in 13 years, marginally so in 2 others (p = 0.07 and 0.075) and not significant (p > 0.1) in 7 other years (Appendix 3). The absence of a relationship in the latter years was presumably due to some sampling biases (see discussion). For subsequent analyses, we thus excluded the 7 years for which molt speed could not be estimated (i.e. p > 0.1). Molt speed still varied among the 15 remaining years (Appendix 4), ranging from 4.27 mm/day, SE = 1.59, in 1998 to 11.28 mm/day, SE = 1.35, in 1992 (overall mean = 7.13 mm/day, SE = 0.34).
Figure 1.2: Relationship between ninth primary length of adult female greater snow geese
and capture date on Bylot Island, Nunavut, in 2012. Open grey circles represent individuals. Black dots represent the mean ninth primary length per capture date while the size of the surrounding black circle is proportional to the numbers of individuals per
groups of capture. The vertical lines represent standard error per capture date. Also shown are the slope (b1) and intercept (b0) of the linear mixed model (regression line) with individual catch as the random factor (n = 185, p < 0.001).
Annual molt speed and mean ninth primary length were negatively related (b1 = -0.06, 95CI [-0.01;-0.11], r2 = 0.29, p = 0.02, Fig. 1.3), suggesting a reduction of molt speed
toward the end of molt. In subsequent analyses, molt speed was corrected for annual variation in the timing of measurement by using the residuals of the latter relationship. Although the relationship with median hatching date was not significant, annual molt speed tended to increase in years of late hatching (b1 = 0.27, SE = 0.14, r2 = 0.22, p = 0.07, Fig.
1.4).
Figure 1.3: Relationship between annual molt speed and mean 9th primary length of adult
greater snow geese on Bylot Island, NU with standard error bars. The line represents the regression (y = -0.06x + 16.94). The year associated with each data point is shown.
Figure 1.4: Relationship between the residuals of the relationship between annual molt
speed and 9th primary length (from Fig. 1.3) and annual median hatching date of adult
female greater snow geese on Bylot Island, Nunavut. The line represents the regression (p = 0.07). The year associated with each data point is shown.
Molt phenology
Overall, molt was initiated on 25 July (day 206 of the year) with large annual variation (from 14 July in 2008 to 2 August in 1992). Molt was initiated on average 16 days after the median hatching date (8 July; range: 8 to 18 days). Inter-annual variability in date of molt initiation (coefficient of variation (CV) = 2.5%) was higher than in laying or hatching dates (CV = 2.1 and 1.6%, respectively) but equal to date of 75% molt completion (CV = 2.5%). We found a strong positive linear relationship between molt initiation dates and median hatching dates (r2 = 0.73, p < 0.001; Fig. 1.5A) with a slope not significantly different from
1 (b1 = 1.31, 95% confidence interval = 0.88 – 1.74). For each day of delay in hatching, molt initiation was delayed by 1.3 days and thus showed no evidence for a shorter interval
between hatching and molt initiation during years of late hatching. Interestingly, we found no relationship between the estimated date of 75% molt completion and median hatching date (b1 = 0.38, SE = 0.53, r2 = 0.04, p = 0.49; Fig. 1.5B).
Figure 1.5: Relationships between estimated molt initiation date (A) or molt completion
date (B) and hatching date of adult female greater snow geese on Bylot Island, Nunavut. When significant, the regression line is shown. The year associated with each data point is shown.
As expected, annual variation in reproductive phenology was related to date of 50% snow cover (laying date: r2 = 0.42, p = 0.01, b1 = 0.43, SE = 0.14; hatching date: r2 = 0.48,
p = 0.006, b1 = 0.40, SE = 0.12). Median annual molt initiation date was also related to the date of 50% snow cover with a slope of similar magnitude (r2 = 0.34 p = 0.03, b1 = 0.53,
SE = 0.21; Fig. 1.6). Finally, annual date of molt completion was not related to date of 50% snow cover (r2 = 0.05, p = 0.46, b1 = -0.24, SE = 0.31).
Figure 1.6: Relationships between annual median dates of laying (light grey circles),
hatching (dark grey squares), molt initiation (dark grey circles) and 75% molt completion (black squares) of female greater snow geese in relation date of 50% snow cover in spring on Bylot Island. Box plots show the median date (bold line), the 25/75 percentiles (box) and 1.5 interquartile range (error bars). Year 1994 was deleted from the analysis because snow had disappeared before our arrival in the field due to an almost complete absence of snow during that winter. The year associated with each data point is shown.
Factors affecting molt
Because 9th primary length varied significantly among years and with capture date
(Appendix 4), we used the residuals of this model (9th primary length vs Date + Year +
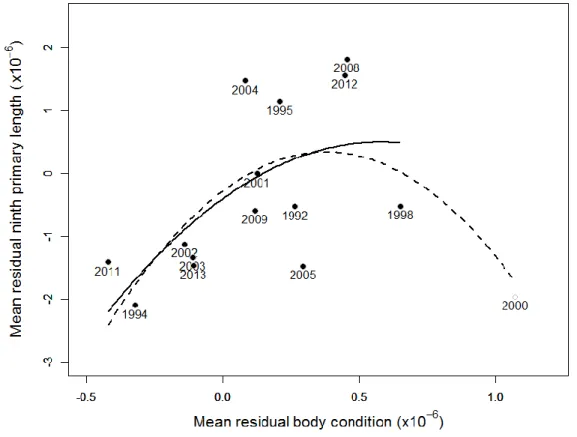
Date × Year with catch size as random factor) to examine the potential effects of covariates on molt. The only variable retained in the model was body condition (Table 1.1). Ninth primary length was positively related to body condition (linear term: b1 = 1.29×10⁻², SE =
4.28 ×10⁻³, p = 0.003; square term: b2 = - 3.68×10⁻⁵, SE = 1.81×10⁻⁵, p = 0.043; r2 = 0.01;
Fig. 1.7). The square term suggested a reduction in ninth primary length at the highest body condition but this trend was driven by a single year (i.e. 2000). Indeed, when we excluded 2000, the reduction in 9th primary length at high body condition disappeared (linear term:
b1 = 1.22×10⁻², SE = 4.28 ×10⁻³, p = 0.004; square term: b2 = - 3.45×10⁻⁵, SE = 1.80×10⁻⁵,
p = 0.056; r2 = 0.01). Finally, we found no relationship between body condition and median
hatching date (b1 = 4.68×10⁻⁸, SE = 1.49, p = 1, n = 1383).
Table 1.1: Model selection for the effect body condition index (SMIr, corrected for capture
date and year effects; see methods), temperature (TEMP) and 2 way interaction on 9th
primary length (also corrected for capture date and year effects). Other variables tested (PLANT, TDD and NAO) performed more poorly than the null model
Variables K Log-Likehood ∆_AICc
SMIr + (SMIr)² 4 -6258.7 0
SMI 3 -6260.8 2.10
TEMP + SMIr 4 -6260.8 4.11
TEMP + SMIr + TEMP*SMIr 5 -6260.6 5.74
Figure 1.7: Relationship between the residual 9th primary length and the residual body
condition (i.e. accounting for the effects of year and date of capture on those two variables; see methods) in molting greater snow geese females on Bylot Island, NU. The dashed and full lines represent the regression for the best model including all years (n = 1383) and excluding year 2000 (n = 1312), a highly influential point.
DISCUSSION
Our study provides new insights on molt ecology in a high Arctic migratory species. In Anatidae, molt is the final step in the reproductive “cascade”. Our results suggest that change in molt phenology through a modification in the timing of molt is not an option when breeding at high latitude. Indeed, we found no support for the hypothesis that greater snow geese could adjust the timing of molt by reducing or increasing the interval between hatching and molting, as previously found in brant geese in Alaska (Singer et al. 2012). We showed that molt initiation date was directly related to previous reproductive events and to
the timing of snow-melt, a dominant factor governing nest initiation date in greater snow geese (Dickey et al. 2008). Interestingly, molt completion date was not related to those previous events. This adjustment was likely caused by a modulation in the speed of feather growth, which was highly variable among years and with a tendency to increase in late-nesting years.
Among the 22 years of data, we were unable to detect an increase in 9th primary length
during the banding period in 7 of them. Several factors may have contributed to that. First, the numbers of capture dates and the numbers of day between the first and the last day of capture varied among years. The absence of a significant relationship between 9th primary
length and date often occurred in years where the time span of banding was fairly short (e.g. 4 days), usually a consequence of field constraints due to poor weather, or when the measurements of birds were concentrated on few days (e.g. 1996, 1997, 1999 and 2010; Appendix 1). Second, our calculations assume that random samples of the local population are captured every day. However, geese are captured in flocks and the distribution of birds with respect to their hatching date may not always be random among those flocks. For instance, geese captured closer to the colony may have a higher proportion of late-hatching birds than those captured further away, and in years of low brood density, some catches were conducted closer to the goose colony (Fig. 1.1). Nonetheless, we noted that among the 15 years for which a significant relationship was found between 9th primary length and
date, the average growth rate was 7.13 mm/d, which is very similar to values found by Lindholm et al. (1994) in captive greater snow goose goslings (values ranging from 6.8 to 7.8 mm/days). This suggests that biases in the estimation of molt speed linked to our method were slight in most years.
A small reduction in the speed of feather growth as molt progresses had been shown in mallards (Anas platyrhynchos) by Pehrsson (1987) and in black brant by Taylor (1995). However, the magnitude of this effect was about ten times larger in our study (b1 = -0.06 mm/d per mm of feather) than in black brants (b1 = -0.007). Thus, this was not negligible and, contrary to Singer et al. (2012), we had to correct for it to infer molt initiation dates considering that geese were not measured exactly at the same stage of molt every year. We could correct for the decrease in growth speed of the ninth primary over the range of annual