IEEE TRANSACTIONS ON POWER SYSTEMS, VOL. 22, NO. 4, NOVEMBER 2007 2283
Distributed Undervoltage Load Shedding
Bogdan Otomega, Student Member, IEEE, Mevludin Glavic, Senior Member, IEEE, and
Thierry Van Cutsem, Fellow, IEEE
Abstract—A new design of load shedding against long-term
voltage instability is proposed. It uses a set of distributed con-trollers, each monitoring a transmission voltage, controlling a group of loads, acting in closed-loop, and adjusting its action to the voltage evolution. The whole system operates without information exchange between controllers.
Index Terms—Distributed control, system protection scheme
(SPS), undervoltage load shedding, voltage stability.
I. INTRODUCTION
I
T is well known that load shedding is a cost-effective coun-termeasure against long-term voltage instability triggered by large disturbances [1]. The time, location, and amount of shed-ding are three important and closely related aspects of this emer-gency action [2]. The most appropriate location and amount of shedding vary from one post-disturbance situation to another. However, these are not known at the time of taking this emer-gency action, and their identification from a real-time model of the system is beyond the current state-of-the-art, in addition to being too complex to meet the reliability requirement of a system protection scheme (SPS).The location issue can be dealt with by shedding first where voltages drop the most. Even if it leads to shedding some more load, this criterion makes sense in terms of reducing low voltage nuisance to customers. The amount issue can be addressed through closed-loop design enabling the protection to act several times, each action relying on the measured result of the previously taken actions [3].
Typical undervoltage load shedding schemes act in a prede-fined load area and rely on rules of the type
if during seconds then shed MW
where is the measured voltage, and and are fixed pa-rameters. Such a scheme cannot adjust to the disturbance loca-tion and severity. This letter proposes an alternative, decentral-ized scheme that offers this possibility.
II. PROPOSEDLOADSHEDDINGSCHEME
The proposed scheme relies on a set of distributed controllers covering the region prone to voltage instability. Each controller
Manuscript received January 29, 2007; revised May 1, 2007. Paper no. PESL-00013-2007.
B. Otomega and M. Glavic are with the Department of Electrical Engineering and Computer Science (Montefiore Institute), University of Liège, Sart Tilman B37, B-4000 Liège, Belgium.
T. Van Cutsem is with the Belgian Fund for Scientific Research (FNRS), De-partment of Electrical Engineering and Computer Science (Montefiore Insti-tute), University of Liège, Sart Tilman B37, B-4000 Liège, Belgium (e-mail: [email protected]).
Digital Object Identifier 10.1109/TPWRS.2007.907589
acts on a set of electrically close loads and monitors the voltage at a transmission bus located in the same area.
The decision by one of the controllers to shed load is based on the comparison of with a threshold value . If becomes smaller than , an amount of load power is shed after a delay . Both and depend on the dynamic evolution of , as detailed hereafter. The sequence is repeated until the voltage is restored above the threshold.
Let be the time where measurement becomes smaller than . A first block of load is shed at such that
with (1)
where is a constant to be adjusted, as explained in Section IV. The control law (1) yields an inverse-time characteristic: the deeper the voltage drop, the less time it takes for the integral to reach the value . Hence, the larger , the faster the shedding.
The amount of load shed at is given by
with (2)
where is another constant to be adjusted, and is the average voltage drop over the interval, i.e.,
(3)
Clearly, the larger , the larger and, hence, the larger the amount of load shed.
At the time a controller sheds load, the integral in (1) and (3) is reset to zero, to the current time, and the controller is ready to act again as long as , and provided that load is available to do so. This repeated action capability yields a closed-loop design, guaranteeing robustness against operation failures and uncertainties on load behavior.
The various controllers interact as follows.
When the controller monitoring bus sheds some load, this causes not only its voltage to increase but also the voltages at neighboring buses monitored by other controllers. Let be such a bus and be the corresponding controller. After has increased, the integral grows more slowly with time, thereby leading to a larger delay before acts. For the same reason, decreases and will shed less load. In other words, when one controller sheds load, this somewhat inhibits the agents that compete with him to restore voltages in the same area.
Furthermore, there will be a trend to shed first where volt-ages drop the most. This place changes from one disturbance to another. Hence, the scheme automatically adjusts the shedding location to the disturbance it faces.
Note that the controllers cooperate without resorting to a ded-icated communication network. The controllers do not exchange information but are informed of their respective actions through the system voltages themselves.
2284 IEEE TRANSACTIONS ON POWER SYSTEMS, VOL. 22, NO. 4, NOVEMBER 2007
Fig. 1. Monitored voltage and actions of controllerA at bus 1041.
Fig. 2. Monitored voltage and actions of controllerA at bus 1044.
III. ILLUSTRATIVEEXAMPLE
The proposed scheme has been tested on the Nordic32 test system [4]. The model includes 80 buses, 23 generators, and 22 loads. The latter behave as constant current (resp. impedance) for the active (resp. reactive) power. The long-term dynamics is driven by transformer load tap changers and generator overex-citation limiters.
The load area prone to voltage instability has been provided with five controllers. In this simple example, each of them trols the load on the distribution side of the transformer con-nected to its monitored bus.
The shown example corresponds to the tripping of two lines supplying the main load area. The unstable evolution of volt-ages at buses 1041 and 1044 (provided by quasi steady-state simulation) is shown with dotted lines in Figs. 1 and 2, while the heavy lines correspond to the system stabilized by the pro-posed scheme, for the shown value of .
In this example, controllers (at bus 1041) and (at bus 1044) responded to the disturbance. Their interaction can be seen from both figures, where the MW values refer to the power shed by the controller of concern while the circles indicate shed-ding by the other controller. As can be seen, the 64 MW shed by make the voltage at bus 1044 recover above , with the effect of resetting . Similarly, the voltage jump experi-enced when 72 MW are shed at bus 1041 postpones and reduces the first load shedding by .
Fig. 2 also illustrates the inverse-time behavior: the two hatched areas have the same surface ; hence, when voltage is lower, the delay before shedding is smaller.
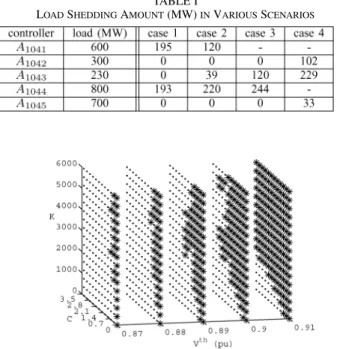
In order to illustrate the SPS robustness, Table I shows the power shed by each controller in various scenarios. Case 1 cor-responds to the simulation shown in Figs. 1 and 2. In Case 2, it is assumed that only 20% of the load is interruptible at bus 1041; this is compensated by a stronger action of and an intervention of . Case 3 simulates a failure of ; this is covered by a stronger action of and . Case 4 corre-sponds to failure of both and , taken over by
TABLE I
LOADSHEDDINGAMOUNT(MW)INVARIOUSSCENARIOS
Fig. 3. Performance of proposed scheme for different settings;C was set to 0.4p:u: 1 s and K to 4000 MW/p.u. in the case of Figs. 1 and 2.
and . Clearly, this redundancy among controllers makes the SPS more reliable.
IV. TUNING OF THESETTINGS
The bound in (1) prevents the controllers from reacting to voltage dips caused by faults (which have nothing to do with voltage instability) while the bound in (2) prevents un-acceptable transients [3]. By engineering judgement, they were set to, respectively, 3 s and 400 MW in the example.
Next, optimal values are sought for , , and . Our tests indicate that the same values can be used for all controllers without noticeable drop in performance. The values of , , and are merely discretized, and for each combination, the system response is simulated. The result of such a parametric study is shown in Fig. 3. The stars indicate that the post-distur-bance evolution was accepted, the criterion being that all volt-ages remain above 0.85 p.u. The dots indicate cases where this lower bound was transiently or permanently crossed. As ex-pected, the lower , the smaller and/or larger to save the system. is chosen low enough so that no load is shed following an acceptable disturbance, while and are chosen so that the total load shedding is minimal and some “margin” is left with respect to unacceptable settings.
V. CONCLUSION
A distributed design of undervoltage load shedding has been outlined. Besides being able to adjust to the disturbance loca-tion and severity, this scheme is robust with respect to behavior uncertainties and operation failures. This is obtained without re-sorting to a dedicated communication network.
REFERENCES
[1] C. W. Taylor, “Concepts of undervoltage load shedding for voltage sta-bility,” IEEE Trans. Power Del., vol. 7, no. 2, pp. 480–488, Apr. 1992. [2] T. Van Cutsem and C. Vournas, Voltage Stability of Electric Power
Sys-tems. Boston, MA: Kluwer, 1998.
[3] T. Van Cutsem, C. Moors, and D. Lefebvre, “Design of load shedding schemes against voltage instability using combinatorial optimization,” in Proc. IEEE Power Eng. Soc. Winter Meeting, New York, 2002. [4] CIGRE TF 38.02.08 (M. Stubbe, convenor), Long-Term Dynamics—