Hospital admission planning to optimize
major resources utilization under uncertainty
Nico Dellaert
Technische Universiteit Eindhoven, Faculteit Technologie Management, Postbus 513, 5600MB Eindhoven, The Netherlands
Jully Jeunet
CNRS, Lamsade, Université Paris Dauphine, Place de Lattre de Tassigny, 75775 Paris Cedex 16, France
Abstract Admission policies for elective inpatient services mainly result in the management of a
single resource: the operating theatre as it is commonly considered as the most critical and expensive resource in a hospital. However, other bottleneck resources may lead to surgery cancellations, such as bed capacity and nursing staff in Intensive Care (IC) units and bed occupancy in wards or medium care (MC) services. Our incentive is therefore to determine a master schedule of a given number of patients that are divided in several homogeneous categories in terms of the utilization of each resource: operating theatre, IC beds, IC nursing hours and MC beds. The objective is to minimize the weighted deviations of the resource use from their targets and probabilistic lengths of stay in each unit (IC and MC) are considered. We use a Mixed Integer Program model to determine the best admission policy. The resulting admission policy is a tactical plan, as it is based upon the expected number of patients with their expected characteristics. On the operational level, this tactical plan must be adapted to account for the actual arriving number of patients in each category. We develop several strategies to build an operational schedule that leans upon the tactical plan more or less closely. The strategies result from the combination of several options to create a feasible operational schedule from the tactical plan: overplanning, flexibility in selecting the patient groups to be operated and updating the tactical plan. The strategies were tested on real data from a Thoracic Surgery Centre over a 10-year simulation horizon. The performance was assessed by the average waiting time for patients, the weighted target deviations and some indicators of the plan changes between the tactical plan and the operational schedule. Simulation results show that the best strategies include overplanning, a limited flexibility and infrequent updates of the tactical plan.
Keywords: operation theatre planning, intensive and medium care resources allocation, patient mix, tactical plan, operational schedule, integer linear programming.
1. Introduction
Booked hospital admission strategies for elective inpatient services most often rely on the optimization of the operating theatre, as it is commonly considered as the most critical and expensive resource. For instance, Hans et al. [1] address the robust surgery loading problem which consists in assigning daily surgeries to operating rooms while minimizing the risk of overtime as durations of operation are uncertain. In addition to the operating room department, other references also consider the number of beds as a critical resource. Beliën and Demeulemeester [2] design a stochastic model to minimize the beds shortages under capacity constraints related to the number or operating rooms and to the allocation of specific numbers of blocks to each surgeon. References addressing the bed capacity problem in itself generally consider emergency admissions together with elective patient admissions. Ridge et al. [3] build a simulation model for bed capacity planning in Intensive Care, based on the queuing model logic. Utley et al. [4] develop methods to estimate the bed capacity required to minimize the number of cancellations of booked elective patients.
Other references consider more resources like Guinet and Chaabane [5] who design a model for minimizing the hospitalizations costs including the resource overloads. The objective is to assign patients to operating rooms so as to minimize costs while satisfying the equipment and staffing constraints. Adan and Vissers [6] develop a model to generate a planning and mix of patients that minimize the deviations between resources consumption and their targets. The number of beds in the medium-care unit, the operating theatre capacity as well as the nursing hours and the number of beds available in the intensive care unit are all critical resources in this model. In the same vein, Vissers, Adan and Dellaert [7] consider a similar problem with additional restrictions in planning some combinations of patients and availability of resources. In this contribution, lengths of stay both in the medium and intensive care units are now assumed to be stochastic. The three above-mentioned references focus on planning issue at a tactical level, i.e. the mix of patients to be admitted within a medium term horizon (2 to 4 weeks, for instance).
The present paper pursues the work of Vissers et al. [7] by developing several strategies to determine the best scheduling of individual patients on an operational level. These strategies lean upon the admission policy on a tactical level that results from the application of the model of Vissers et al. [7]. The focus here is on the operational level, with the aim of assessing the usefulness of the planning at the tactical level to build the scheduling strategies.
The tactical plan is based on average arrivals of patients whereas operational strategies have to treat actual arrivals that obviously deviate from average. To deal with these random deviations some flexibility is necessary that can be created in different ways, for instance by regularly recalculating the patient mix, or by replacing patients from one group by patients from another group, or by creating some safety slack by initially overestimating the number of patients. We will again use the setting of the Thorax Centre Rotterdam to compare and to test the different operational strategies developed here.
The remainder of the paper is organized as follows. Section 2 describes the case study setting and ends with the research questions to be answered. Section 3
provides the mathematical model used to obtain the planning of patients on a tactical level. Section 4 explains the strategies implemented to obtain operational schedules of patients. The performance criteria used to assess each strategy also are described here. Numerical experiments are presented and discussed. Section 5 draws some conclusions and formulates recommendations for further work.
2. Case study setting
The patient flow of the Thorax Centre Rotterdam consists of scheduled patients (elective patients from the waiting list) and emergency patients requiring immediate surgery. We only take into account elective patients for a classical reservation policy is adopted for emergency patients.
Patients are usually admitted to the Medium Care unit (MC) one day before operation unless they come from another department of the University Hospital. After the operation they stay for some days in an Intensive Care unit (IC) and after recovery they may stay in the Medium Care unit (MC) for a few days. The current tactical planning in the Thorax Centre has a strong focus on the operating theatre (OT) capacity. However, this planning may be improved by also taking into account all other critical resources involved. To this purpose, a cyclical schedule has been developed on a tactical level based upon average numbers of patients for the various groups. The corresponding mathematical model to obtain such a tactical schedule will be presented in the next section.
2.1 Patient groups, volumes and demand requirements
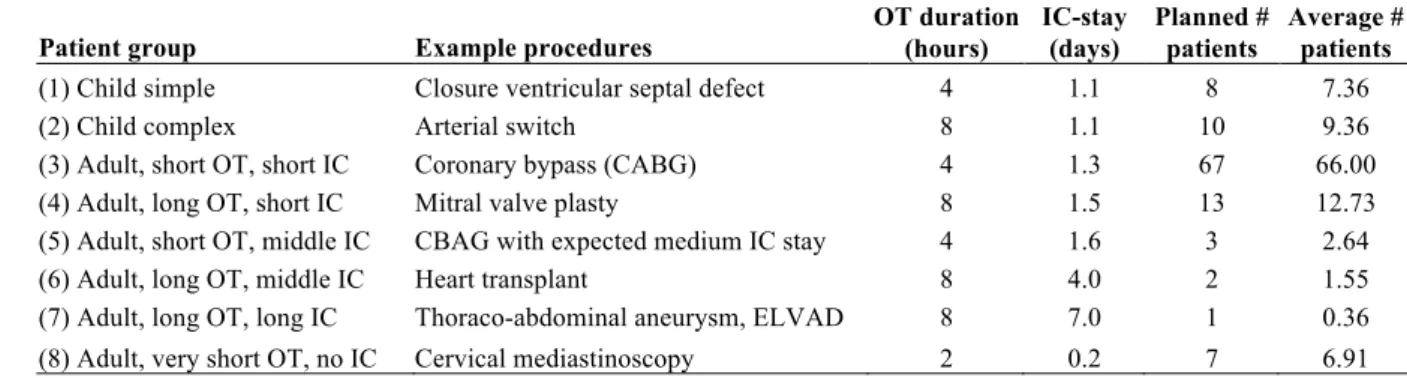
Patients have been grouped in several categories, each of these being relatively homogeneous in terms of consumption of OT and IC resources. Table 1 provides information on the patient groups considered, the expected duration of the operation for each group, the average length of stay at the IC (outliers excluded), and the average number of patients per group to be operated within a 4-week horizon.
Patient group Example procedures OT duration (hours)
IC-stay (days) Planned # patients Average # patients
(1) Child simple Closure ventricular septal defect 4 1.1 8 7.36
(2) Child complex Arterial switch 8 1.1 10 9.36
(3) Adult, short OT, short IC Coronary bypass (CABG) 4 1.3 67 66.00
(4) Adult, long OT, short IC Mitral valve plasty 8 1.5 13 12.73
(5) Adult, short OT, middle IC CBAG with expected medium IC stay 4 1.6 3 2.64
(6) Adult, long OT, middle IC Heart transplant 8 4.0 2 1.55
(7) Adult, long OT, long IC Thoraco-abdominal aneurysm, ELVAD 8 7.0 1 0.36
(8) Adult, very short OT, no IC Cervical mediastinoscopy 2 0.2 7 6.91
Table 1. Patient groups, operation duration, length of stay and 4-week numbers
2.2 Length of stay
We use a stochastic length of stay for IC and MC, based on empirical data of 2006 including a sample of 576 patients. Table 2 provides information on the length of stay distribution at the IC for each patient group. For instance, any patient of category 8 has 79% chance to stay zero day in IC.
Probability of length of stay IC (days)
Patient group 0 1 2 3 4 5 6 7 8 9 10
(1) Child simple 0.07 0.87 0.02 0.02 0.02 0 0 0 0 0 0
(2) Child complex 0 0.90 0.08 0.02 0 0 0 0 0 0 0
(3) Adult, short OT, short IC 0.01 0.83 0.11 0.03 0.01 0.01 0 0 0 0 0 (4) Adult, long OT, short IC 0 0.83 0.10 0.04 0 0.01 0.01 0 0 0 0.01 (5) Adult, short OT, middle IC 0 0.79 0.07 0.07 0 0 0 0.07 0 0 0 (6) Adult, long OT, middle IC 0 0 0.14 0.44 0.14 0.14 0 0 0.14 0 0
(7) Adult, long OT, long IC 0 0 0 0 0 0 0 1 0 0 0
(8) Adult, very short OT, no IC 0.79 0.21 0 0 0 0 0 0 0 0 0
Table 2. Length of stay distribution at IC per patient group
Table 3 displays the same information type for the MC.
Probability of length of stay post-op MC (days)
Patient group 0 1 2 3 4 5 6 7 8 9 10 >10
(1) Child simple 0.74 0 0 0 0.02 0.1 0.07 0.05 0.02 0 0 0
(2) Child complex 0.83 0 0 0 0 0 0.04 0.04 0.02 0.02 0 0.05
(3) Adult, short OT, short IC 0 0.01 0.01 0.04 0.32 0.24 0.12 0.09 0.05 0.03 0.04 0.05 (4) Adult, long OT, short IC 0.03 0 0 0.01 0.12 0.16 0.18 0.15 0.10 0.04 0.04 0.17 (5) Adult, short OT, middle IC 0 0 0 0 0.07 0.07 0.07 0.20 0 0.20 0.20 0.19
(6) Adult, long OT, middle IC 0 0 0 0 0 0 0 0.14 0 0 0.14 0.72
(7) Adult, long OT, long IC 0 0 0 0 0 0 0 0 0 0 1 0
(8) Adult, very short OT, no IC 0.21 0.3 0.08 0.15 0.13 0.05 0 0.05 0 0.03 0 0
Table 3. Length of stay distribution at MC per patient group
2.3 Available resources
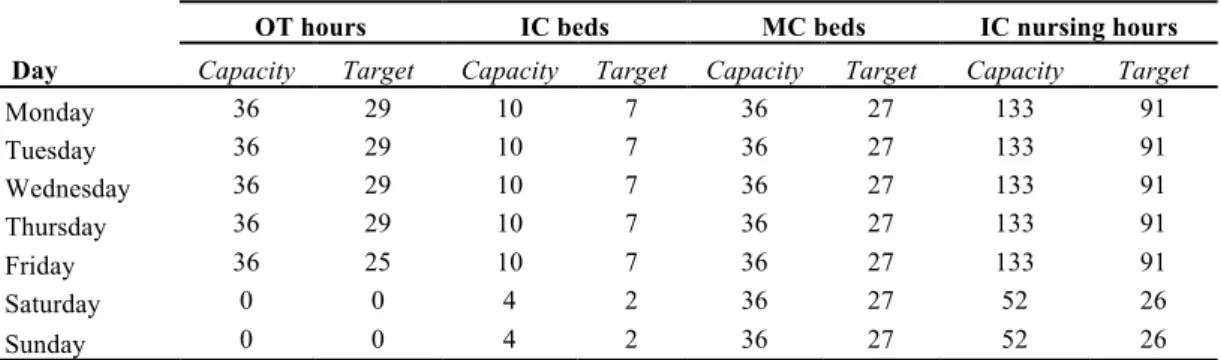
For each of the resources, there exists a maximum available capacity per day and a target utilization level. This data is displayed in Table 4 for each day and each resource. Defining a level of utilization lower than 100% allows for dealing with emergencies and fluctuations in number of patients. The data apply to every week in the 4-week planning cycle.
OT hours IC beds MC beds IC nursing hours Day Capacity Target Capacity Target Capacity Target Capacity Target
Monday 36 29 10 7 36 27 133 91 Tuesday 36 29 10 7 36 27 133 91 Wednesday 36 29 10 7 36 27 133 91 Thursday 36 29 10 7 36 27 133 91 Friday 36 25 10 7 36 27 133 91 Saturday 0 0 4 2 36 27 52 26 Sunday 0 0 4 2 36 27 52 26
Table 4. Available resources
Four operating theatres are available nine hours per day. From the total of 36 hours of capacity available per day, 29 hours are allocated to electives while the rest is reserved for emergencies. On fridays, the target utilization is lower. The IC unit has 10 beds available throughout the working week and 4 beds during the weekend. The target utilization level for the IC is set to 7 beds for electives
patients throughout the working week and to 2 beds during the weekend. The MC has 36 beds available every day and the target utilization by electives is 27 beds throughout the whole week. The available IC nursing staff and target utilization of the IC nursing workload (in number of hours per day) is matched with the number of IC beds. The targets for IC-beds, MC-beds and IC-nursing are defined at a lower level compared to the target for OT hours, to deal with fluctuations in the number of patients.
The IC nursing hours (NH) required per day for patients of categories 1 to 7 are estimated to 12 hours throughout their stay in the IC unit unless for the second day in IC and for categories 5, 6 and 7 for which the needs are 24 hours. For category 7 there is also a need of 24 hours on day 3. Patients from category 8 only require 3 hours of IC nursing per day whatever their length of stay in IC. The importance of each resource has been assessed by the stakeholders in the hospital who decided to allocate to each of them a certain absolute weight denoted by
€
ar, with
€
r = ot,ic,nh,mc
{
}
. Relative weights will be employed to evaluate the cost of deviating from the target utilization level. The relative weight€ αr for resource r is defined as € αr= ar Rr, j j=1 T
∑
ar Rr, j j=1 T∑
r= ot,ic,nh,mc{ }∑
, (1) Where €Rr, j is the target resource utilization for resource r in period j. These values can be read in Table 4. For instance
€
Rot,5= 25. Table 5 provides the absolute and relative weights for each resource.
Resource r Absolute weight
€ ar Relative weight € αr OT hours 8 0.167 IC beds 10 0.756 MC beds 3 0.047 IC nursing 5 0.029
Table 5. Absolute and relative weights per resource
2.4 Research questions
In the tactical planning we make a reservation of the resources for a fixed number of patients from the various groups to be treated during a cycle. However, if the
average number of arriving patients is equal to the maximum number that can be
treated, the system may become instable in the end as the variance is obviously not zero. For the operational planning we will consider several options to create feasibility: overplanning, flexibility in patient groups and periodic updates of the tactical plan. Our incentive is to determine which combinations of these strategies (overplanning, patient flexibility and updating) lead to the best schedule of
electives in terms of waiting times for patients, in terms of deviations between the resources consumption and the target utilization and in terms of schedule changes for the operating specialists.
3. Problem formulation and mathematical model
for the tactical planning
In this section we formulate the tactical planning problem as a mixed integer linear program. Let N be the number of patient categories and T the length of the cyclic operation schedule (N=8 and T=28 in the Thorax Centre problem). On each day of the operation schedule we have to decide on the number and mix of patients to be operated. Hence, the decision variables are Xc,t denoting the number
of patients from category c operated on day t of the operation schedule, where c =
1, 2, …, N and t = 1, 2, …, T. The objective is to determine the variables Xc,t
satisfying certain constraints and for which the expected utilization of all resources matches the target as close as possible. Over-utilizations and under-utilizations relative to the targets are identically penalized, as decided by the Thorax Centre. Hereafter we first formulate the constraints on the decision variables Xc,t and then the objective function.
The total number of patients of group c to be operated over the T-day cycle should be equal to the target patient throughput Pc which values are displayed in
the penultimate column of Table 1 (planned number of patients). Hence
€ Xc,t t =1 T
∑
= Pc, c = 1,...,N. (2)To describe the constraints for the utilization of the resources we introduce the parameters Cr,t and Rr,t indicating the available capacity and target utilization,
respectively, for resource r on day t, where
€
r = ot,ic,mc,nh
{
}
. These values are given in Table 4. Let the auxiliary variables Ur,t and Or,t denote the under- andover-utilization (with respect to the target). Then we get for the utilization of operating theatre
€
Rot,t−Uot,t ≤ sc
c=1 N
∑
Xc,t ≤ Rot,t + Oot,t, t = 1,...,T , (3)where sc denotes the operation time dedicated to a patient of category c (see Table
1, third column). To formulate the constraints for the expected utilization of the IC unit we introduce the notation pic,c,t denoting the probability that a patient from
category c is (still) at the IC unit t days after operation, t = 0, 1, 2, …,
€
Lmaxic where
€
Lmaxic is the maximum length of stay recorded in IC over all categories (the
probability values are displayed in Table 2 and we have
€
Lmaxic
= 10). Then the expected utilization of the IC unit should satisfy
Ric,t−Uic,t ≤ pic,c, j j =0 Lmaxic
∑
c=1 N∑
Xc,t− j ≤ Ric,t + Oic,t, t = 1,...,T . (4)In the above constraints we used the convention that the subscript t-j in Xc,t-j
should be treated modulo T: day 0 is the same as day T, day -1 is the same as day
T-1 and so on. If wc,t denotes the IC nursing load (in hours) required for a patient
of category c t days after operation, then we get for the expected nursing workload
€ Rnh,t−Unh,t ≤ wc,tpic,c, j j =0 Licmax
∑
c=1 N∑
Xc,t − j ≤ Rnh,t + Onh,t, t = 1,...,T . (5)Similarly, for the expected utilization of the MC unit we get
€ Rmc,t−Umc,t ≤ Xc,t+ j j=1 lc
∑
c=1 N∑
+ pmc,c, j j=0 Lmc max∑
c=1 N∑
Xc,t− j ≤ Rmc,t+ Omc,t, t = 1,...,T , (6)where lc is the number of pre-operative days at the MC for category c and pmc,c,t is
the probability that a patient from category c is at the MC unit t days after operation, t = 0, 1, 2, …,
€
Lmaxmc (see Table 3). Further, for each of the resources, the
available capacity should not be exceeded, so
€
Rr,t + Or,t ≤ Cr,t, r = ot,ic,nh,mc
{
}
, t = 1,...,T . (7)In addition to the constraints for the utilization of the resources we have to take into account restrictions valid for specific days of the operation schedule. If the number of operations for certain categories of patients is prescribed and fixed on certain days, then the corresponding variables Xc,t are simply upper bounded
accordingly. If the number of operations for certain combinations of patient categories is limited, then we have to require that
€
Xc,t
c∈S
∑
≤ Bt, t = 1,…,T , (8)where S is a subset of the patient categories and Bt denotes the maximum number
of patients from the categories c ∈S that can be operated on day t of the
operation schedule.
The objective is to minimize the weighted sum of under- and over-utilization,
€ αr r∈Ω
∑
(
Ur,t + Or,t)
t=1 T∑
, (9)where the relative weight
€
αr for resource r is defined as in equation (1). Our
planning problem therefore consists in minimizing the objective function in (9) subject to constraints (2) to (8) and the integrality constraint
€
Xc,t ∈ 0,1,2,…
{
}
, c = 1,…,N, t = 1,…,T , (10)The resultant mixed integer program is implemented in C language and linked with ILOG CPLEX 9.0 as a callable optimization library. Solving the deterministic version of the model to optimality did not take much computation time, but the stochastic model could not be solved to optimality. After 24 hours of computation time, there is still a 12 percent optimality gap.
4. The operational schedule
If the average number of arriving patients is close to the maximum number that can be treated, the system will become instable in the end. One solution is to create a security slack by reserving capacity for more patients than the average. This overplanning strategy consists in increasing the target throughput of patients on the basis of which the tactical plan is derived. As an additional measure, we can allow the replacement of patients from one group by patients from another group to avoid unused capacity in some days. An alternative is to make a new tactical plan regularly, either every 3 months or every year, and build the operational schedule on the basis of a number of required patients depending partly on the expected number of patients and partly on the waiting list of patients. These strategies are further described and illustrated in the next section.
4.1 The strategies
The strategies we will consider to build the operational schedule consist of different options for overplanning, patient flexibility and rescheduling. For the sake of illustration, let us consider 3 categories of patient (for instance, categories 3, 4 and 5 of the Thorax Centre problem) over a cycle of 7 days. Table 6 provides the optimal tactical plan corresponding to that problem.
Planned admission over a 7-day cycle
Patient group 1 2 3 4 5 6 7
Planned # patients
Average # patients
(3) Adult, short OT, short IC 5 4 0 4 0 0 7 20 19.85
(4) Adult, long OT, short IC 1 1 2 1 0 0 0 5 4.72
(5) Adult, short OT, middle IC 0 1 3 0 0 0 0 4 3.64
Table 6. Example of an optimal tactical plan
Overplanning. We consider two possibilities for the amount of planned patients in
the tactical plan:
P1. Plan the minimum amount of patients per group (no overplanning).
P2. Plan the amount of patients per group in such a way that less than 5 percent of the patients have to wait more than one cycle. For determining this amount, we calculate the steady state probabilities in a simple queuing model.
In the Thorax Centre problem, option (P1) simply consists in calculating the tactical plan on the basis of the initial P-value, with P={8,10,67,13,3,2,1,7} (see Table 1, penultimate column). Option (P2) results in the computation of the tactical plan using P={9,11,70,15,4,3,2,9}.
Flexibility. For a better operational use of the reserved capacities emanating from
the tactical plan, we consider three options:
F1. No flexibility. We follow the tactical plan unless the number of actual arriving patients is inferior to the planned number. In the latter case, the operation is cancelled.
F2. Full flexibility. If some patients are planned on a certain day (i.e. the number of planned patients in the tactical plan is not zero), we use the reserved
capacities to schedule the actual arriving patients with the longest waiting times. This means that some planned categories can be cancelled and replaced by others with a longest queue.
F3. Partial flexibility. Amongst the categories that are planned, we replace each category with no actual arriving patient with another planned category for which there are actual arriving patients. The selected category for replacement is the one for which the product of the number of planned patients by the number of arrivals is maximum. This avoids the cancellation of some operations that would result from a lack of patients. Contrary to the previous flexibility option, a category that is not planned in the tactical plan can not be scheduled.
To illustrate the no-flexibility option (F1), let us consider the planned numbers of patients on day 3 in the tactical plan of Table 6. These planned numbers are {0,2,3} for the 3 categories. An actual arriving number of patients equal to {1,0,4} would lead to a stream of scheduled patients: {0,0,3}. The arriving patient of the first category is not considered as no patient of that category was planned on that day. No patient of the second category is scheduled although we planned to operate 2 of these patients, since there is no actual arriving patient of this category. Only 3 of the 4 arriving patients are scheduled as 3 patients are planned so we follow the tactical plan to avoid exceeding capacities.
To illustrate the full flexibility option (F2), let us consider the planned number in the tactical plan on day 1: {5,1,0}. While treating each category, the waiting time of each group is measured and the category with the highest waiting time is selected, leading to a stream of scheduled patients: {2,2,2}. Such a schedule is definitely different from the tactical plan that was notably suggesting not to operate patients of the third category.
Consider again the planned number of patients on the first day: {5,1,0} and assume the actual arriving patients are equal to {10,0,1}. Under the partial flexibility option (F3), the second category for which there is no actual patient is replaced with the first category but could not have been replaced with the third group as it is not in the tactical plan. Thus, (F3) leads to a scheduled stream of patients: {6,0,0} whereas the no flexibility option would have resulted in the schedule: {5,0,0}. The full flexibility option could produce the stream: {4,1,1}.
Updating. To update the tactical plan, we replace part of the expected number of
patients with the actual number of patients in queue. Updated values of target throughputs for each category,
€
Pc', are computed according to
(11)
where
€
λc is the average number of patients (see last column in Table 1) and
€
{Pc0}
c=1..N is the initial stream of target throughput values (overplanned values
under option P2 or regular values under option P1). We thus compute a tactical plan on the basis of these new target throughput values for patients. We consider 3 frequencies of updating:
U1. Compute a new tactical plan with updated values Pc' every 3 cycles
U2. Update the numbers and the tactical plan every year U3. Do not update
€ Pc ' = round 11 12λc+ 1 6round(λc) + 1 3(Pc 0 −λc) , c = 1,...,N,
Combining the two options for the overplanning, the three options for flexibility and the 3 updating possibilities leads to 18 different strategies for which we will compute several performance criteria.
4.2 Performance criteria
The performance of an operational schedule will be assessed by the weighted sum of deviations as defined in Eq. (9). To compute the consumption of resources associated to such a schedule, we will use the actual length of stay of each patient, rather than using the expected length of stay we considered in the tactical plan. The average waiting time for the patients will also be used as a performance indicator of the operational schedule. Under a FIFO assumption the average waiting time over a cycle is defined as the difference between the total number of arriving patients and the total number of scheduled patients divided by the number of periods in a cycle (cycle length). Note that in a hospital usually an additional component of waiting time has to be introduced to account for the period that patients have to be notified. This period is usually one week. In our performance measure we will not include this period.
We consider 4 indicators of the scheduling differences between the operational plan and the tactical plan. Recall that
€
Xc,t designates the number of patients of category c in the tactical plan on day t. We let
€
Yc,t be the equivalent in the
operational schedule. Indicator C measures the number of cancelled operations of any category over a cycle. If
€
Xc,t > 0 and if
€
Yc,t < Xc,t, the number of cancellations
of patients of category c on day t equals
€
Xc,t − Yc,t. Indicator C sums up the daily
cancellations if any, over a cycle. Indicator CS gives the number of cancelled categories over a cycle. If
€
Xc,t > 0 and if
€
Yc,t = 0 then CS is increased by 1. Conversely, indicator I measures the increase number of patients for a category over the planned amount. If
€
Xc,t > 0 and
€
Yc,t > Xc,t then I is increased by
€
Yc,t− Xc,t. At last, indicator IS provides the number of unplanned categories. If
€ Xc,t = 0 and € Yc,t > 0 then IS is increased by € Yc,t.
A straightforward indicator to measure the differences between two tactical plans if we use the updating options is the number of new days in which operations are programmed. If, in a previous plan, we had
€
Xc,t = 0 and if we have
€
Xc,t > 0 in the new plan, then the number of plan changes is increased by 1.
4.3 Numerical experiment
We ran the 18 combinations of strategies over a simulation horizon of 10 years. Arrival of patients was simulated through a Poisson process. For each scheduled patient, we drew an actual IC stay and MC stay according to the empirical distributions that were obtained from the hospital and described in Tables 2 and 3. Each tactical plan was obtained by running Cplex and we stopped the optimization process after the 7th best integer solution found so as to limit the computation time. Simulation results are displayed in Table 7. For each combination of strategies, Table 7 provides the associated values of the performance indicators as described in the previous subsection. In addition, we compute a global indicator of the plan changes which is the weighted sum of the 5
indicators of plan changes and the target deviations with the following weights {2,10,1,5,4,10} for IS, I, CS, the average number of plan changes and the target deviations respectively. The resultant index is called “global volatility” and appears in the penultimate column of Table 7.
Update Indicators of plan change
Average # plan Weighted target Global Average waiting Over-planning Flex. Freq. IS I CS C changes deviation volatility time
1. No Overplan. No No 0 0 3.37 2.05 0 53.51 548.72 25.11
2. No Overplan. No Year 0 0 4.44 2.34 22.78 54.25 649.76 18.73
3. No Overplan. No Quarter 0 0 4.4 2.42 20.58 56.85 667.32 14.28
4. No Overplan. Partial No 0 6.1 4.01 5.37 0 54.77 639.56 9.66
5. No Overplan. Partial Year 0 4.19 5.06 2.98 21.22 54.43 691.04 12.43 6. No Overplan. Partial Quarter 0 4.97 4.31 3.14 19.61 54.63 694.45 11.66
7. No Overplan. Full No 36.17 10.35 15.63 20.32 0 71.51 1008.17 6
8. No Overplan. Full Year 36.84 10.25 17.2 19.15 19.78 72.03 1088.55 8.66 9. No Overplan. Full Quarter 36.42 10.68 17.89 19.24 18.48 69.65 1064.15 8.81
10. Overplan. No No 0 0 8.89 5.5 0 59.97 636.09 8.89
11. Overplan. No Year 0 0 9.2 3.56 15.89 58.54 675.96 10.65
12. Overplan. No Quarter 0 0 8.36 3.45 14.12 57.8 660.09 9.92
13. Overplan. Partial No 0 16.69 14.12 15.14 0 69.3 949.72 3.71
14. Overplan. Partial Year 0 13.04 10.96 9.01 16 60.65 856.91 4.96 15. Overplan. Partial Quarter 0 14.08 12.58 10.66 15.48 66.93 937.9 4.21 16. Overplan. Full No 25.15 18.56 28.66 18.77 0 74.32 1101.61 2.53
17. Overplan. Full Year 30.42 16.82 26.1 17.76 13.78 69.94 1098.46 3.02
18. Overplan. Full Quarter 29.58 16.53 25.45 18.49 11.06 68.49 1071.5 3.02 Table 7. Performance of the 18 strategies
From Table 7, it appears that the average waiting time clearly improves with more flexibility. Under the full flexibility option, the waiting times are minimum, since this option precisely consists in scheduling in priority the categories with the highest waiting times. Introducing more flexibility however has a negative impact on the weighted target deviations. Without any flexibility the lowest target deviations values are obtained, as we stick as closely as possible to the tactical plan that seeks to minimize the deviations. An increasing flexibility is obviously associated to higher values for the plan changes indicators, as exhibited by the numbers in the columns 4-8 of Table 7.
Overplanning the number of patients leads to a clear reduction in the average waiting times, as the volume of planned patients is increased whereas the same number of patients still arrives. On a global basis, overplanning has little influence on the target deviations, unless under the partial flexibility option for which overplanning is detrimental to the deviations. The indicators of plan changes are roughly higher under overplanning, possibly because with more patients there also are more possibilities of canceling and adding unplanned patients.
The simulation results also shows that, at least in the stationary demand situation that we considered, updating the tactical plan does not contribute to a better performance and only makes the schedule of the operating specialists more uncertain as indicated by the values of the average number of plan changes (see the penultimate column in Table 7).
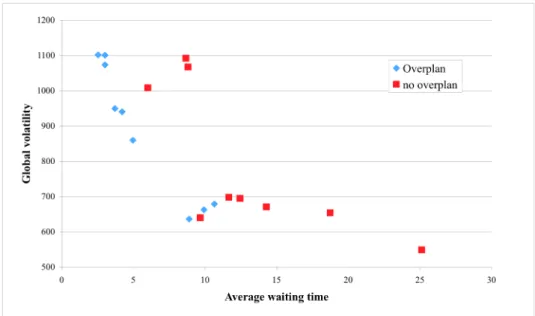
From these results, some dominant strategies appear in bold numbers in Table 7, with respect to the global volatility and the average waiting time. These strategies are plotted according to these 2 dimensions in Figure 1.
Figure 1. Weighted target deviation versus average waiting time
The dominant strategies correspond to a limited flexibility and infrequent updating as most of them include no or partial flexibility and no update or a yearly one. The overplanning option is included in almost all the dominant strategies. By increasing the number of planned patients we can decrease the average waiting time in a more efficient way than by calculating a different tactical plan.
5. Conclusions and recommendations
In many organizations, the capacity planning is based upon standard durations for the different process phases: surgery, IC and MC stay. Vissers et al [8] have considered such a deterministic approach to determine the optimal patient mix for a cardiothoracic surgery department. In this paper we have extended their model, by considering the operational planning for the operations theatre and the subsequent stay in the IC unit and in the MC unit. Based upon a big sample of patients of a Dutch cardiothoracic surgery department, we created an empirical distribution for the durations of the IC phase and the MC phase and used this in our mixed integer linear programming model, leading to a cyclic master operation schedule minimizing weighted deviations between realized and targeted resource use. This master schedule was used at the operational level to assign patients to operating slots. In order to make the operational plan feasible we considered options like overplanning, patient flexibility and rescheduling the tactical plan based upon the waiting list. The simulation results showed that updating the tactical plan was not very efficient. It also showed that deviating too much from the tactical plan leads to inefficient resource use. This enhances the need of a good tactical plan as a basis to build an effective operational schedule. It should also be noted that the improvement of the average waiting time for patients by implementing flexibility strategies also degrades the weighted target deviation.
The trade-off between these 2 dimensions must therefore be considered. Further future work is to look at the reservations policies for emergency admissions.
References
1. Hans, E., Wullink, G., van Houdenhoven, M., Kazemir, G., 2008. Robust surgery loading. European Journal of Operational Research, 185 (3), 1038-1050.
2. Belien, J., Demeulemeester, E., 2007. Building cyclic master surgery schedules with leveled resulting bed occupancy. European Journal of Operational
Research, 176, 1185-1204.
3. Ridge, J., Jones, S., Nielsen, M., Shahani, A., 1998. Capacity planning for intensive care unit. European Journal of Operational Research, 105, 346-355. 4. Utley, M., Gallivan, S., Treasure, T., Valencia, O, 2003. Analytical methods for
calculating the capacity required to operate an effective booked admissions policy for elective inpatient services. Health Care Management Science, 6, 97-104.
5. Guinet, A., Chaabane, S., 2003. Operating theatre planning. International
Journal of Production Economics, 85, 69-81.
6. Adan, I., Vissers, J., 2002. Patient mix optimisation in hospital admission planning: a case study. International Journal of Operations and Production
Management, 22, 445-461.
7. Vissers, J., Adan, I., Dellaert, N., 2007. Developing a platform for comparison of hospital admission systems: An Illustration. European Journal of
Operational Research, 180, 1290-1301.
8. Vissers, J., Adan, I., Bekkers, J., 2005. Patient mix optimization in cardiothoracic surgery planning: a case study. IMA Journal of Management
Mathematics, 16, 281-304.