1
Stock market liquidity and the rights offer paradox
Edith Ginglinger, Laure Koenig and Fabrice Riva* Université Paris-Dauphine, DRM
January 2009
Abstract
This paper contributes to the resolution of the rights offer paradox, using a database of French SEOs. We first document higher direct flotation costs, but also improved stock market liquidity after public offerings and standby rights relative to uninsured rights. We find that blockholder renouncements to subscribe to new shares and stock market liquidity are important determinants of flotation method choice. After controlling for endogeneity in the choice of flotation method, we find that public offerings are cost effective and more liquidity improving than standby rights whereas an uninsured rights offering is the best choice for low liquidity, closely held firms. Our results provide new insights as to why firms choose public offerings despite apparently higher costs.
Keywords: Security offering, SEO, flotation method, flotation costs, rights issues, public offerings, liquidity, bid-ask spread
JEL Classification : G32
* DRM, Université Paris-Dauphine, place du Maréchal de Lattre, 75775 – Paris cedex 16 – Edith.Ginglinger@dauphine.fr, Fabrice.Riva@dauphine.fr, Laure.Koenig@dauphine.fr. This research benefited from the support of the « Fédération Bancaire Française Chair in Corporate Finance ».
2 1. Introduction
The rights offer paradox, first observed by Smith (1977), highlights that large US firms use the more costly underwritten flotation method rather than rights offerings to conduct SEOs. This observation is not restricted to U.S. offerings. Several authors document a trend away from rights in other countries (Eckbo, Masulis and Norli, 2007). However, even if their direct costs are by far the lowest, rights issues may incur indirect costs that could make their total costs larger for some issuers. In this paper, we focus on liquidity as an indirect cost of rights issues. We study the French market where firms can choose among three major SEO flotation methods: uninsured rights, standby rights and public offerings. We examine interactions between market liquidity, flotation costs and the flotation method choice. We make three contributions to understanding the rights offer paradox. First, we document that flotation costs decrease with market liquidity for public offerings. Second, we observe liquidity improvements after SEOs vary according to flotation method, and find that uninsured rights issues have the least favorable effect on liquidity. Third, we find that besides blockholders’ takeup, liquidity is a major determinant of the flotation method choice. Low liquidity firms prefer uninsured rights to avoid large underwriting fees. Our analysis suggests that accounting for endogeneity in flotation method choices is important in measuring their effect on costs and liquidity. After controlling for endogeneity, we find that public offerings are less expensive and improve liquidity more than standby rights whereas uninsured rights are still the best choice for low liquidity, closely held firms.
Liquidity is an important factor for investors and managers investment decisions. Illiquid assets must deliver higher returns to compensate investors for the higher trading costs they incur (Amihud and Mendelson, 1986). The empirical evidence confirms that firms’ required rates of return significantly relate to various liquidity proxies, such as spreads (Chalmers and Kadlec, 1998), turnover rates (Datar et al., 1998), and adverse selection costs (Brennan and Subrahmanyam, 1996). In addition, a recent strand of the literature (Acharya and Pedersen, 2005, Pastor and Stambaugh, 2003) argues that liquidity itself is a source of risk. To the extent that liquidity is reflected in prices, liquidity is also an important determinant of the cost of capital (Amihud and Mendelson, 1986, 1989).
Examining the link between SEOs flotation costs and liquidity is a different way to test whether liquidity matters to firms. Butler, Grullon and Weston (2005) find that SEO investment bank fees are substantially lower for firms with more liquid stocks. Altinkilic (2001) focuses on underwriters’ market making and finds that on average it represents 20% of
3 flotation costs. However, market making costs vary with liquidity. Altinkilic (2001) finds that for the most liquid issuing firms, there is little compensation for market making present in the spread. In contrast, for the less liquid issuing firms, a third of the lead bank’s compensation is to cover market making activity.
Neither Butler et al (2005), nor Altinkilic (2001) consider rights issues. Uninsured rights typically do not benefit from market making activities. In standby rights, issuers hire underwriters who provide market making on both rights and shares markets. However, large discounts inherent in rights issues and high current shareholder subscription rates make market liquidity a less important factor for underwriters. Therefore, low liquidity firms may switch to rights issues whose costs are less sensitive to liquidity.
We examine whether a lesser improvement in liquidity may be an indirect cost of rights issues. Several U.S. papers have studied the effect of fully underwritten offerings on stocks’ secondary market liquidity.1 Lease, Masulis, and Page (1993) find significant increases in trading volume and the daily number of trades and decreases in bid-ask spreads following equity offerings and Denis and Kadlec (1994) find significant increases in share turnover, the daily number of trades, and the fraction of days with trading of shares. Tripathy and Rao (1992) find that bid-ask spreads narrow after equity offerings, but the degree of reduction and the timing differ depending on firm size. None of these studies investigate whether the impact of SEOs on liquidity depends on flotation method, but Kothare (1997) documents that bid-ask spreads widen after rights issues and narrow after public offerings, effects she ascribes to the fact that ownership becomes more diffuse after public offerings and more concentrated after rights issues. However, her results may be driven by the large proportion of financially-distressed firms in her sample. Qian (2005) compares liquidity changes associated with public offerings to liquidity changes after private placements on the NYSE, Amex and Nasdaq. He finds that the stock of issuing firms becomes more liquid after a public offering, whereas there is no change in liquidity after a private placement. Outside the U.S., Gardängen (2006) analyzes the effect of rights issues on stock liquidity on the Stockholm Stock Exchange where rights are predominant and finds no evidence of a change in liquidity after rights issues.
We argue that ex ante liquidity is a major determinant of the flotation method choice. Myers and Majluf (1984) and Eckbo and Masulis (1992) argue that firms decide to issue equity when the net present value of investment exceeds the cost of issuing equity. A low liquidity firm that chooses a public offering will incur large costs because market making is costly for underwriters. Underwriters will be more cautious in assessing the demand for the
4 stock and more reluctant to underwrite the issue. If the flotation costs prove to be too high, managers will cancel the issue. The probability and cost of a SEO cancellation are important components of expected flotation costs.2 We argue that when a public offering is expected to be too costly, managers may shift to another flotation method, standby rights or uninsured rights.
Kothare (1997) does not directly examine the impact of liquidity on the choice of a flotation method. However, in her Table 1, although rights offering firms are benchmarked to public offering firms with closest market capitalization in the same year, the proportionate spread is 0.1131 for rights issuance whereas the proportionate spread is 0.0719 for public offering firms. Thus, the pre-SEO liquidity differs between firms using rights versus public offerings.
In the U.S., rights offers are virtually non-existent. However, liquidity is still a determinant of flotation method choice. Gao and Ritter (2008) analyze three SEO offering methods: bought deals, accelerated bookbuilt offers, and fully marketed deals. They find that a larger bid-ask spread decreases the probability of an accelerated offer over a fully marketed offer. Since bid-ask spreads are a measure of liquidity, their results indicate that firms with lower liquidity favor fully marketed offers. Further, they document that, after controlling for various offer and firm characteristics, including bid-ask spreads, fully marketed offers pay an average 3% higher gross spread than accelerated SEOs. Less liquid firms prefer fully marketed offer and pay higher fees.
We argue that liquidity affects the costs and benefits analysis of flotation method and affects the flotation method choice. Thus, we re-examine the rights offer paradox after accounting for the endogeneity of the issuing firm’s choice regarding flotation methods. We study whether flotation cost differences and changes in post SEO liquidity are still significantly different among the flotation methods, using 2SLS regression analysis.
We use a hand collected dataset containing 178 SEOs by French firms over the period 1995 to 2006. The dataset includes information on SEO characteristics, abnormal announcement returns, flotation costs, and measures of intraday liquidity. We compare three flotation methods: standby rights issues, uninsured rights and public offerings. The French institutional setting is appropriate for these tests for several reasons. First, French firms have the freedom to choose among the three different flotation methods. We can therefore compare the effects of ex ante liquidity on the choice of a flotation method as well as the consequences of this choice on post SEO liquidity, which has rarely been done in previous work. Second,
5 whereas in the U.S., utilities, closed-end funds, REITS, and more recently financial distressed firms are the primary users of rights offerings (Heron and Lie, 2004, and Ursel, 2006), in France large publicly traded corporations frequently choose this flotation method. Furthermore, while there has been a trend away from rights offerings in the 1990s, rights offerings have not disappeared, and large firms still choose this method. Third, a distinctive feature of French firms is the high concentration in ownership (Faccio and Lang, 2002). In the case where current shareholders renounce subscription to the newly issued shares, SEOs will dilute blockholder ownership and increase trading, whatever issuance method is chosen.
For public offerings, we find that flotation costs are greater when pre-offering liquidity is high. We find that both mean and median liquidity improves significantly after public offerings, but only the median improves for rights issues, whether standby or uninsured. Further, we document that, in addition to blockholders’ takeup, ex ante liquidity is an important determinant of flotation method choice. Firms with large blockholders choose between rights and public offerings depending on the willingness of the blockholders to subscribe to new share and the firm stock liquidity. When blockholders renounce subscription to the new shares, firms prefer public offerings. When blockholders choose to subscribe, the rights offering method is preferred and liquidity drives the choice between standby and uninsured rights. Firms with low liquidity choose uninsured rights whereas firms with high liquidity opt for standby rights; bankers agree to underwrite rights offerings if there is sufficient liquidity for them to be a market maker. By controlling for endogeneity via 2SLS methodology, we are able to take into account these determinants of the flotation method choice. The first step regression is a multinomial logit model of the flotation method choice and the second step regressions explain flotation costs and abnormal post SEO liquidity. We find that uninsured rights are the least expensive flotation method, but generate the smallest improvement in market liquidity. However, when rights offerings are accompanied by an underwriting contract, they become more expensive than public offerings. Public offerings are the best method to improve post-SEO liquidity. Our results confirm that liquidity is an important factor for the resolution of the rights offer paradox.
The remainder of the paper is organized as follows. Section 2 develops the institutional setting and our hypotheses. Section 3 discusses the sample construction and our data. Section 4 presents our empirical results. Section 5 concludes.
6 2. Institutional environment and hypotheses
2.1. SEOs institutional framework
French firms can choose between three flotation methods: rights issues, which are underwritten (standby rights) or not (uninsured rights), and public offerings. In contrast to the US, rights offerings are the predominant flotation method in France, although French firms select the public offering method more frequently than in other closely held markets. The French institutional setting for public offerings differs from the U.S. A purchase priority can be offered on a pro rata basis to current shareholders over an average three-day period. In contrast to rights, this purchase priority cannot be traded. The offer price is set before the announcement of the SEO according to the following rules. Until February 2005, the minimum offer price had to be as large as the average price over a period of 10 consecutive trading days selected among the 20 days preceding the issuing date. Since 2005, it must be at least equal to the average price over the 3-day period preceding the offer and the maximum discount is 5%. Among our public offerings, there are a few accelerated bookbuildings. Accelerated bookbuilt offerings are executed in one to three days on average, compared to five to seven days for traditional bookbuildings.3 Due to the small number of observations, we do not analyse the two sets of bookbuilt offerings separately.
2.2. Hypotheses
Direct flotation costs decrease as market liquidity increases
Several authors have provided evidence on flotation costs and their determinants (for example, Smith, 1977, Eckbo and Masulis, 1992 and Slovin, Sushka and Lai, 2000). Underwriter fees represent a large part of the direct flotation costs. Altinkilic and Hansen (2000) find that relative underwriting costs increase with the firm’s total risk measured by the standard deviation of returns, increase with the percent change in shares, and decrease with the offer size.
Butler, Grullon and Weston (2005) study the importance of stock liquidity as a determinant of flotation costs. The rationale for why liquidity might be important is that costs faced by the underwriters are similar to intermediation costs supported by dealers or block traders. It is easier for the underwriters to place the new shares when market liquidity is high. Further, firms pay for market making after the SEO. Using abnormal volume as a proxy for
7 market making, Altinkilic (2001) finds that on average market making represents 20% of the underwriter’s compensation. Butler, Grullon and Weston (2005) also document a robust inverse relationship between the total fees paid to investment banks and the stock liquidity of the issuing firm. They find the effect of liquidity is stronger for large offerings than for small offerings and suggest that the effect of liquidity on flotation costs is stronger when liquidity matters the most. Further, Altinkilic (2001) finds that for the less liquid issuing firms, a third of the lead bank’s compensation is to cover market making activities, whereas for the most liquid firms, there is little compensation for market making.
However, the previous literature does not consider rights issues. Our hypothesis is that liquidity is an important determinant of direct flotation costs for public offerings, but less so for rights issues. Uninsured rights typically do not benefit from market making activities. If current shareholders resell their rights on organized exchanges, there are brokerage fees, which are avoided by subscribing to new shares. Further, even in standby rights, the large discount inherent in rights issues, and the fact that rights may not be traded at all make market liquidity a less important factor for underwriters. In the case where current shareholders take up all their rights, there are no transaction costs, and liquidity does not matter. Thus, ceteris paribus, low liquidity firms will prefer rights issues whose costs are less sensitive to liquidity.
Liquidity increases more after public offerings compared to rights
An equity offering involves changes in trading volume, volatility and information asymmetry, which in turn impact liquidity. We examine the effects on liquidity of different flotation methods. As previous literature has shown, public offerings and rights issues may have different effects on free float due to differences in blockholding reduction. The choice of flotation method is directly linked to ownership structure and to shareholder takeup. Bohren, Eckbo and Michalsen (1997), Cronqvist and Nilsson (2005) and Slovin, Sushka and Lai (2000) report that rights issues are more likely to be selected by issuers with a greater current shareholder takeup. Gajewski and Ginglinger (2002) find that shareholder takeup in France is much larger for public offerings than for rights issues.
French firms are characterized by a high degree of ownership concentration, leading to limited share availability, fewer investors, and low trading frequency. In a closely held firm, the amount of information available is limited and blockholders are more likely to trade on their private information. For these reasons we expect liquidity to decrease with blockholdings. Heflin and Shaw (2000) for the U.S. and Ginglinger and Hamon (2007) for
8 France report a positive relationship between spreads and block ownership. However, results for the U.S. where blockholders are mainly institutional investors are mixed. Since institutions prefer more liquid stocks, empirical investigations need to take into account endogeneity between liquidity and institutional holdings. For example, Rubin (2007) reports that liquidity is positively related to total institutional holdings but negatively related to institutional blockholdings since these investors are more likely to have private information.
Blockholdings in France are mainly insider blocks (management, families). Therefore, we expect liquidity to improve with the reduction in the relative size of these blocks. For a sample of Nasdaq issuing firms, Kothare (1997) finds that bid-ask spreads decrease after public offerings as ownership becomes more diffuse, whereas they increase after rights issues since the latter lead to more concentrated ownership. However, her results relate to the special characteristics of US rights issuers, given that rights issues are rare in the U.S., especially outside of the utility sector. Kothare’s (1997) Table 1 shows that the average stock price of rights issuers is particularly low (near $5 to compare to a $19.54 average offer price for SEOs on Nasdaq firms in Corwin, 2003). The minimum tick size and the fact that the new shares are sold at a discount may partly explain Kothare’s results. Further, a considerable proportion of U.S. rights issuers are in financial distress. Ursel (2006) reports that at least 28% of sample rights firms have declared bankruptcy within the sample period. Therefore, the fraction of the issue subscribed to by outside investors is limited, resulting in an increase in initial blockholdings.
In contrast, in France, current shareholders have to choose between public offerings and rights offerings. In a public offering, current shareholders may buy the new shares, especially if they are given a priority to subscribe, but frequently a large proportion of the offer is subscribed to by outside investors – mainly institutional investors. Therefore, these offerings are characterized by a reduction in current insider blockholdings. In a rights offering, shareholders may use their rights to subscribe to new shares or renounce subscription and sell their rights. Current blockholders indicate in the registration statement whether they intend to subscribe or renounce their share allocation. Therefore, the post issue ownership structure will remain unchanged, if all current shareholders subscribe to their allocation, or become more dispersed with an increase in the number of shareholders, either individual or institutional.
Our hypothesis is that public offerings lead to a stronger improvement in post-SEO liquidity relative to rights offerings, due to an increase in dispersion of ownership. We
9 measure the reduction in current blockholdings by the sum of previous free float and the proportion of the new issue that is offered to outside investors scaled by the market value of the firm.
Liquidity is an important determinant of the choice of a flotation method
The choice of a flotation method depends on the characteristics of the firm. Eckbo and Masulis (1992) argue that the main driver of the flotation method choice is the shareholder takeup, k. While Myers and Majluf (1984) argue that firms issue new equity as long as the net present value of the investment undertaken is higher than the expected wealth transfer to outside investors, Eckbo and Masulis (1992) add direct costs to the wealth transfer costs. When current shareholders subscribe to the entire offering, managers choose the lowest direct costs method, uninsured rights, but as k decreases, the wealth transfer cost increases, eventually making it optimal to add quality certification through a standby offering, despite higher direct costs. As k approaches zero, firms prefer public offerings. Bohren, Eckbo and Michalsen (1997) for Norway, and Gajewski and Ginglinger (2002) for France provide evidence supporting these predictions.
We introduce liquidity as another important determinant of the flotation method in a Myers and Majluf setting. First, as underlined previously, liquidity is a determinant of direct flotation costs. A low liquidity firm choosing a public offering will incur large costs, because market making is costly for underwriters. For low liquidity firms, the differential in direct costs between public offerings and rights issues may be large, which will induce a preference for rights issues, even for low shareholder takeup. If firms only had access to the public offering method, in the presence of high expected flotation costs, managers might prefer to avoid the issue.
Endogeneity, costs and liquidity
Finally, if firms choose the flotation method that leads to the lowest costs for them, flotation method choice variables may not be exogenous, as most previous literature on SEO flotation costs assumes. Thus, we will estimate the link between flotation costs and post SEO liquidity improvement taking into account the endogeneity of the issuing firm’s choices regarding flotation methods.
10
Summary of our predictions
We expect direct flotation costs to decrease with ex ante liquidity for public offerings. We expect liquidity to increase after a SEO, more so after a public offering than after a rights issue.
We expect liquidity to be a determinant of the choice of a flotation method.
3. Data
3.1. Sample selection
Our initial sample consists of the universe of 274 seasoned equity offerings listed in the annual reports of the AMF4over the period 1995-2006. Our sample period starts in 1995 because intraday data to calculate bid-ask spreads are not available prior to 1995. The final sample excludes all issues that do not meet the following criteria:
- Issues that involve more than a single type of security (thus units of common stock and warrant offerings are excluded);
- Issues that do not have 30 returns available over the period (-180,-30) prior to the announcement date.
These selection criteria leave us with a sample of 178 offerings, described in Table 1. This sample includes 61 uninsured rights issues, 71 standby rights issues and 46 public offerings. Our sample of rights offerings (132) is larger than the U.S. sample in Ursel (2006), which contains 42 rights offerings over a 17 year period or Heron and Lie (2004), which contains 56 rights issues over a 19 year period.
[Insert Table 1]
3.2. Liquidity measures
Data are obtained from the Euronext intraday database over the period January 1995 to December 2006. These data include transaction prices, trading volume, and the best limits of the order book (bid and ask prices and depths), as well as market capitalization. All data are stamped to the nearest second.
Several different proxies are used to measure liquidity along its various dimensions. Three of the seven measures that we use are based on the bid-ask spread. The first measure is the quoted relative bid-ask spread, defined as the difference between the ask and the bid price
11 divided by the bid-ask midpoint, which captures the cost of immediacy. Since all trades are not completed at the best price limits, we complement this measure with the effective spread using Roll’s (1984) estimator. We compute the effective spread as 2 −cov(∆pt,∆pt−1)where
t
p
∆ denotes the first difference in log opening prices. A third measure uses the estimate proposed by Lesmond et al. (1999). One advantage of their approach is that it allows us to compute a general estimate of transaction costs, including, but not restricted to, the bid-ask spread.
Following Chordia, Subrahmanyam and Anshuman (2001), we also use trading volume (in euros) since trading volume captures the ease with which investors can turn around their position. We also employ the turnover rate (traded volume in euros / market capitalization), which measures the average investors’ holding period. Constantinides (1986) proves theoretically that investors react to higher trading costs by reducing the frequency and volume of their trades, which results in lower turnover. Thus, turnover allows us to capture average trading costs over the cross-section of trade sizes whereas quoted bid-ask spread measures the cost of a round-trip small size transaction. Finally, we include price impact measures. More specifically, we use the Amihud illiquidity ratio which is defined as the ratio of absolute return to volume. The intuition for this measure is that liquid securities can accommodate large trading volumes with small price concessions. Since the Amihud ratio often exhibits extreme values, we also use a rescaled version suggested by Hasbrouck (2005), which is defined as the average of the square root of daily ratios.
3.3. SEOs characteristics
We hand collect most data from the registration statements filed with the AMF.5 Each filing covers the proceeds from the offer, the subscription price, the number of current shares, the underwriters' name, the firm’s ownership structure, and flotation costs as estimated by the company. The announcement dates are checked with Lexis-Nexis. Accounting data are collected from Thomson Financial.
Table 2 reports descriptive statistics categorized according to flotation method.
12 Panel A presents statistics for the issuing firms’ general and governance characteristics. Firms that use standby rights issuance tend to be the largest in terms of market value of equity whereas firms that use public offerings are the smallest in terms of the mean (but uninsured rights are the smallest in terms of the median).6 The average Debt/assets ratio is equal to 30.53% and does not differ significantly by offering type. In contrast, for the U.S., Ursel (2006) reports an average debt/equity ratio of sample rights firms almost twice as large as for non-rights firms. Median market-to-book ratios are larger for public offers compared to rights issues.
The average percentage of shares held by the main shareholder is lower for standby rights offerings compared to alternative flotation methods (33.50% versus 47.08% for uninsured rights, 44.30% for public offerings). The average percentage of shares held by all blockholders (holding more than 5% of the shares) lies between 47.05% for standby rights issues and 66.77% for uninsured rights offerings. At the 20% threshold, firms are controlled by a family (33%), another corporation (25%), a financial institution (15%) and 25% are widely held.
Table 2, Panel B describes offering characteristics. The three types of offerings differ in various ways. The mean (median) number of shares in a public offering scaled by the total number of outstanding shares after the issue is 16.60% (14.25%). This ratio is highest for uninsured rights (mean 31.61%, median 26.10%). The subscription price offers a mean (median) discount from the stock market price of 14.85% (13.85%). The mean discount for public offerings is 4.12%. The discount for standby rights (21.37%) exceeds the discount to uninsured rights (15.35%). It should be noted that public offerings and rights issues discounts are not comparable since rights discounts are to current shareholders. In public offerings, shares are mainly offered to raise funds for new investments, while 59.02% of uninsured rights and 39.44% of standby rights proceeds are used to repay debt.
For 72% of sample offerings, there are subscription precommitments from blockholders, on average, to subscribe 34.71% of the offering. Public offerings significantly differ from other flotation methods as 82.19% of the gross proceeds are offered to outside investors, reflecting low blockholder takeup. For uninsured rights, blockholder precommitments are at 52.32%. The mean (median) expected reduction in blockholdings equals 4.04% (2.20%) for the total sample. The largest reduction is observed for public offerings (6.30%) while the lowest is observed for standby rights issues (2.90%).
13 For each sample firm, we compute the abnormal stock runup over the (-180,-2) period before the SEO announcement date. The mean (median) long term stock runup is 14.14% (8.45%). We find a small mean runup prior to an uninsured rights offer announcement (1.75%), a positive runup prior to standby rights issues (17.78%), and a larger positive runup prior to a public offer announcement (24.97%). This evidence supports Eckbo and Masulis (1992) prediction that there should be a limited runup before an offering with large blockholders precommitments, which are generally observed in uninsured rights issues.
4. Empirical results
4.1. Univariate analysis of flotation costs, abnormal returns and market liquidity changes around SEOs
We measure costs of SEOs as flotation costs and abnormal returns at SEO announcements (Table 3, Panel A). Public offerings are more expensive than rights offerings. The average cost of offerings as a percent of total issue proceeds is 4.08% for public offerings, 3% for standby rights and 2.55% for uninsured rights issues, confirming the low-cost status of the latter flotation method.7
The abnormal stock returns at SEO announcement are computed as the cumulative abnormal return for the day preceding and the day of the announcement (days -1 and 0 in event time). The estimation of the market model coefficients is obtained for the period ranging from -180 to -30 trading days prior the offering announcement. The mean announcement returns are insignificantly negative for uninsured rights offerings (-0.76%) and significantly negative for public offerings (-2.01%). We find a market reaction to standby rights offering close to zero.
We next examine whether liquidity improvement could favor public offerings. We first present univariate estimates of liquidity measures before SEOs and abnormal liquidity measures around SEOs (Table 3, panel B). We measure abnormal liquidity as the difference between the post SEO liquidity measures (period 30 to 180, where 0 is the end of the subscription period) and the normal liquidity calculated over the pre-estimation period, -180,-30. We choose to exclude the immediate post SEO period to avoid short term effects due to market making. As Aktinkilic (2001) underlines, underwriters provide market making during the offer period and the following weeks. Typically in French underwritten contracts, market making can occur over 30 days after the beginning of the subscription period. Our post SEO
14 period begins 30 days after the end of the subscription period, and therefore does not reflect market making activity.
[Insert Table 3]
First, we observe striking differences in ex ante liquidity according to the flotation method. Firms using standby rights are the most liquid, whatever measure we use. They have the largest volume, turnover, and Amihud/Amivest liquidity measures. The average bid-ask spread is 1.36%, compared to 2.36% for public offerings and 3.64% for uninsured rights. Overall, the most liquid firms choose standby rights, and the less liquid ones choose uninsured rights. The firms in-between choose public offerings.
Second, SEOs enhance liquidity. For the total sample, we observe an increase in volume and a decrease in bid-ask spreads, Amihud illiquidity measures, transaction cost estimates (LOT) and the Roll effective spread. The increase in volume is especially important and significant for rights issues, whether underwritten or not, whereas the average bid-ask spread is significantly smaller for public offerings. The median spread also decreases for rights issues.
Our univariate results confirm the findings in the previous literature as to the hierarchy of our three flotation methods as far as flotation costs and announcement market reaction. The results also establish that liquidity improves after SEOs, especially after public offerings. However, they do not account for the heterogeneity in the issue proceeds, the risk characteristics and the reduction in blockholdings. In the next subsections, we control for these factors in a multivariate setting.
4.2. Multivariate analysis of flotation costs, abnormal returns and liquidity effects
We control for size, risk, ownership structure and test whether flotation methods have an effect on direct flotation costs, abnormal return, and liquidity changes when controlling for issue characteristics. We include year dummies to control for the evolution of costs over time.
Table 4 reports the estimation results from the following regressions.
Flotation costsi = α + β0 VOLATi + β1Gross proceeds i + β2 pre-SEO liquidity + β3 takeupi + β4 standby rightsi + β5 public offerings + standby rights*pre-SEO liquidity + public offerings* pre-SEO liquidity + year dummies + εi
15
Abnormal returni = α + β0 VOLATi + β1Gross proceeds i + β2 pre-SEO liquidity + β3 takeupi + β4 acquisitioni + β5 standby rightsi + β6 public offerings + year dummies + εi
Abnormal liquidityi = α + β0 VOLATi + β1Gross proceeds i + β2 pre-SEO liquidity + β3 free float changei + β4 standby rightsi + β5 public offerings + year dummies + εi
[Insert Table 4]
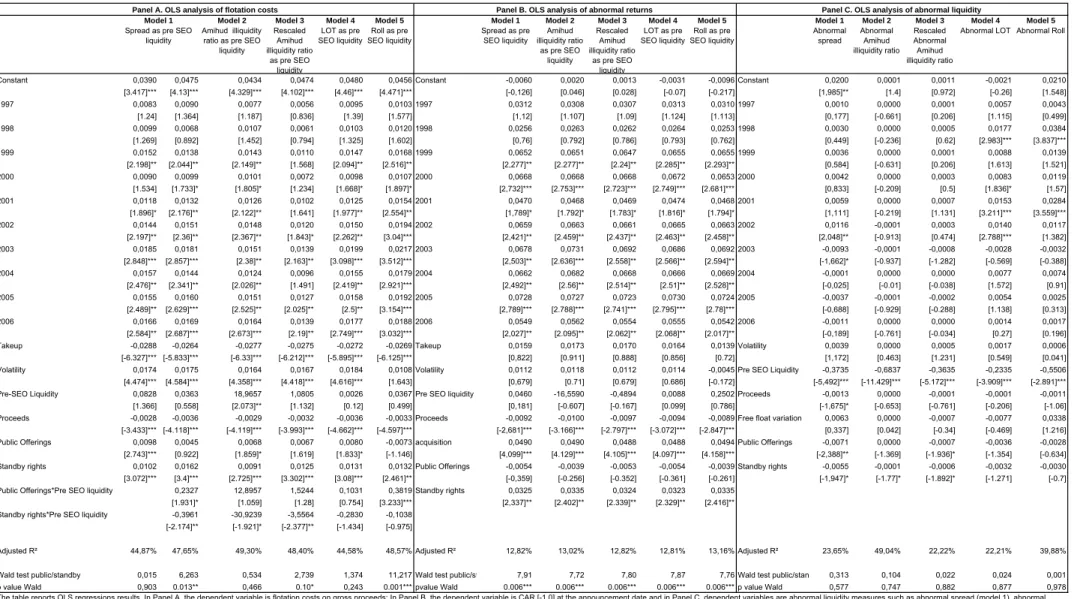
Results in Table 4, Panel A confirm that, when controlling for size, volatility, blockholder takeup, and pre-offering liquidity, direct flotation costs are larger for public offerings and standby rights compared to uninsured rights, but we do not find any difference between standby rights and public offerings costs (as the Wald test of the difference in the coefficients of the standby rights and public offerings method dummies coefficients indicates at the end of Table 4). Flotation costs increase with volatility, and decrease with size and blockholder takeup. The pre-SEO liquidity decreases flotation costs, but the significance of the coefficient depends on the measure of liquidity introduced in the model.
We further examine the effect of liquidity on direct costs by introducing an interactive variable for flotation methods and pre-SEO liquidity. We find that flotation costs increase with spreads for public offerings, whereas the cost disadvantage of standby rights decreases as liquidity worsens, whatever measure for liquidity is used. The first result confirms Butler et al (2005) results. When investment banks face costs of market making or maintaining a net position in the stock, these costs are lower for more liquid firms. Uninsured rights typically do not benefit from market making activities, and we observe that direct flotation costs for these offerings do not depend on liquidity. Finally, in standby rights, even if underwriters are in charge of the placement of the shares, market liquidity is less important for them. In the case where current shareholders take up all their rights, there are no transaction costs, and liquidity does not matter. Further, the large discount inherent to rights issues reduces the market making activity of the underwriter.
The market reaction to SEO announcement becomes less favorable as the size of the issue increases, and is more positive when the issue is intended to finance an acquisition, confirming previous findings (Table 4, Panel B). Ex ante liquidity has no effect on the abnormal return at the announcement date. Standby rights have a more positive market
16 reaction than uninsured rights. Public offerings have a market reaction that does not differ from that for uninsured rights, but is significantly lower than the reaction to standby rights, as the Wald test at the end of the Table 4B shows.
We next turn to post-SEO liquidity analysis (Table 4, Panel C). Abnormal Liquidityi is
the dependent variable represented by the abnormal relative spread, Amihud illiquidity ratio, rescaled Amihud ratio, transaction cost estimate (LOT), Roll’s spread, for the SEOi. The size of the offering, which is directly linked to the size of the firm, reduces spreads. Larger firms enjoy more analyst coverage, greater disclosure activity, and therefore reduced information asymmetry. Liquidity improves more for firms that are less liquid in the pre-event period. The impact of an increase in market value of the firm and of its free float is more important for low liquidity firms, whatever the measure for liquidity. The dilution of blockholders does not impact the change in liquidity. We find that both public offerings and standby rights lead to improved post-SEO spreads and rescaled Amihud ratio, compared to uninsured rights, whereas the Amihud illiquidity measure is lower for standby rights compared to uninsured rights.
4.3. Liquidity as a determinant of the flotation method
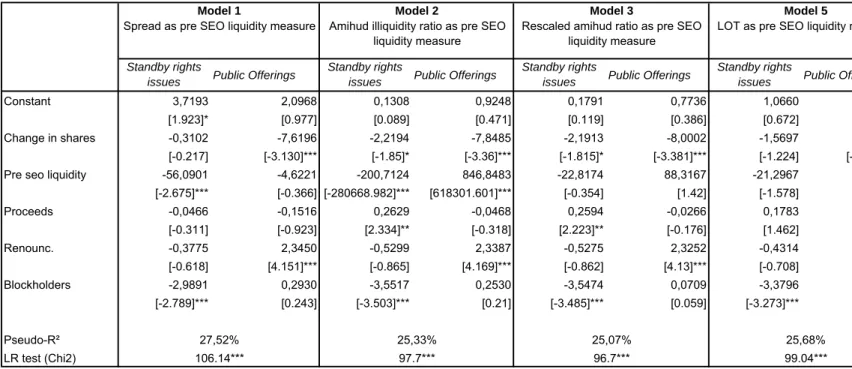
We estimate a multinomial logit of probability of a firm choosing either standby rights or public offerings over uninsured rights. The estimates are reported in Table 5.
[Insert Table 5]
Three variables explain the flotation method choice: the percentage of capital held by blockholders, a dummy equal to one when blockholders renounce subscribing the new shares8, and ex ante liquidity. Firms with large blockholders choose between public offerings and uninsured rights. They opt for public offerings when blockholders renounce their share allocation and for uninsured rights when they decide to subscribe. Low liquidity firms have a preference for uninsured rights. As underwriting contracts, either standby or firm commitment, may be too costly for them, they will choose the less expensive uninsured rights. Firms will therefore balance underwriter fees and blockholder decisions. Liquidity will be especially important for firms with a large part of the issue offered to outside investors, due to small initial blockholders or current blockholder renouncement of their allocation. However, low liquidity firms may prefer uninsured rights, even if blockholders partly renounce their allocation, because the transaction costs incurred by current shareholders
17 selling their rights and the wealth transfer costs may still be lower than the fees an underwriter would charge for a public offering.
4.4. 2SLS analysis of flotation costs, abnormal returns and liquidity effects
Models explaining direct costs, market reaction and liquidity effects in Table 4 are estimated on the implicit assumption that the flotation method choice variables are exogenous. However, as Table 5 shows, this is unlikely to be the case. OLS estimates for the coefficients of endogenous method dummies may be inconsistent. Firms that may pay the higher flotation costs when opting for an underwritten offering are likely to prefer uninsured rights. Therefore, we employ two-stage least-squares regressions to take endogeneity into account. The first stage is the multinomial logit estimated in Table 5. The second stage uses the predicted probabilities from the first stage to instrument the endogenous choice variables. The other explanatory variables are those used in the OLS regressions. Results are reported in Table 6.
[Insert Table 6]
Controlling for endogeneity, we find that, whatever liquidity measure is included in the regression, standby rights are more expensive than uninsured rights. The coefficient for public offerings is positive, but only weakly significantly, meaning their costs are slightly larger or comparable to uninsured rights costs. Comparison of the OLS estimates in Table 4 and the 2SLS estimates in Table 6 suggests significant differences introduced by the failure to treat flotation method choices as endogenous. Table 4 highlights equal costs for standby rights and public offerings, whereas the Wald test at the end of Table 6 documents that at the 10% significance level, standby rights are more expensive than public offerings. Controlling for endogeneity, market reactions to SEO announcements no longer differ significantly according to the flotation method. Finally, we find that Amihud liquidity measures are improved after public offerings and also, but less significantly, after standby rights, compared to uninsured rights. Bid-ask spreads are significantly reduced for public offerings compared to standby rights (Wald test). Once flotation method choice is treated as endogenous, public offerings appear slightly less expensive and a more liquidity improving method than standby rights. Uninsured rights are still a good low cost choice for firms that are not seeking improved market liquidity.
18 5. Conclusion
This paper extends the earlier tests of the rights offer paradox by including liquidity effects in the costs and benefits of a given flotation method. We study three major SEO offer methods: uninsured rights, standby rights and public offerings. Our study investigates how flotation costs depend on market liquidity, how market liquidity affects the flotation method choice, and whether liquidity improves after SEOs.
We first document that flotation costs decrease with market liquidity for public offerings, but not for rights issues, and contribute to the debate on the effect of liquidity on firm value. Second, we find that market liquidity and blockholder renouncement to subscribe to the new shares are important determinants of the flotation method choice. Low liquidity firms prefer uninsured rights. When large blockholders decide not to subscribe to the new offering, firms opt for public offerings. Treating the flotation method choice as endogenous, we find that public offerings are less expensive and more liquidity improving than standby rights. Uninsured rights incur reduced flotation costs, but limited market liquidity improvement although it may still be the best method for firms with large blockholders subscribing to the new shares. Our results help to understand why firms choose public offerings despite higher apparent costs and therefore contribute to the resolution of the rights offer paradox. Our study provides insights to help issuing firms and investment bankers to better understand the costs and benefits of the different flotation methods used for SEOs.
19 REFERENCES
Acharya V., and L. Pedersen, 2005. Asset pricing with liquidity risk, Journal of Finance 77, 375-410.
Altinkilic, O, 2001, An examination of seasoned equity offer placement effort, Phd Dissertation, Virginia Polytechnic Institute
Altinkilic, O, and Robert S. Hansen, 2000, Are there economies of scale in underwriting fees? Evidence of rising external financing costs, Review of Financial Studies 13, 191–218.
Amihud, Y..and H. Mendelson, 1986. Asset pricing and the bid-ask spread, Journal of Financial Economics 17, 223-249.
Amihud, Y., Mendelson, H., 1989. The Effects of Beta, Bid-Ask Spread, Residual Risk, and Size on Stock Returns., Journal of Finance 44, 479-486.
Bohren O., Eckbo B, and D. Michalsen, 1997. Why Underwrite rights offerings? Some New Evidence, Journal of Financial Economics 46, 223-261.
Bortolotti B., Megginson W.L., and S.B. Smart, 2007. The Rise of Accelerated Seasoned Equity Underwritings, Working Papers 2007, Fondazione Eni Enrico Mattei.
Brennan, M.J., and A. Subrahmanyam, 1996. Market microstructure and asset pricing: On the compensation for illiquidity in stock returns, Journal of Financial Economics 41, 441-464. Butler, A.W., Grullon, G., and J.P. Weston, 2005. Stock Market Liquidity and the Cost of
Issuing Equity, Journal of Financial and Quantitative Analysis 40, 331-348.
Chalmers, J.M.R., and G. Kadlec, G. 1998. An Empirical Examination of the Amortized Spread, Journal of Financial Economics 48, 159-188.
Chordia, T., Subrahmanyam, A. and R. Anshuman, 2001. Trading activity and expected stock returns, Journal of Financial Economics 59, 3-32.
Constantinides, G. M., 1986, Capital Market Equilibrium with Transaction Costs, Journal of Political Economy, 94, 842-862.
Corwin, S.A., 2003. The Determinants of Underpricing for Seasoned Equity Offers, Journal of Finance 58, 2249-79.
Cronqvist, H., and M. Nilsson, 2005. The choice between rights offerings and private equity placements, Journal of Financial Economics 78, 375-407.
Datar, T.V, Naik, N., and R. Radcliffe, 1998. Liquidity and stock returns: an alternative test, Journal of Financial Markets 1, 203–219.
20 Denis, D., and Kadlec, G.B.,1994. Corporate events, trading activity, and the estimation of
systematic risk: evidence from equity offerings and share repurchases, Journal of Finance 49, 1787–1811.
Eckbo, B.E., and R.W Masulis, 1992. Adverse selection and the rights offer paradox. Journal of Finance 32, 293-332.
Eckbo, B.E., Masulis, R.W. and O. Norli, 2007. Security Offerings, Handbook of Corporate Finance: Empirical Corporate Finance, E. Eckbo (ed.), Chapter 13.
Ellul A. and M. Pagano, 2006, IPO underpricing and aftermarket liquidity, Review of Financial Studies, 19, 2, 381-421
Faccio M. and Lang L.H.P, 2002, The ultimate ownership of Western European corporations, Journal of Financial Economics, 65, 365-395.
Gajewski, J.F., and E. Ginglinger, 2002. Seasoned Equity Issues in a Closely Held Market: Evidence from France, European Finance Review 6, 291-319.
Gao X. and J. Ritter, 2008, The marketing of seasoned equity offerings, Working paper, University of Florida.
Gardängen, M., 2006. Effects of Rights Issue on Share Liquidity: A study on the Swedish Stock Exchange, Unpublished working paper, School of Economics and Management, Lund University.
Ginglinger, E., and J. Hamon, 2007. Ownership, control and liquidity, Working paper, Université Paris-Dauphine
Hasbrouck J., 2005, Trading costs and returns: The evidence from daily data, Working paper, Stern School of Business.
Heflin, F. and Shaw, K., 2000. Blockholder ownership and market liquidity, Journal of Financial and Quantitative Analysis 35, 621-633.
Heron, R.A, and E. Lie, 2004. A comparison of the motivations for and the information content of different types of equity offerings, Journal of Business 77, 605–632.
Kothare, M., 1997. The Effects of Equity Issues on Ownership Structure and Stock Liquidity: A Comparison of Rights and Public Offerings, Journal of Financial Economics 43, 131-148. Lease, R.C., Masulis R.W. and J. Page, 1993. Impacts of seasoned equity offerings on market microstructure and the stock return generating process, Working paper, University of Utah. Lee G. and R.W. Masulis, 2008, Seasoned equity offerings: quality of accounting information
21 Lesmond D. Ogden J. and Trzcinka C., 1999, A new estimate of transaction costs, Review of
Financial Studies 12, 1113-1141.
Myers S.C. and N.S. Majluf, 1984, Corporate financing and investment decisions when firms have information that investors do not have, Journal of Financial Economics 13, 187–221. Pastor L. and Stambaugh R.F., 2003, Liquidity risk and expected returns, Journal of Political
Economy, 11 (3), 642-685.
Qian, H., 2005. Liquidity Changes around Seasoned Equity Offerings and Private Placements, Unpublished working paper, Smeal College of Business Administration, The Pennsylvania State University.
Roll, R., 1984, A simple implicit measure of the bid-ask spread in an efficient market, Journal of Finance 39, 1127-1139.
Rubin, A., 2007. Ownership level, ownership concentration and liquidity, Journal of Financial Markets 10, 219-248.
Slovin, M.B., M.E. Sushka, and W. L. Lai, 2000, Alternative flotation methods, adverse selection, and ownership structure: Evidence from seasoned equity issuance in the U.K., Journal of Financial Economics 57, 157–190.
Smith, Jr., C.W., 1977, Alternative methods for raising capital: Rights versus underwritten offerings, Journal of Financial Economics 5, 273–307.
Tripathy, N., and R.P. Rao, 1992. Adverse selection, Spread Behavior, and Over–the–Counter Seasoned Equity Offerings, Journal of Financial Research 15, 39–56.
Ursel, N.D., 2006. Rights Offerings and Corporate Financial Condition, Financial Management 35, 31-52.
22
1
Several recent studies investigate the IPO aftermarket liquidity (see for example Ellul and Pagano, 2006).
2
Using a sample of underwritten public offerings, Lee and Masulis (2008) find that firm’s information asymmetry, which we can view as an explanatory factor of liquidity, increases the probability of SEO withdrawals. They find that information asymmetry is greater for withdrawn issues than for completed SEOs.
3
Bortolotti, Megginson and Smart (2007) document a dramatic increase in SEOs executed through accelerated underwritings in Europe and in the U.S.
4
The AMF (autorité des marchés financiers) plays the same role as the SEC in the US.
5
Thomson New Issues databases for France report only part of the SEOs. We double checked our sample with their data. We find that New Issues databases report one third of our sample, with several missing data and mistakes, but report several repurchases and bought deals classified as SEOs.
6
The type of firms using public offerings dramatically changed over time. In Gajewski and Ginglinger (2002)’s study over the period 1986-1996, the largest firms chose public offerings, to have access to international markets and institutional investors and enlarge their float. More recently, rights offerings rebounded especially for large firms, guided by control motivation. For firms fearing tender offers and hostile entry in their capital, it may be optimal to use standby rights.
7
For a review of evidence on flotation costs results, see Eckbo et al, 2007.
8
Results remain qualitatively unchanged if we introduce current blockholders takeup in the model. However, current shareholder takeup may be low because the block they own is small or because they decide to renounce to subscribe to their allocation in the new issue. Our two variables, blockholders and renounce, capture this information.
Year
Number Proceeds Number Proceeds Number Proceeds Number Proceeds
1995 1 134 1 134 - - - -1996 9 1 146 7 1 106 1 34 1 6 1997 11 2 461 8 698 2 1 683 1 79 1998 7 1 552 4 1 176 - 0 3 375 1999 10 1 488 7 1 473 3 15 - 0 2000 33 6 636 11 5 550 7 148 15 938 2001 18 2 684 8 2 354 3 80 7 250 2002 15 3 038 4 1 033 8 1 829 3 176 2003 18 4 238 3 1 435 13 2 794 2 9 2004 17 1 285 5 1 207 9 58 3 20 2005 20 4 024 7 3 514 6 82 7 428 2006 19 20 336 6 9 728 9 9 934 4 674 Total 178 49 023 71 29 410 61 16 656 46 2 956
The sample consists of 178 share issues executed between January 1, 1995 and December 31, 2006 by firms listed on Euronext Paris. This table classifies the offerings by flotation method; proceeds is gross proceeds (Euro m); uninsured rights issues are rights offerings without bank standby underwriting; Public Offerings are equity issues without rights.
Table 1. Seasoned equity offerings in France from 1995 to 2006
All offerings Standby rights issues Uninsured rights
All Offerings Standby Rights Issues (SR) Uninsured rights issues (R) Public offerings (PO)
Mean Mean Mean Mean
Median Median Median Median
Number of observations 178 71 61 46 2 779,92 4 440,80 2 535,08 541,07 0,322 0,006*** 0,149 128,77 362,31 42,88 209,27 0,000*** 0,060* 0,001*** 30,53% 30,82% 31,84% 28,38% 0,807 0,486 0,437 29,30% 32,10% 29,30% 28,30% 0,668 0,278 0,669 4,44 6,69 2,23 4,09 0,305 0,492 0,346 1,74 1,75 1,47 2,73 0,075* 0,120 0,007*** 40,94% 33,50% 47,08% 44,30% 0,001*** 0,020** 0,552 40,55% 27,70% 47,60% 47,80% 0,001*** 0,011** 0,725 57,11% 47,05% 66,77% 59,83% 0,000*** 0,004*** 0,085* 61,85% 44,30% 67,00% 59,85% 0,000*** 0,005*** 0,042** 0,33 0,24 0,30 0,52 0,476 0,002*** 0,019** 0,00 0,00 0,00 1,00 0,474 0,002*** 0,018** 0,25 0,15 0,43 0,17 0,001*** 0,790 0,004*** 0,00 0,00 0,00 0,00 0,001*** 0,790 0,006*** 0,15 0,21 0,13 0,09 0,223 0,056* 0,467 0,00 0,00 0,00 0,00 0,229 0,077* 0,479 0,25 0,39 0,13 0,20 0,000*** 0,019** 0,382 0,00 0,00 0,00 0,00 0,001*** 0,025** 0,371 24,30% 23,02% 31,61% 16,60% 0.005*** 0.007*** 0,000*** 19,55% 18,20% 26,10% 14,25% 0.001*** 0.030** 0.000*** 47,30 60,76 29,17 50,56 0.025** 0,493 0.017** 24,20 27,00 13,72 35,94 0.014** 0,297 0.000*** 14,85% 21,37% 15,35% 4,12% 0.010*** 0,000*** 0,000*** 13,85% 20,50% 14,40% 3,85% 0.001*** 0.000*** 0.000*** 275,41 414,22 273,06 64,27 0,356 0.001*** 0.084* 31,29 90,58 11,21 30,58 0.000*** 0.004*** 0.048** 28,09% 33,80% 21,31% 28,26% 0,109 0,529 0,418 0,00% 0,00% 0,00% 0,00% 0,113 0,533 0,411 26,97% 26,76% 19,67% 36,96% 0,338 0,257 0.054* 0,00% 0,00% 0,00% 0,00% 0,342 0,247 0.048** 44,94% 39,44% 59,02% 34,78% 0,025 0,614 0.013** 0,00% 0,00% 100,00% 0,00% 0.026** 0,616 0.014** 72,47% 81,69% 88,52% 36,96% 0,271 0,000*** 0,000*** 100,00% 100,00% 100,00% 0,00% 0,278 0.000*** 0.000*** 34,71% 30,53% 52,32% 17,81% 0,000*** 0.017** 0,000*** 32,00% 26,60% 54,70% 0,00% 0.000*** 0.001*** 0.000*** 65,29% 69,47% 47,68% 82,19% 0,000*** 0.017** 0,000*** 68,00% 73,40% 45,30% 100,00% 0.000*** 0.001*** 0.000*** 4,04% 2,90% 3,67% 6,30% 0,454 0.002*** 0.043** 2,20% 0,90% 1,30% 5,25% 0,961 0.000*** 0.001*** 14,14% 17,78% 1,75% 24,97% 0.005*** 0.005*** 0,780 8,45% 6,60% 7,10% 17,35% 0.010** 0.010** 0,570 Abnormal runup [-180,-2]
The sample includes 178 share issues on the French Stock Exchange from 1995 to 2006. For Debt variable, we have only 162 observations. This table reports the mean and the median of each variable and the significance for the differences in means and medians between Standby Rights issues, Rights issues and Public Offerings. In Panel A., Size is market value (Euro m); Debt is the debt on assets ratio at year end before the issue, M/B is the market to book ratio at year end before the issue; Main shareholder is the percentage of the shares held by the main shareholder; Blockholders is the percentage of the shares owned by the shareholders whose names are included in the registration statement filed with the AMF; Family control, Corporate control, Financial control are dummies equal to one if the firm is controlled by a family, a corporate or a financial firm respectively; Widely held firms is a dummy equal to one if the main shareholder holds less than 20% of the shares.
In Panel B., Percentage of change in the number of shares is number of shares issued at number of shares after the issue; Discount is offer price less stock price at stock price; Proceeds is gross proceeds (Euro m), Acquisition financing, investment financing and capital structure are dummies equal to 1 if the funds raised are used *,**,*** represent the significance level of 1%, 5%, and 10% respectively.
External Takeup Proceeds Acquisition financing Investment financing Capital structure Precommitments
Free float expected variation
Table 2 . Descriptive statistics
Discount Debt M/B Main shareholder Blockholders Family control Corporate control p value for mean/median difference R vs PO
Panel A. Firms’ general and governance characteristics
Percentage of change in shares (%)
Offer price Size
Panel B. Offerings’ characteristics
Financial control
Widely held firms
p value for mean/median difference SR vs R p value for mean/median difference SR vs PO
All Offerings Standby Rights Issues (SR) Uninsured rights issues (R) Public offerings (PO)
Mean Mean Mean Mean
Median Median Median Median
3,13% 3,00% 2,55% 4,08% 0,157 0.011** 0.001*** 3,00% 3,00% 2,10% 3,85% 0.071* 0.015** 0.001*** -0,73% 0,09% -0,76% -2.01%*** 0,487 0,111 0,271 -1.00%** -1,15% -0.70%** -0.50%** 0,843 0,649 0,912 9 480 848 16 198 613 7 252 286 2 067 391 0,184 0.008*** 0,263 144 423 602 118 32 840 258 699 0,000*** 0.028** 0.002*** 0,255 0,310 0,216 0,219 0,217 0.083* 0,969 0,134 0,234 0,097 0,123 0.000*** 0.027** 0,228 2,402 1,362 3,644 2,361 0.000*** 0.007*** 0.017** 1,813 0,950 2,928 1,813 0.000*** 0.001*** 0.002*** 4,78 2,47 5,78 7,03 0,310 0,289 0,798 0,05 0,01 0,53 0,04 0.000*** 0.003*** 0.006*** 138,95 83,35 197,12 147,63 0.001*** 0,153 0,320 52,00 22,21 138,96 48,53 0.000*** 0.006*** 0.005*** 0,020 0,010 0,036 0,015 0.039** 0.090* 0,100 0,010 0,006 0,016 0,009 0.000*** 0.027** 0.008*** 0,044 0,034 0,055 0,046 0.000*** 0.006*** 0,137 0,038 0,027 0,045 0,040 0.000*** 0.003*** 0,275 3 121 058*** 6 287 580** 1 274 094 452 757 0.073* 0.026** 0,469 22 683*** 128 941*** 9 989*** 7 986 0.020** 0.018** 0,724 0,037 0,120 -0,224 0,228 0,485 0,745 0,340 -0,003 0,167 -0,061 0,001 0,254 0,911 0,144 -0.230** -0,109 -0,264 -0.367* 0,627 0,210 0,754 -0.121*** -0.045* -0.318* -0.196*** 0,222 0.079* 0,814 -7,505 -12,683 13,301 -24,882 0,546 0,599 0,377 -0.022*** -0.002*** -0,136 -0.059** 0,239 0,196 0,873 -0,183 -0,177 -0,106 -0.287** 0,856 0,519 0,637 -0.036*** -0.015*** -0,130 -0.084*** 0,314 0,329 0,890 -0,157 -0,111 -0,238 -0,133 0,608 0,928 0,731 -0.090* -0,051 -0,093 -0.145*** 0,571 0,519 0,930 -0.487** -0,110 -1.097*** -0,343 0.017** 0,672 0,196 -0.426*** -0,169 -0.890*** -0.528*** 0.005*** 0.041** 0,425
Abnormal Amihud illiquidity ratio*106 Abnormal turnover *103
LOT
Long-term Post subscription period - Abnormal liquidity measures Abnormal volume
Panel A. Flotation costs and abnormal returns
CAR [-1,0] announcement
Panel B. Liquidity measures
This table summarizes univariate results of flotation costs, abnormal returns and liquidity statistics.
In Panel A., Cost is the sum of the banking fees and the legal and administrative fees; CAR [-1,0] are abnormal stock returns computed at the announcement date (days -1 and 0 in event time).
In Panel B, liquidity statistics are given for the estimation period [-180,-30] where date 0 is the announcement date and abnormal liquidity measures are given for the post-subscription period [+30,+180] where date 0 corresponds to the post-subscription period expiration date. Abnormal liquidity measures are estimated as the difference between observed liquidity over post subscription period and its average value over the estimation period; Volume is the daily number of shares traded multiplied by the average daily trading price; Turnover is the ratio of the euro trading volume divided by the market value; Spread is the difference between the ask and bid prices divided by the spread midpoint; Amihud illiquidity ratio is 1/NΣ(|Rt|/|VOL€t|) where N is the number of non-zero trading volume days; |Rt| is the absolute return on date t and VOL€t is the euro trading volume on day t; Rescaled Amihud illiquidity ratio is the average of the square root of daily Amihud ratios; LOT is Lesmond et al. (1999) estimate of transaction c *,**,*** represent the significance level of 1%, 5%, and 10% respectively.
Abnormal rescaled Amihud illiquidity ratio*103 Abnormal LOT*102 Abnormal Roll*102 Rescaled Amihud illiquidity ratio
*105
Roll
Abnormal Spread*102 Amihud illiquidity ratio*105
Spread*102
Table 3. Univariate results around seasoned equity offerings
p value for mean/median difference SR vs R p value for mean/median difference R vs PO
Estimation period - Liquidity Measures Volume Turnover*102 p value for mean/median difference SR vs PO Cost/gross proceeds
Table 4. Multivariate analysis of flotation costs, abnormal returns and liquidity effects
Model 2 Amihud illiquidity ratio as pre SEO
liquidity Model 3 Rescaled Amihud illiquidity ratio as pre SEO liquidity Model 4 LOT as pre SEO liquidity Model 5 Roll as pre SEO liquidity Model 1 Spread as pre SEO liquidity Model 2 Amihud illiquidity ratio as pre SEO liquidity Model 3 Rescaled Amihud illiquidity ratio as pre SEO liquidity Model 4 LOT as pre SEO liquidity Model 5 Roll as pre SEO liquidity Model 1 Abnormal spread Model 2 Abnormal Amihud illiquidity ratio Model 3 Rescaled Abnormal Amihud illiquidity ratio Model 4 Abnormal LOT Model 5 Abnormal Roll
Constant 0,0390 0,0475 0,0434 0,0474 0,0480 0,0456 Constant -0,0060 0,0020 0,0013 -0,0031 -0,0096 Constant 0,0200 0,0001 0,0011 -0,0021 0,0210 [3.417]*** [4.13]*** [4.329]*** [4.102]*** [4.46]*** [4.471]*** [-0,126] [0.046] [0.028] [-0.07] [-0.217] [1,985]** [1.4] [0.972] [-0.26] [1.548] 1997 0,0083 0,0090 0,0077 0,0056 0,0095 0,0103 1997 0,0312 0,0308 0,0307 0,0313 0,0310 1997 0,0010 0,0000 0,0001 0,0057 0,0043 [1.24] [1.364] [1.187] [0.836] [1.39] [1.577] [1,12] [1.107] [1.09] [1.124] [1.113] [0,177] [-0.661] [0.206] [1.115] [0.499] 1998 0,0099 0,0068 0,0107 0,0061 0,0103 0,0120 1998 0,0256 0,0263 0,0262 0,0264 0,0253 1998 0,0030 0,0000 0,0005 0,0177 0,0384 [1.269] [0.892] [1.452] [0.794] [1.325] [1.602] [0,76] [0.792] [0.786] [0.793] [0.762] [0,449] [-0.236] [0.62] [2.983]*** [3.837]*** 1999 0,0152 0,0138 0,0143 0,0110 0,0147 0,0168 1999 0,0652 0,0651 0,0647 0,0655 0,0655 1999 0,0036 0,0000 0,0001 0,0088 0,0139 [2.198]** [2.044]** [2.149]** [1.568] [2.094]** [2.516]** [2,277]** [2.277]** [2.24]** [2.285]** [2.293]** [0,584] [-0.631] [0.206] [1.613] [1.521] 2000 0,0090 0,0099 0,0101 0,0072 0,0098 0,0107 2000 0,0668 0,0668 0,0668 0,0672 0,0653 2000 0,0042 0,0000 0,0003 0,0083 0,0119 [1.534] [1.733]* [1.805]* [1.234] [1.668]* [1.897]* [2,732]*** [2.753]*** [2.723]*** [2.749]*** [2.681]*** [0,833] [-0.209] [0.5] [1.836]* [1.57] 2001 0,0118 0,0132 0,0126 0,0102 0,0125 0,0154 2001 0,0470 0,0468 0,0469 0,0474 0,0468 2001 0,0059 0,0000 0,0007 0,0153 0,0284 [1.896]* [2.176]** [2.122]** [1.641] [1.977]** [2.554]** [1,789]* [1.792]* [1.783]* [1.816]* [1.794]* [1,111] [-0.219] [1.131] [3.211]*** [3.559]*** 2002 0,0144 0,0151 0,0148 0,0120 0,0150 0,0194 2002 0,0659 0,0663 0,0661 0,0665 0,0663 2002 0,0116 -0,0001 0,0003 0,0140 0,0117 [2.197]** [2.36]** [2.367]** [1.843]* [2.262]** [3.04]*** [2,421]** [2.459]** [2.437]** [2.463]** [2.458]** [2,048]** [-0.913] [0.474] [2.788]*** [1.382] 2003 0,0185 0,0181 0,0151 0,0139 0,0199 0,0217 2003 0,0678 0,0731 0,0692 0,0686 0,0692 2003 -0,0093 -0,0001 -0,0008 -0,0028 -0,0032 [2.848]*** [2.857]*** [2.38]** [2.163]** [3.098]*** [3.512]*** [2,503]** [2.636]*** [2.558]** [2.566]** [2.594]** [-1,662]* [-0.937] [-1.282] [-0.569] [-0.388] 2004 0,0157 0,0144 0,0124 0,0096 0,0155 0,0179 2004 0,0662 0,0682 0,0668 0,0666 0,0669 2004 -0,0001 0,0000 0,0000 0,0077 0,0074 [2.476]** [2.341]** [2.026]** [1.491] [2.419]** [2.921]*** [2,492]** [2.56]** [2.514]** [2.51]** [2.528]** [-0,025] [-0.01] [-0.038] [1.572] [0.91] 2005 0,0155 0,0160 0,0151 0,0127 0,0158 0,0192 2005 0,0728 0,0727 0,0723 0,0730 0,0724 2005 -0,0037 -0,0001 -0,0002 0,0054 0,0025 [2.489]** [2.629]*** [2.525]** [2.025]** [2.5]** [3.154]*** [2,789]*** [2.788]*** [2.741]*** [2.795]*** [2.78]*** [-0,688] [-0.929] [-0.288] [1.138] [0.313] 2006 0,0166 0,0169 0,0164 0,0139 0,0177 0,0188 2006 0,0549 0,0562 0,0554 0,0555 0,0542 2006 -0,0011 0,0000 0,0000 0,0014 0,0017 [2.584]** [2.687]*** [2.673]*** [2.19]** [2.749]*** [3.032]*** [2,027]** [2.095]** [2.062]** [2.068]** [2.017]** [-0,189] [-0.761] [-0.034] [0.27] [0.196] Takeup -0,0288 -0,0264 -0,0277 -0,0275 -0,0272 -0,0269 Takeup 0,0159 0,0173 0,0170 0,0164 0,0139 Volatility 0,0039 0,0000 0,0005 0,0017 0,0006 [-6.327]*** [-5.833]*** [-6.33]*** [-6.212]*** [-5.895]*** [-6.125]*** [0,822] [0.911] [0.888] [0.856] [0.72] [1,172] [0.463] [1.231] [0.549] [0.041] Volatility 0,0174 0,0175 0,0164 0,0167 0,0184 0,0108 Volatility 0,0112 0,0118 0,0112 0,0114 -0,0045 Pre SEO Liquidity -0,3735 -0,6837 -0,3635 -0,2335 -0,5506 [4.474]*** [4.584]*** [4.358]*** [4.418]*** [4.616]*** [1.643] [0,679] [0.71] [0.679] [0.686] [-0.172] [-5,492]*** [-11.429]*** [-5.172]*** [-3.909]*** [-2.891]*** Pre-SEO Liquidity 0,0828 0,0363 18,9657 1,0805 0,0026 0,0367 Pre SEO liquidity 0,0460 -16,5590 -0,4894 0,0088 0,2502 Proceeds -0,0013 0,0000 -0,0001 -0,0001 -0,0011 [1.366] [0.558] [2.073]** [1.132] [0.12] [0.499] [0,181] [-0.607] [-0.167] [0.099] [0.786] [-1,675]* [-0.653] [-0.761] [-0.206] [-1.06] Proceeds -0,0028 -0,0036 -0,0029 -0,0032 -0,0036 -0,0033 Proceeds -0,0092 -0,0100 -0,0097 -0,0094 -0,0089 Free float variation 0,0063 0,0000 -0,0007 -0,0077 0,0338 [-3.433]*** [-4.118]*** [-4.119]*** [-3.993]*** [-4.662]*** [-4.597]*** [-2,681]*** [-3.166]*** [-2.797]*** [-3.072]*** [-2.847]*** [0,337] [0.042] [-0.34] [-0.469] [1.216] Public Offerings 0,0098 0,0045 0,0068 0,0067 0,0080 -0,0073 acquisition 0,0490 0,0490 0,0488 0,0488 0,0494 Public Offerings -0,0071 0,0000 -0,0007 -0,0036 -0,0028 [2.743]*** [0.922] [1.859]* [1.619] [1.833]* [-1.146] [4,099]*** [4.129]*** [4.105]*** [4.097]*** [4.158]*** [-2,388]** [-1.369] [-1.936]* [-1.354] [-0.634] Standby rights 0,0102 0,0162 0,0091 0,0125 0,0131 0,0132 Public Offerings -0,0054 -0,0039 -0,0053 -0,0054 -0,0039 Standby rights -0,0055 -0,0001 -0,0006 -0,0032 -0,0030 [3.072]*** [3.4]*** [2.725]*** [3.302]*** [3.08]*** [2.461]** [-0,359] [-0.256] [-0.352] [-0.361] [-0.261] [-1,947]* [-1.77]* [-1.892]* [-1.271] [-0.7] Public Offerings*Pre SEO liquidity 0,2327 12,8957 1,5244 0,1031 0,3819 Standby rights 0,0325 0,0335 0,0324 0,0323 0,0335
[1.931]* [1.059] [1.28] [0.754] [3.233]*** [2,337]** [2.402]** [2.339]** [2.329]** [2.416]** Standby rights*Pre SEO liquidity -0,3961 -30,9239 -3,5564 -0,2830 -0,1038
[-2.174]** [-1.921]* [-2.377]** [-1.434] [-0.975]
Adjusted R² 44,87% 47,65% 49,30% 48,40% 44,58% 48,57% Adjusted R² 12,82% 13,02% 12,82% 12,81% 13,16% Adjusted R² 23,65% 49,04% 22,22% 22,21% 39,88% Wald test public/standby 0,015 6,263 0,534 2,739 1,374 11,217 Wald test public/st 7,91 7,72 7,80 7,87 7,76 Wald test public/stan 0,313 0,104 0,022 0,024 0,001 p value Wald 0,903 0.013** 0,466 0.10* 0,243 0.001*** pvalue Wald 0.006*** 0.006*** 0.006*** 0.006*** 0.006*** p value Wald 0,577 0,747 0,882 0,877 0,978 The table reports OLS regressions results. In Panel A, the dependent variable is flotation costs on gross proceeds; In Panel B, the dependent variable is CAR [-1,0] at the announcement date and in Panel C, dependent variables are abnormal liquidity measures such as abnormal spread (model 1), abnormal amihud illiquidity ratio (model 2), rescaled abnormal amihud illiquidity ratio (model 3), abnormal LOT (model 4) and abnormal Roll (model 5). Those measures were estimated as the difference between observed liquidity after the subscription [+30,+180] period and its average value over the estimation period (Pre SEO liquidity). The explanatory variables are year dummies, takeup defined as the % of the issue taken up by blockholders, volatility computed over the [-10,-5] period before the subscription period, Pre SEO liquidity measures, proceeds defined as log of gross proceeds (in million €), acquisition dummy (equals to 1 if the funds raised are used to finance a specific acquisition),free float expected variation, Public offerings and Standby rights issues dummies and interaction variables between these dummies and pre SEO liquidity. Pre SEO liquidity measures include spread (model 1) defined as the difference between the ask and bid prices divided by the spread midpoint; Amihud illiquidity ratio (model 2) estimated as 1/NΣ(|Rt|/|VOL €t|) where N is the number of non-zero trading volume days; |Rt| is the absolute return on date t and VOL€t is the euro trading volume on day t; rescaled Amihud illiquidity ratio (model 3) ca t. statistics are in brackets; *,**,*** represent the significance level of 1%, 5%, and 10% respectively.
Panel A. OLS analysis of flotation costs Panel B. OLS analysis of abnormal returns Panel C. OLS analysis of abnormal liquidity Model 1
Spread as pre SEO liquidity