Actuarial balance sheets as a
tool to assess the sustainability
of social security
pension systems
Assia Billig and Jean-Claude Ménard
Office of the Chief Actuary, Ottawa, CanadaAbstract The choice of the methodology used to produce a
social security pension system’s balance sheet is mainly deter-mined by the system’s financing approach. In this article, it is shown using the example of the Canada Pension Plan that if the assessment of the financial sustainability of a pay-as-you-go or partially funded system is done through the means of an actuarial balance sheet, then the methodology used should take into account future contributions of current and future participants. The balance sheets produced using the open group approach, as well as methodologies used in United States and Sweden, are discussed.
Keywords social security scheme, pension scheme, method
of financing, actuarial valuation, Canada, Sweden, United States
Addresses for correspondence: Assia Billig, Office of the Chief Actuary (OCA), Office of the Superin-tendent of Financial Institutions, 255 Albert Street, 12th Floor, Ottawa, Ontario K1A 0H2, Canada; Email: [email protected]. Jean-Claude Ménard, Office of the Chief Actuary, Office of the Super-intendent of Financial Institutions, 255 Albert Street, 12th Floor, Ottawa, Ontario K1A 0H2, Canada; Email: [email protected].
This article is derived from a recent Actuarial Study published by the Office of the Chief Actuary (OSFI, 2012), and both authors were part of the working team for this Actuarial Study.
The authors would like to thank the OCA staff who assisted in the preparation of the original Actuarial Study as well as this article. The authors would also like to express their gratitude to Ole Settergren for answering questions regarding the Inkomstpension system and providing valuable feedback, and to Alice Wade for answering questions regarding the United States OASDI programme.
Introduction
This article addresses the methodologies used to produce actuarial balance sheets for social security pension systems. The balance sheet is often a useful measure of the financial position of the pension system. The balance sheet results are relatively easy to explain, and this concept is widely used for pension plans other than social security systems. At the same time, the balance sheet can produce very misleading results if the proper methodology is not used.
The choice of the methodology used to produce a social security pension sys-tem’s balance sheet is mainly determined by the syssys-tem’s financing approach. For fully funded systems, the accrued liabilities are assumed to be funded in advance; therefore, balance sheets under closed groups (i.e. that take into account current contributors only) with or without future accruals are appropriate for such plans. In contrast, pay-as-you-go (PAYG) and partially funded systems represent social contracts where, in any given year, current contributors allow the use of their contributions to pay current beneficiaries’ benefits. As a result, such social con-tracts create a claim for current and past contributors to contributions of future contributors. The proper assessment of the financial sustainability of a social security PAYG or partially funded system by means of its balance sheet should take these claims into account. The traditional closed group methodologies do not reflect these claims since only current participants are considered. In com-parison, the open group approach accounts explicitly for these claims by consid-ering the benefits and contributions of both current and future plan participants (OSFI, 2012).
Another example of the balance sheet approach that takes into account the par-tially funded nature of the pension system is the balance sheet of the Swedish Inkomstpension system. While this balance sheet is based on the closed group approach, its assets side includes the so-called contribution asset that accounts for future contributions as a major source of the system’s financing.
It should be noted that the recent International Actuarial Association (IAA) exposure draft, the International Standard of Actuarial Practice – Valuation of Social
Security Programs, promotes the concept of choosing the balance sheet
methodol-ogy based on the programme’s financing approach (IAA, 2012).
In this article, the different balance sheet methodologies are applied to the Canada Pension Plan (CPP or the “Plan”), the partially funded second pillar of the Canadian retirement income system. Before doing so, an overview of the Canadian retirement income system is presented and the financing of the Canada Pension Plan discussed. In turn, we will look at the closed and open group meth-odologies with the emphasis on the open group balance sheet. Finally, we will con-clude by discussing the United States methodology (the actuarial balance) and the Swedish methodology (the balance sheet including the contribution asset).
Canadian retirement income system
Canada’s retirement income system is based on a diversified approach to savings in terms of the sources (private and public), coverage (mandatory and volun-tary), and the financing methodology (PAYG, partial funding, or full funding). The Canadian system rests upon three pillars. Pillar one is the Old Age Security (OAS) programme that provides a universal basic benefit payable at age 65 based on citizenship and years of residence. The OAS programme is financed on a pure PAYG basis from Government tax revenues. The second mandatory pillar consists of the earnings-related Canada and Québec Pension Plans (CPP and QPP). The CPP and QPP are sister plans that both came into effect on 1 January 1966, and are deemed to be equivalent. Both plans provide a retirement pension, as well as disability, death, survivor, and children’s benefits. The CPP covers virtually all Canadians between the ages of 18 and 70 working outside of the province of Québec, while those working in Québec are covered by the QPP. Both plans are financed by employer and employees contributions, and also by investment earn-ings. Funds not immediately required to pay benefits are invested in the markets by the respective plans’ fund managers – the CPP Investment Board (CPPIB) and the Caisse de Dépôt et Placement du Québec. Therefore, these plans are partially funded.
In Canada, the first two pillars replace about 40 per cent of pre-retirement earn-ings for individuals with earnearn-ings at the average level. Such a replacement rate is consistent with the International Labour Organization’s Social Security (Minimum Standards) Convention, 1952 (No. 102).
The third pillar of the Canadian retirement income systems is a voluntary one, and consists of all private savings, which are expected to be fully funded. It includes tax-deferred employer-sponsored pension plans, as well as individual savings plans such as Registered Retirement Savings Plans and Tax-Free Savings Accounts.
The diversification of the Canadian system through its mix of public and private pensions and different levels of funding mitigates the multitude of risks to which the system and individuals’ retirement incomes are exposed. As stated by the Organisation for Economic Co-operation and Development (OECD): “Taking the long view, a diversified pension system – mixing public and private provision, and pay-as-you-go and pre-funding as sources of finances – is not only the most realistic prospect but the best policy” (OECD, 2011).
Canada Pension Plan
The CPP was initially established as a PAYG plan with a small reserve and a com-bined employer-employee contribution rate of 3.6 per cent of covered earnings. A
set of major changes introduced in 1998 modified, in particular, the financing approach from a PAYG basis to a hybrid of PAYG financing and full funding, called “steady-state funding”. This partial funding approach has resulted in a greater reserve of assets accumulating over time. Steady-state funding involves a steady-state contribution rate that is the lowest rate sufficient to ensure both the stabiliza-tion of the ratio of assets to the following year’s expenditures over time and the long-term financial sustainability of the Plan without recourse to further rate increases. Another change introduced in 1998 was the requirement that any benefit improvements or new benefits for the Plan be fully funded. The sum of the steady-state rate and the incremental full funding rate is called the minimum contribu-tion rate. The current CPP legislated combined employer-employee contribucontribu-tion rate is 9.9 per cent of covered earnings and it has been the same over the past decade.
Actuarial valuation reports on the CPP are prepared every three years. These reports determine a minimum contribution rate and show projections of the Plan’s contributions, expenditures and assets for the next 75 years. Each actuarial valuation report is based on a number of best-estimate assumptions that reflect the best judgment of the Chief Actuary of the CPP as to future demographic and economic conditions. The latest report is the Twenty-Fifth Actuarial Report on the
CPP as at 31 December 2009 (the 25th CPP Actuarial Report) (OSFI, 2010b). A set
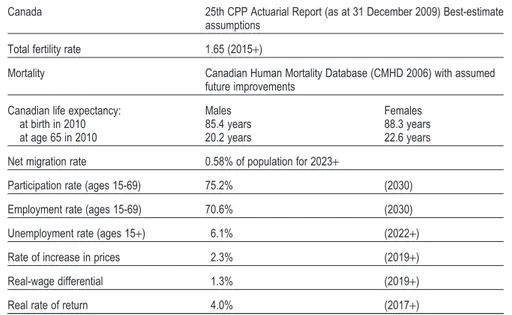
of the best-estimate assumptions of this report is presented in Table 1. The main findings in this article are based on these assumptions.
The 25th CPP Actuarial Report determined the minimum contribution rate to be 9.86 per cent, i.e. below the legislated contribution rate. Table 2 shows the pro-jected financial status of the CPP on the basis of this report using the legislated contribution rate of 9.9 per cent. It can be seen that, although net cash flows are projected to turn negative, investment earnings will be more than sufficient to cover the shortfall. The PAYG rate, which equals the contribution rate required to fully meet expenditures in a given year (that is, the ratio of expenditures to con-tributory earnings) reaches a level of 10.9 per cent in 2050. The excess resulting from the legislated rate of the Plan (9.9 per cent) over the minimum contribution rate (9.86 per cent) allows for the Plan’s assets to grow more quickly (OSFI, 2010b).
Canada Pension Plan actuarial balance sheet
The key financial measure for evaluating the Canada Pension Plan is the minimum contribution rate, specifically, its adequacy and stability over time. However, a number of indicators may be used to assess the CPP’s financial sustainability. One of these measures is the actuarial balance sheet, i.e. a summary of the scheme’s
assets and liabilities. It is especially favoured by some experts involved in assessing the financial sustainability of a pension scheme (for instance, accountants and economists) due to its prevalence in fully funded pension systems. This section examines and compares the assets and obligations (liabilities) of the CPP derived using different closed and open group methodologies. Two indicators of the Plan’s financial status are presented for each methodology: the difference between the Plan’s assets and its liabilities (this difference is termed “asset excess”, if positive, or “asset shortfall”, if negative) and the Plan’s total assets as a percentage of its liabili-ties. Both measures provide an indication of the extent to which the Plan’s obliga-tions are covered by its assets.
A closed group includes only current participants of a plan, with no new entrants permitted, while, an open group includes all current and future partici-pants of a plan. Two types of closed groups are discussed in this section: a closed group without future benefit accruals for the group’s members, and a closed group with future accruals for its members.
In the past, the CPP actuarial reports presented the CPP actuarial balance sheets; however, the methodology used to produce these balance sheets evolved over time. The most significant changes took place after the Twenty-Third
Actu-arial Report on the Canada Pension Plan as at 31 December 2006 (the 23rd CPP
Table 1. Best-estimate demographic and economic assumptions of the 25th CPP
Actuarial Report
Canada 25th CPP Actuarial Report (as at 31 December 2009) Best-estimate
assumptions
Total fertility rate 1.65 (2015+)
Mortality Canadian Human Mortality Database (CMHD 2006) with assumed
future improvements
Canadian life expectancy: Males Females
at birth in 2010 85.4 years 88.3 years
at age 65 in 2010 20.2 years 22.6 years
Net migration rate 0.58% of population for 2023+
Participation rate (ages 15-69) 75.2% (2030)
Employment rate (ages 15-69) 70.6% (2030)
Unemployment rate (ages 15+) 6.1% (2022+)
Rate of increase in prices 2.3% (2019+)
Real-wage differential 1.3% (2019+)
Real rate of return 4.0% (2017+)
Source: Adapted from OSFI (2010b).
Ta b le 2 . P ro jected financ ial status of the CPP (best-est imate sce nar io of the 25th CPP A ctuar ial R epor t, Canadian dollars (CAD) million) Year PAYG rate Contribution rate Contributions Expenditures Net cash flow Investment income 2 Assets at 31 Dec. 3 Yield Asset/expenditure ratio (%) (%) (CAD) 1 (CAD) (CAD) (CAD) (CAD) (%) 2010 8.65 9.90 36,862 32,192 4,670 2,391 133,897 1.80 3.94 2015 9.40 9.90 45,104 42,809 2,295 11,571 197,330 6.12 4.37 2020 9.83 9.90 55,983 55,608 375 16,646 275,099 6.31 4.68 2030 10.78 9.90 85,193 92,803 -7,610 28,444 464,687 6.34 4.79 2040 10.73 9.90 130,283 141,263 -10,980 44,686 733,329 6.31 4.98 2050 10.94 9.90 195,398 215,909 -20,511 71,427 1,169,230 6.33 5.18 Notes: 1.CAD 1 is approximately equal to USD 1. 2. Investment income includes both realized and unrealized gains and losses. 3. As at 30 June 2012, the investment portfolio of the CPP totalled CAD 165.8 billion, and 60 per cent of the portfolio was invested outside of Canada. Source: Adapted from OSFI (2010b). 36
Actuarial Report). The 23rd CPP Actuarial Report showed the actuarial balance sheet on a closed group without future accrual basis, and, not surprisingly, the liabilities significantly exceeded the available assets (OSFI, 2007). The indepen-dent peer reviewers of this report commented on the misleading nature of the CPP closed group. They noted that the closed group balance sheet is “appropriate for systems that have full funding as an objective. However, the CPP’s primary funding objective is steady-state funding, with full funding only for benefit increases. [. . .] The inclusion of items such as a balance sheet suggest to the casual reader that the CPP’s funding is hopelessly inadequate, which is simply not true. The meaningful measure is the adequacy and sustainability of the 9.9 per cent contribution rate, not the funded percentage” (Campbell, Flanagan and Levy, 2008).
As a result, the Office of the Chief Actuary prepared Actuarial Study No. 8, where the application of the open group balance sheet to the CPP was explored (OSFI, 2010a). Following the publication of this study, the Plan’s balance sheet based on an open group methodology was included in the 25th CPP Actuarial Report (OSFI, 2010b), as well as the Annual Report of the Canada Pension Plan
2010-2011 (HRSDC, 2011) and the Public Accounts of Canada 2010-2011
(Government of Canada, 2011).
Notes on the methodology
For all balance sheets discussed in this article, it is assumed that future contribu-tions are determined using the current legislated contribution rate of 9.9 per cent of covered earnings. For the purpose of determining actuarial liabilities and assets, the future inflows and outflows are discounted using the assumed nominal rate of return on the invested CPP assets, unless otherwise specified. This nominal rate is determined to be 6.3 per cent ultimately (4.0 per cent real) under the assumption that the assets of the Plan are invested in the best-estimate portfolio of the 25th CPP Actuarial Report (ultimately 42 per cent equity, 40 per cent fixed income securities, and 18 per cent inflation-sensitive assets, such as real estate and infra-structure) (OSFI, 2010b). It could be argued that it is not appropriate to determine the Plan’s liabilities and assets using the expected rate of return on invested assets, since the CPP is a partially funded plan largely financed by future contributions. The use of alternative discount rates based on the growth of the contributory base is addressed later in this article.
Another important element of the methodology is the length of the projection period. The Canada Pension Plan legislation specifies that the CPP actuarial report should present financial information for at least a 75-year period following the valuation date. For a closed group with or without future accruals, the balance sheet based on the projection of future contributions and expenditures for a
75-year period presents an accurate picture since it includes all future contribu-tions and expenditures associated with the group’s participants. Alternatively, the use of a 75-year projection period for the open group balance sheet could be viewed as insufficient. Limiting the projection period to 75 years excludes from the liabilities part of the future expenditures for cohorts that will enter the labour force during the projection period; however, most of the contributions for these cohorts are included in the assets. This imbalance could lead to a perceived better financial position. The United States 2010 Annual Report of the Board of Trustees of
the Federal Old-Age and Survivors Insurance and Federal Disability Insurance Trust Funds (the Trustees’ Report) states that “the overemphasis on summary measures
(such as the actuarial balance and open group unfunded obligation)1 for the 75-year period can lead to incorrect perceptions and policies that fail to address financial sustainability for the more distant future” (OASDI, 2010). Thus, in this article the cash flows are projected over an extended time period of 150 years. It should be noted however that, while enhancing the assessment of the financial sus-tainability, increasing the length of the projection period also increases the uncer-tainty of projections.
For all balance sheet approaches examined in this article it is assumed that for beneficiaries, benefits received are increased annually in line with inflation only, as provided under the current Plan. In addition, projected expenditures include administrative expenses.
Closed group without future accruals
“Closed group without future accruals” methodology assumes that no new entrants to the Plan are permitted. Furthermore, current plan participants who are not receiving benefits at the valuation date are assumed to make no further contri-butions beyond that date, and hence accrue no future benefits.
Contributors’ projected benefits are calculated by increasing pensionable earn-ings prior to the valuation date in line with wages and by assuming zero future pensionable earnings. The resulting projected expenditures are then discounted to determine their present value. This is the actuarial liability of the Plan under the closed group without future benefit accruals approach. The assets under this approach consist of the Plan’s current assets.
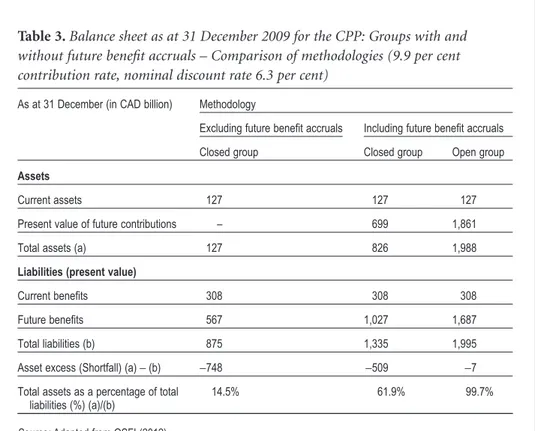
Under this methodology, the Plan’s asset shortfall is CAD 748 billion with the total assets representing 14.5 per cent of the actuarial liabilities as at 31 December 2009, as shown in Table 3.
1. The term “unfunded obligation” refers to the difference between plan’s obligations and assets, i.e. this is the opposite of the asset excess or shortfall.
As a result of the 1998 CPP amendments, the CPP has been moving away from pure PAYG financing (with a small contingency reserve) towards partial funding. At the same time, full funding of the Plan was never intended by the stakeholders. The balance sheet under the closed group methodology does not reflect the nature of the partial financing approach where future contributions represent a major source of financing of future expenditures. Therefore, it is inappropriate to reach a conclusion regarding the Plan’s long-term financial sustainability considering the asset shortfall or excess under the closed group balance sheet.
Closed group with future accruals
For this analysis, it is assumed that the CPP remains open to current partici-pants, but with no new entrants. Thus, current Plan contributors continue to contribute and to accrue benefits with future salary increases in line with wage increases.
As a result, the obligations side of the balance sheet includes the present value of future expenditures for current Plan participants, while the assets side includes the present value of their future contributions in addition to the CPP’s current
Table 3. Balance sheet as at 31 December 2009 for the CPP: Groups with and
without future benefit accruals – Comparison of methodologies (9.9 per cent contribution rate, nominal discount rate 6.3 per cent)
As at 31 December (in CAD billion) Methodology
Excluding future benefit accruals Including future benefit accruals
Closed group Closed group Open group
Assets
Current assets 127 127 127
Present value of future contributions – 699 1,861
Total assets (a) 127 826 1,988
Liabilities (present value)
Current benefits 308 308 308
Future benefits 567 1,027 1,687
Total liabilities (b) 875 1,335 1,995
Asset excess (Shortfall) (a)- (b) -748 -509 -7
Total assets as a percentage of total liabilities (%) (a)/(b)
14.5% 61.9% 99.7%
Source: Adapted from OSFI (2012).
assets. The asset shortfall under this methodology as at 31 December 2009 is CAD 509 billion. This balance sheet is presented in Table 3 together, for compari-son, with the closed group without future accruals methodology and the open group methodology, discussed next.
Once again, this methodology is not consistent with the partial funding financ-ing approach since it only takes into account assets and contributions of current contributors as a source of financing for future expenditures.
Open group
An open group includes all current and future participants of a plan, where the plan is considered to be ongoing into the future, that is, over an extended time horizon. This means that future contributions of current and new participants and their associated benefits are included in order to determine whether current assets and future contributions will be sufficient to pay for all future expenditures.
The actuarial liability of the Plan under the open group approach is equal to the present value of future projected expenditures with respect to the current and future Plan participants. The assets of the Plan under this approach are the sum of the present value of future projected contributions of current and future contribu-tors and the Plan’s current assets. The asset shortfall under the open group meth-odology as at 31 December 2009 is CAD 7 billion and the total assets covers 99.7 per cent of the actuarial liabilities.
In our opinion, if the Plan’s financial sustainability is to be measured based on its asset excess or shortfall, it should be done on an open group basis. The inde-pendent peer review panel concurred with this statement in the 25th CPP Actu-arial Report: “The Plan is intended to be long-term and enduring in nature, a fact that is reinforced by the federal, provincial and territorial governments’ steward-ship through the established strong governance and accountability framework of the Plan. Thus, an open group valuation that emphasizes the long-term nature of the Plan could be deemed to be the most appropriate” (Andrews, Brown, and McGillivray, 2011). The inclusion of future contributions and benefits with respect to both current and future participants in the assessment of the CPP’s financial status confirms that the Plan is able to meet its financial obligations and is sustain-able over the long term.
Table 3 shows that the closed group without future accrual approach results in the largest asset shortfall. This is because there are no future contributions to the Plan as well as no future accruals. Under the best-estimate assumptions, the present value of future contributions, either for only current or for both current and future participants, exceeds the present value of the associated future benefits. As a result, the asset shortfall decreases when future accruals are taken into account. At the same time, a substantial shortfall still exists under the closed group
with accrual, since this approach does not fully account for future contributions as a major source of financing of the Plan.
Further discussion of the open group approach –
modified open group balance sheet
The partial funding of the CPP may be examined in greater detail by viewing the open group balance sheet in a modified form. The idea is to show the PAYG and funded components of the Plan, with their respective assets and liabilities, sepa-rately. The resulting modified balance sheet emphasizes the hybrid nature of partial funding and allows for a better understanding of how future expenditures are financed. Under the partial funding, part of a current year’s expenditures is financed from the same year’s contributions, forming the PAYG component of the Plan. The remaining expenditures, if any, are covered using the underlying pension fund from the funded component of the Plan. Although there is a funded component to steady-state funding, its goal is not to fully fund the CPP. Rather, by stabilizing the asset/expenditure ratio, steady-state funding ensures that the Plan’s contributions remain the primary source for covering the Plan’s expenditures.
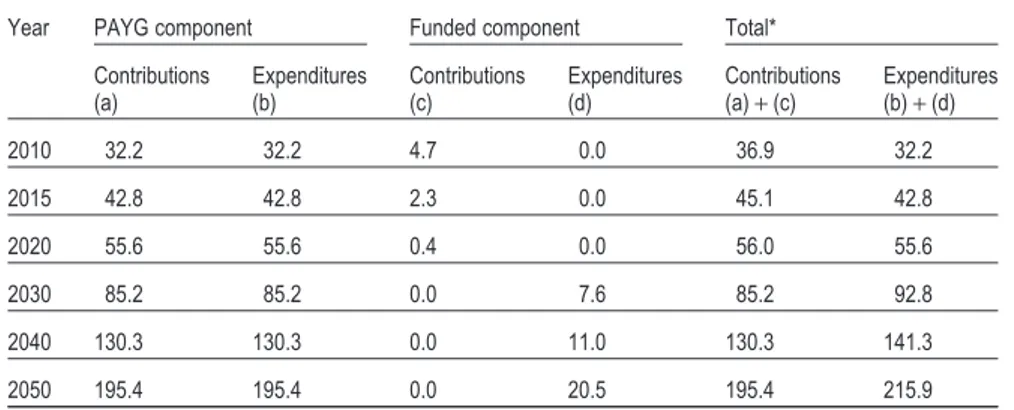
The allocation of the projected contributions and expenditures to the PAYG and the funded components of the CPP is shown in Table 4. By definition, the PAYG component’s contributions and expenditures are exactly the same every year. Con-tributions for the funded component exist as long as the current year’s contribu-tions exceed the same year’s expenditures. These excess contribucontribu-tions are added to
Table 4. Splitting of CPP contributions and expenditures into PAYG and funded
components (9.9 per cent contribution rate, CAD billion)
Year PAYG component Funded component Total*
Contributions (a) Expenditures (b) Contributions (c) Expenditures (d) Contributions (a)+ (c) Expenditures (b)+ (d) 2010 32.2 32.2 4.7 0.0 36.9 32.2 2015 42.8 42.8 2.3 0.0 45.1 42.8 2020 55.6 55.6 0.4 0.0 56.0 55.6 2030 85.2 85.2 0.0 7.6 85.2 92.8 2040 130.3 130.3 0.0 11.0 130.3 141.3 2050 195.4 195.4 0.0 20.5 195.4 215.9
Note: * As shown in Table 2. Source: Adapted from OSFI (2012).
the Plan’s assets, which are invested by the CPPIB. Since the 25th CPP Actuarial Report projects that contributions will exceed expenditures up to and including the year 2020, the funded component’s contributions exist during this period. Starting in 2021, the expenditures are then projected to be higher than contribu-tions (OSFI, 2010b). These excess expenditures are in turn allocated to the funded component of the Plan, and are financed by the invested assets.
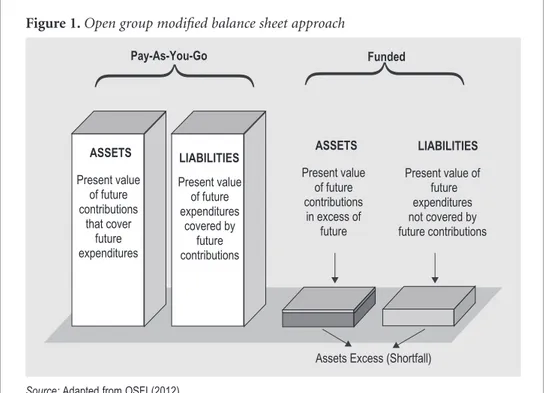
The open group balance sheet then can be modified as follows:
• On the assets side, the present value of future contributions is broken down into two parts: the present value of future contributions that cover future expendi-tures (PAYG component future contributions shown in column (a) of Table 4) and the present value of future contributions in excess of future expenditures, which are invested (funded component future contributions shown in column (c) of Table 4);
• On the liabilities side of the balance sheet, the present value of future expendi-tures is similarly broken down into the present value of future expendiexpendi-tures covered by future contributions (PAYG component future expenditures shown in column (b) of Table 4) and the present value of future expenditures not covered by future contributions and therefore financed by the invested assets (funded compo-nent future expenditures shown in column (d) of Table 4).
As the second step, the PAYG and funded components are separated in the open group balance sheet. Figure 1 illustrates the structure of the open group modified balance sheet.
It can be seen clearly that no asset excess or shortfall ever exists with respect to the PAYG component. Under PAYG financing, while both the present values of the contributions and expenditures could vary depending on past experience and future actuarial assumptions, they will always remain equal. Under the funded component, an asset shortfall results when the funded component’s total assets, consisting of the invested assets and the present value of future contributions in excess of future expenditures, are not sufficient to pay the future expenditures not covered by future contributions. In the case of the CPP, the asset shortfall is CAD 7 billion (under the best-estimate scenario).
Breaking down the open group balance sheet into PAYG and funded compo-nents raises questions regarding which discount rate should be used to determine present values. So far in this article, all present values were determined using a dis-count rate equal to the expected nominal rate of return on the invested CPP assets. A similar methodology is used for the Trustees’ Reports on the OASDI programme in the United States, where the open group balance sheet entries are determined by discounting the programme’s future contributions and expenditures using the effective yield on the trust fund assets (OASDI, 2010). However, in a partially funded plan, the cash flows of the PAYG component are not invested and depend on demographic and economic factors other than market returns. Therefore, it
could be argued that the use of the expected return on the invested CPP assets as a discount rate for the PAYG component is not necessarily appropriate.
It is desirable for the discount rate used to determine the present values of future cash flows of a pension system to be connected to the growth in the system’s financing base. Mikula and Settergren (2005) suggest that for a pure PAYG system financed by contributions only, such a discount rate is equal to the growth in the contributory base. The financing base of a partially funded system, such as the CPP, has two components: future contributions (contributory base) and invested assets of the system. As such, discounting the cash flows of the PAYG component using the growth in the contributory base and discounting the cash flows of the funded component using the expected return on the invested CPP assets represent a logical choice.
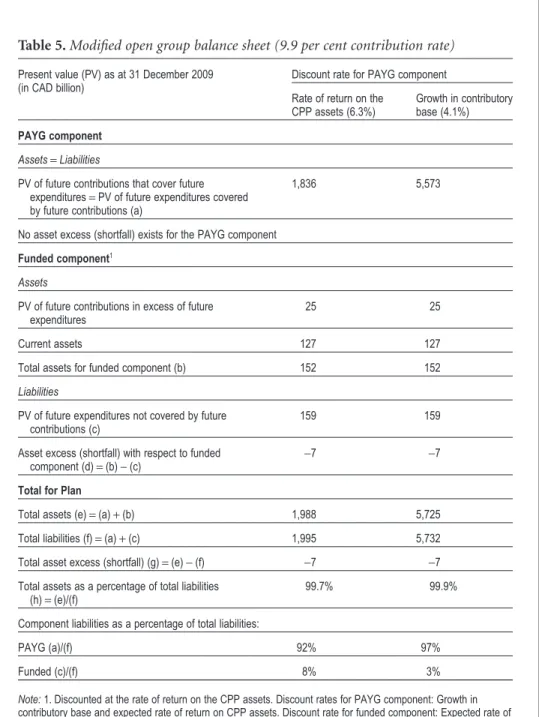
The nominal growth in the contributory base is a combination of three compo-nents: growth in the real-wage differential, inflation and growth in the number of contributors. Under the best-estimate assumptions of the 25th CPP Actuarial Report, the ultimate nominal growth in the contributory base is 4.1 per cent, or 1.8 per cent in real terms (OSFI, 2010b). Table 5 presents a modified open group balance sheet as at 31 December 2009 with the PAYG component’s cash flows dis-counted either with the expected rate of return on the CPP assets (totals as pre-sented in Table 3) or with the growth in the contributory base. The funded
Figure 1. Open group modified balance sheet approach
LIABILITIES Present value of future expenditures covered by future contributions LIABILITIES Present value of future expenditures not covered by future contributions ASSETS Present value of future contributions that cover future expenditures ASSETS Present value of future contributions in excess of future Funded Pay-As-You-Go
Assets Excess (Shortfall)
Table 5. Modified open group balance sheet (9.9 per cent contribution rate) Present value (PV) as at 31 December 2009
(in CAD billion)
Discount rate for PAYG component Rate of return on the
CPP assets (6.3%)
Growth in contributory base (4.1%)
PAYG component
Assets= Liabilities
PV of future contributions that cover future expenditures= PV of future expenditures covered by future contributions (a)
1,836 5,573
No asset excess (shortfall) exists for the PAYG component
Funded component1 Assets
PV of future contributions in excess of future expenditures
25 25
Current assets 127 127
Total assets for funded component (b) 152 152
Liabilities
PV of future expenditures not covered by future contributions (c)
159 159
Asset excess (shortfall) with respect to funded component (d)= (b) - (c)
-7 -7
Total for Plan
Total assets (e)= (a) + (b) 1,988 5,725
Total liabilities (f)= (a) + (c) 1,995 5,732
Total asset excess (shortfall) (g)= (e) - (f) -7 -7
Total assets as a percentage of total liabilities (h)= (e)/(f)
99.7% 99.9%
Component liabilities as a percentage of total liabilities:
PAYG (a)/(f) 92% 97%
Funded (c)/(f) 8% 3%
Note: 1. Discounted at the rate of return on the CPP assets. Discount rates for PAYG component: Growth in
contributory base and expected rate of return on CPP assets. Discount rate for funded component: Expected rate of return on CPP assets.
Source: Adapted from OSFI (2012).
component’s cash flows are always discounted using the rate of return on the invested CPP assets (ultimate real rate of return of 4.0 per cent or nominal rate of return of 6.3 per cent).
Since the rate of growth in the contributory base is lower than the assumed rate of return on the CPP assets, the PAYG component assets and liabilities are much higher than if the rate of growth in the contributory base were used as the dis-count rate. However, since the Plan’s asset excess or shortfall is generated only by the funded component, it remains the same regardless of which discount rate is used for the PAYG component. Therefore, although the total Plan’s liabilities increase significantly from CAD 2 trillion to CAD 5.7 trillion, a similar increase is observed on the assets side of the balance sheet. Thus, the asset shortfall remains at CAD 7 billion.
The decomposition of the CPP into the PAYG and funded components provides insights into the nature of the risks to which the CPP is exposed. Both the PAYG and funded components are subject to demographic and economic risks. The PAYG component, however, is not exposed to financial market risk since the asso-ciated cash flows are not invested.2This is in contrast to the funded component, which is subject to financial market risk since its assets are invested. It is important for this additional risk to the funded component, and hence to the Plan as a whole, to be taken into account in considering both the short-term and long-term finan-cial sustainability of the Plan.
While the funded component may appear to be small (its share of the total obli-gations is shown in Table 5 to be between 3 per cent and 8 per cent, depending on the discount rate scenario), the impact of the Plan’s exposure to the financial market risk on the stability of the CPP contribution rate should not be underesti-mated. Both short-term and long-term negative market experiences could result in an increase in the minimum contribution rate above the legislated rate of 9.9 per cent, as illustrated in the “Uncertainty of Results” section of the 25th CPP Actu-arial Report (OSFI, 2010b).
Balance sheet measures used
in the United States and Sweden
This section discusses balance sheet measures used in the assessment of the long-term financial sustainability of the Old-Age, Survivors and Disability Insurance
2. The PAYG component’s contributions and benefits may become affected if CPP’s benefits and/or contributions are altered as a result of the financial market performance. It is also true for systems that possess automatic balancing mechanisms, the application of which is contingent on the value of system’s assets.
programme in United States and the Inkomstpension system in Sweden. These two national programmes have a different design; however they have a similar financ-ing principle – both schemes are PAYG programmes with a fund. While the balance sheet measures discussed below are very different, both measures reflect the nature of the financing of these programmes. For illustration purposes, these measures are applied to the CPP. Although it is instructive to examine the financial position of the CPP using these alternative measures, the main indicator of the CPP’s financial sustainability remains the steady-state contribution rate, in par-ticular, its adequacy and stability over time.
United States Old-Age, Survivors and Disability Insurance
(OASDI) programme
The United States OASDI programme is an earnings-related defined benefit social security programme that provides old-age, survivor and disability benefits to insured participants. Similar to the CPP, the benefits are based on adjusted career-average earnings. The programme is financed mainly on a PAYG basis with trust funds aimed at covering short-term fluctuations.
The Annual Reports of the Board of Trustees of the Federal Old-Age and Sur-vivors Insurance and Federal Disability Insurance Trust Funds in the United States analyze the financial sustainability of the OASDI programme using several balance sheet measures based on the open group approach; that is, projections of incomes, expenditures and contributory earnings take into account current and future OASDI programme participants. A primary measure used in the Trustees’ Reports is called the actuarial balance. In addition, these reports present the pro-gramme’s open group unfunded obligation using the 75-year and infinite projec-tion periods.
The actuarial balance is the difference between present values of annual incomes and expenditures over a selected projection period expressed as a percent-age of the present value of contributory earnings over the same period. An actu-arial balance of zero for any period indicates that the estimated cost for the period is met, on average, with assets remaining at the end of the period equal to the fol-lowing year’s expenditures. On the contrary, a negative actuarial balance indicates that, over the period, the income to the programme combined with existing assets is not sufficient to cover the programme expenditures.
The long-term actuarial balance in the Trustees’ Reports is determined over a 75-year period, and the present values used to determine the components of the actuarial balance are based on the effective yield on the trust funds assets. The ulti-mate assumed nominal effective yield as of 31 December 2009 is 5.7 per cent (2.9 per cent real) (OASDI, 2010). This discount rate is based on the assumptions that the trust funds assets are invested in United States Treasury securities.
Table 6 presents the actuarial balance of the OASDI programme over a 75-year horizon as at 31 December 2009 and compares it with the actuarial balance of the CPP. The CPP figures are calculated using the expected rate of return on the CPP assets invested in the diversified portfolio.
The negative actuarial balance of the OASDI programme is an indicator that the programme in its current form is not financially sustainable over the long term. At the same time, applying the actuarial balance measure to the CPP con-firms its financial sustainability under the current legislation and best-estimate assumptions.
Inkomstpension system in Sweden
The Swedish Inkomstpension system is an earnings-related notional defined con-tribution (NDC) scheme that maintains individual notional accounts for the scheme’s participants. These accounts increase every year with new contributions and are indexed using the income index determined on the basis of the growth in average income. At retirement, the accumulated individual notional account is converted into an annuity.
Table 6. Components of 75-year actuarial balance (2010-2084) best-estimate
assumptions (9.9% contribution rate for the CPP)
Item OASDI1 CPP
Present value as at 31 December 2009 (in $ billions)2
Contribution revenue (income) (a) 40,118 1,533
Plan expenditures (b) 48,065 1,609
Income minus plan expenditures (c)= (a) - (b) -7,947 -76
Fund assets at start of period (d) 2,540 127
Open group asset excess (shortfall) (e)= (d) + (c) -5,407 51
Ending fund target (f) 441 10
Open group asset excess (shortfall) minus ending fund target (g)= (e) - (f) -5,848 41
Contributory earnings (h) 304,530 14,978
Percent of contributory earnings
Actuarial balance (100 x g⫼ h) -1.92%3 0.27%
Notes:
1. OASDI (2010), p. 63, Table IV.B5. 2. CAD for the CPP and USD for the OASDI.
3. In the most recent 2012 Trustees’ Report, the 75-year actuarial balance for the period 2012-2086 under the intermediate assumptions is determined to be-2.67 (OASDI, 2012).
Source: Adapted from OSFI (2012).
The Inkomstpension is a PAYG social security scheme with a buffer fund where pension contributions received are used to pay pension disbursements for the same year. Differences between contributions received and pensions paid are trans-ferred to the buffer fund.
The financial sustainability of the Inkomstpension system is assessed through the means of a modified closed group without future accruals balance sheet. Unlike the traditional closed group without future accruals balance sheet discussed earlier, the modified one includes a “contribution asset” on the assets side in addi-tion to the assets held in the buffer fund. As discussed, pure PAYG as well as par-tially funded systems by design do not possess a fund sufficient to cover the system’s liabilities. The concept of the contribution asset developed in Sweden rec-ognizes that a PAYG or partially funded system does not have any legal require-ment to hold assets to fully guarantee its liabilities. Since such a system relies on contributions as a major source of its financing, it implies that the flow of future contributions represents an asset for the system (OSFI, 2012).
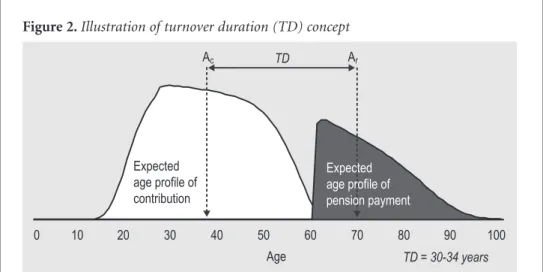
The contribution asset is determined as the product of the most recent year’s contributions to the system and the average time during which the obligations generated by these contributions are expected to remain in the system. This time is called the “turnover duration”. Figure 2 illustrates this concept. The white area on the left-hand side of the figure corresponds to the distribution of contributions for a given year by age of contributors. The black area on the right-hand side of the figure corresponds to the distribution of benefits for the same year by age of ben-eficiaries. The turnover duration is the difference between the benefit-weighted average age of beneficiaries (Ar) and the contributions-weighted average age of contributors (Ac). It is based on the profile of the system’s participants at the time
Figure 2. Illustration of turnover duration (TD) concept
0 10 20 30 40 50 60 70 80 90 100 Expected age profile of contribution Expected age profile of pension payment Ac TD Ar Age TD = 30-34 years
Source: Settergren (2009a).
of the valuation. It could also be interpreted as the sum of the expected pay-in and pay-out durations.
The ratio of the assets to the liabilities is called the balance ratio, and this balance ratio serves as a trigger for the application of an automatic balance mecha-nism. If this ratio is less than one, the automatic balance mechanism is activated, whereby the indexation of accounts and pensions in pay is reduced in order to restore the financial sustainability of the system. When the balance ratio reverses to values higher than one, the automatic balance mechanism allows for indexation at a rate higher than the change in the income index. This period of higher index-ation lasts until the cumulative indexindex-ation reaches the level where it would have been if the automatic balancing had never been applied.
For more details on the Swedish system accounting and the operation of the automatic balance mechanism, the reader is referred to Settergren (2001), Mikula and Settergren (2005), Settergren (2009b), and the Swedish Pension Agency (2010).3
Table 7 presents the balance sheet for the Inkomstpension as at 31 December 2009, as well the CPP modified closed group without future accruals balance sheet that takes into account the contribution asset. At the end of the 2009, the financial position of the Inkomstpension system was close to 96 per cent.
It should be noted that the Swedish methodology of assessing the financial sus-tainability of the Inkomstpension system cannot be applied automatically to the CPP. The main reason is that there are major differences in the designs of the two plans, the Inkomstpension being an NDC system, and the CPP being a defined benefit plan. The nature of an NDC system, the indexation provisions of the Inko-mstpension system, as well as the automatic balance mechanism, minimize the need for actuarial projections and, therefore, minimize the number of assumptions that should be made for the future. This is not the case for defined benefit plans, including the CPP, where the assessment of the Plan’s financial sustainability is based on extensive actuarial projections. At the same time, it is interesting to examine the Swedish balance sheet applied to the CPP, since the introduction of the contribution asset on the assets side of the closed group without future accru-als balance sheet takes into account the partially funded nature of the CPP.
The calculations for the CPP are performed using the best-estimate assump-tions of the 25th CPP Actuarial Report with the exception of the discount rate. Since the calculation of the contribution asset is based on future contributions, a discount rate equal to the growth in the contributory base appears to be the most appropriate choice. In attempting to apply the notion of a contribution asset to a
3. The “Orange Report” of the Swedish Pension Agency is published annually and provides detailed information on the financial status of the Inkomstpension.
partially funded defined benefit plan’s balance sheet, several simplifications were made. For more details on the underlying assumptions the reader is referred to
Actuarial Study No. 10 (OSFI, 2012).
Table 7 shows that the current CPP assets together with the contribution asset are sufficient to finance the accrued liabilities of the CPP, confirming that the CPP is financially sustainable.
Conclusion
PAYG and partially funded social security retirement income systems represent social contracts where, in any given year, current contributors allow the use of their contributions to pay current beneficiaries’ benefits. Such social contracts create claims for current and past contributors to contributions of future con-tributors. The proper assessment of the financial sustainability of a social security PAYG or partially funded system by means of its balance sheet should take into
Table 7. Closed group without future accruals balance sheet with contribution asset
(9.9% contribution rate for the CPP)
Present value as at 31 December 2009 Inkomstpension (SEK billion)* CPP (CAD billion)
Modified closed group without future accruals Assets
Current assets (a) 827 127
Contribution asset
Last year contributions (b) 200 36
Turnover duration (years) (c) 32 31
Contribution asset (d)= (b) ¥ (c) 6,362 1,120
Total Assets (e)= (a) + (d) 7,189 1,247
Liabilities
Current benefits (f) 5,002 342
Future benefits (g) 2,510 841
Total liabilities (h)= (f) + (g) 7,512 1,183
Asset excess (shortfall) (i)= (e) - (h) -323 64
Total assets as a percentage of total liabilities (Financial position) (e)/(h)
95.7% 105.4%
Notes: * SEK 1= approx. CAN 0.15. Discount rate: Growth in contributory base.
Sources: Swedish Pension Agency (2010) and OSFI (2012).
account these claims. The traditional closed group methodologies do not reflect these claims since only current participants are considered. On the contrary, the open group approach accounts explicitly for these claims by considering the ben-efits and contributions of both the current and future plan’s participants (OSFI, 2012).
Countries, such as the United States and Sweden, assess the financial status of their old-age social security programmes using balance sheet measures that reflect the largely PAYG nature of these systems.
In the case of Canada, major amendments introduced in 1998 led to the change in financing of the Canada Pension Plan from a PAYG basis to a form of partial funding called steady-state funding. These changes, and particularly steady-state funding, restored the Plan’s financial sustainability for current and future genera-tions. The purpose of the steady-state financing methodology is to produce an asset/expenditure ratio that is relatively stable over time. Although a number of approaches may be used to assess the Plan’s financial status, the key financial measure for evaluating the Plan is the steady-state contribution rate, in particular, its adequacy and stability over time.
From its inception, the CPP was never intended to be a fully funded plan. Therefore, it is inappropriate to assess the Plan’s long-term financial sustainability considering the asset shortfall or excess under the closed group balance sheet that does not reflect the nature of the partial financing approach.
The Canada Pension Plan is a nationwide social security programme under the stewardship of the federal, provincial and territorial governments, and with a strong governance and accountability framework. As such it is unlikely that the Plan would become insolvent. Therefore, if the Plan’s financial sustainability is to be measured based on its asset excess or shortfall, it should be done on an open group basis that reflects the long-term nature of the Plan as well as the partially funded approach to the Plan’s financing – that is, its reliance on both future con-tributions and invested assets as means of financing future expenditures. The inclusion of future contributions and benefits with respect to both current and future contributors in the assessment of the CPP’s financial status shows that the Plan is able to meet its financial obligations and is sustainable over the long-term.
Bibliography
Andrews, D.; Brown, R.; McGillivray, W. 2011. Review of the twenty-fifth actuarial report on the Canada Pension Plan. Ottawa, Canada Pension Plan.
Campbell, M. W.; Flanagan, P. F.; Levy, T. D. 2008. Review of the twenty-third actuarial report on the Canada Pension Plan. Ottawa, Canada Pension Plan.
Government of Canada. 2011. Public accounts of Canada, 2011. Ottawa.
HRSDC. 2011. Annual report of the Canada Pension Plan, 2010-2011. Ottawa, Human
Resources and Skills Development Canada.
IAA. 2012. ISAP nn – Valuation of social security programs: Exposure draft. Ottawa,
Interna-tional Actuarial Association.
Mikula, B. D.; Settergren, O. 2005. “The rate of return of pay-as-you-go pension system: A
more exact consumption-loan model of interest”, in Journal of Pension Economics and
Finance, Vol. 4, No. 2.
OASDI. 2010. The 2010 annual report of the Board of Trustees of the Federal Old-Age and Survivors Insurance and Federal Disability Insurance Trust Funds. Washington, DC,
Old-Age, Survivors and Disability Insurance.
OASDI. 2012. The 2012 annual report of the Board of Trustees of the Federal Old-Age, Survi-vors and Federal Disability Insurance Trust Funds. Washington, DC, Old-Age, SurviSurvi-vors
and Disability Insurance.
OECD. 2011. Pensions at a glance 2011: Retirement-income systems in OECD and G20 coun-tries. Paris, Organisation for Economic Co-operation and Development.
OSFI. 2007. Twenty-third actuarial report on the Canada Pension Plan as at 31 December 2006. Ottawa, Office of the Superintendent of Financial Institutions Canada – Office of
the Chief Actuary.
OSFI. 2010a. Technical aspects of the financing of the Canada Pension Plan (Actuarial study,
No. 8). Ottawa, Office of the Superintendent of Financial Institutions Canada – Office of the Chief Actuary.
OSFI. 2010b. Twenty-fifth actuarial report on the Canada Pension Plan as at 31 December 2009. Ottawa, Office of the Superintendent of Financial Institutions Canada – Office of
the Chief Actuary.
OSFI. 2012. Measuring the financial sustainability of the Canada Pension Plan (Actuarial
study, No. 10). Ottawa, Office of the Superintendent of Financial Institutions Canada – Office of the Chief Actuary.
Settergren, O. 2001. “The automatic balance mechanism of the Swedish pension system –
A non-technical introduction”, in Wirtschaftspolitische Blätter, No. 4.
Settergren, O. 2009a. Actuarial accounting: Quantifying reasons for change in financial posi-tion of a pay-as-you-go pension plan (PowerPoint presentaposi-tion, 16th ISSA Internaposi-tional
Conference of Social Security Actuaries and Statisticians, Ottawa, 16-18 September). Geneva, International Social Security Association.
Settergren, O. 2009b. Actuarial accounting: Quantifying reasons for change in financial posi-tion of a pay-as-you-go pension plan (Conference paper, 16th ISSA Internaposi-tional
Con-ference of Social Security Actuaries and Statisticians, Ottawa, 16-18 September). Geneva, International Social Security Association.
Swedish Pension Agency. 2010. Orange report: Annual report of the Swedish Pension System 2009. Stockholm.