HAL Id: hal-02056274
https://hal-mines-albi.archives-ouvertes.fr/hal-02056274
Submitted on 14 Mar 2019
HAL is a multi-disciplinary open access archive for the deposit and dissemination of sci-entific research documents, whether they are pub-lished or not. The documents may come from teaching and research institutions in France or abroad, or from public or private research centers.
L’archive ouverte pluridisciplinaire HAL, est destinée au dépôt et à la diffusion de documents scientifiques de niveau recherche, publiés ou non, émanant des établissements d’enseignement et de recherche français ou étrangers, des laboratoires publics ou privés.
Inflation Technique Optimization for an Elastomer
Biaxial Characterization
Fabrice Schmidt, Nicolas Reuge, Yannick Le Maoult, Jean Paul Arcens, B.
David
To cite this version:
Fabrice Schmidt, Nicolas Reuge, Yannick Le Maoult, Jean Paul Arcens, B. David. Inflation Tech-nique Optimization for an Elastomer Biaxial Characterization. International Conference of Polymer Processing Society, May 1999, Hertogenbosch, Netherlands. �hal-02056274�
Inflation technique optimisation
for an elastomer biaxial characterisation
F.M. Schmidt, N. Reuge, Y. Le Maoult, J.P. Arcens, B. David
Ecole des mines d’Albi-Carmaux, Route de Teillet
81013 Albi CT Cedex 09 (France)
F. Abbé
SEP, Division SNECMA, Le Haillan B.P. 37,
33165 Saint-Médard en Jalles (France)
Abstract
It can be extremely useful to know biaxial properties of materials like elastomers used for mechanical applications or thermoplastics for the simulation of injection stretch/blow moulding or thermoforming processes. The biaxial stress-strain data of such materials can be obtained using a bubble-inflation-technique. A circular membrane is clamped at the rim and inflated by a pressure applied to one of its side. The inflation of the circular membrane is recorded using a CCD video camera and the blowing pressure by a pressure sensor. This technique was applied to the determination of an elastomer rheological behaviour, and will be adapted for thermoplastics (including a heating device). First, an experimental set-up was carried out, using a thickness measurement magnetic probe, in order to validate rheometer results. Circonferential biaxial Cauchy stress–elongation curve of the elastomer studied was compared with the uniaxial stress–elongation curve.
1 Introduction
The inflation of uniform circular membrane has been of interest to scientists and engineers for many years. The earliest experimental programs used thin sheets of rubber, both uncured and vulcanised. Treolar (1944) used vulcanised latex sheets to study the distribution of principal strains as well as the axial profiles of the inflated sheets and the mechanism of bursting. Rivlin and Saunders (1951) used the Neo-Hookean and Mooney forms of the strain-energy functions in the elasticity relations and numerically solved the equilibrium and geometric relations for the inflation of a circular membrane. Alexander (1971) inflated membranes in order to model tensile instabilities observed with atmospheric balloons.
More recently, viscoelastic sheets have been investigated. Schmidt and Carley (1975) developed numerical models using non-linear constitutive equation issued from the rubber-like materials theory for the membrane-inflation problem and compared their results with experimental values obtained with high-impact polystyrene and cellulose acetate butyrate above their respective glass-transition temperatures. Denson and Hylton (1980) studied ABS membranes close to the forming temperature (138°C) using oil for inflation. The incompressibility of the oil allows to proceed to stress retardation experiments where
the pressure is imposed. Thomas and Tintillier (1992) inflated circular PET membranes and used a video camera device to study the biaxial elongation of PET above the glass transition temperature. Verron (1997) developed a numerical procedure using the bubble height to compute the rheological parameters for a given constitutive equation during the membrane inflation. This numerical approach avoids a complex video camera device and to mark the membrane but the method supposes to know a priori the rheological behaviour.
Our goal is to develop and optimise a rheometer based on an inflation technique similar to Thomas and Tintillier (1992). For that, we have proceeded to comparisons with the measured thickness of the inflated membrane using the inflation device and a magnetic probe thickness measurement. The inflation rheometer was then applied to the determination of the biaxial rheological properties of an elastomer at ambient temperature (no heating stage).
2 Bubble inflation assumptions
An uniform circular membrane is clamped at the rim and inflated by a pressure applied to one of its side in order to produce an inflated bubble (fig. 1).
Fig. 1 – Inflated bubble in biaxial extension
The inflation of the circular membrane results in a biaxial extension. The assumption of spherical symmetry allows us to equate to at the pole of the bubble. So, the Cauchy stress tensor expressed in spherical coordinates reduces to:
rr 0 0 0 0 0 0 (1)
If the thickness of the inflated membrane e is much smaller than the curvature radius Rc (Schmidt, 1995),
the thin shell assumption leads to neglect the radial stress rr in front of the circonferential stress . In
P Rc
2e (2)
assuming that the thickness e is uniform at the pole of the bubble. P is the differential inflation pressure. Consequently, we are now able to calculate the circonferential stress by measuring the curvature radius and the thickness.
3 Bubble inflation technique
The biaxial stress-strain data of an elastomer can be obtained using a bubble-inflation technique. A general view of the bubble inflation rheometer is presented in figure 2.
Fig. 2 – View of the bubble inflation rheometer
A circular membrane is mounted between two metal disks containing a circular aperture (40 mm in diameter) and clamped on a support. Compressed air is then used to inflate the membrane. The inflation of the membrane is recorded using a CCD SONY video camera (752X582 pixels) and a MATROX image grabber. The inflation pressure is recorded using a pressure sensor located close to the back side of the membrane. The curvature radius is measured using video camera images analysis. Details of the experimental technique and the measurement made on the bubbles can be found in Reuge (1998). Elastomer membranes were successfully inflated beyong the hemispherical stage to large bubbles (fig. 3). Hemispherical deformation of the inflated membrane occurs only for low circonferential stretch . Furthermore, the membrane thickness is non-uniform. A preprinted made of a silicone coat provides a reference mark which localises a pole zone where the thickness is assumed to be uniform. Using the volume balance at a local level, the thickness may be calculated using the following relationship:
e eo
2 (3)
where eo is the flat circular membrane thickness. The circonferential stretch is the ratio between the
current length of the mark l and the initial length of the mark lo:
l
lo (4)
P = 0.288 bar ( = 15 %) P = 0.598 bar ( = 150 %)
P = 0.605 bar ( = 325 %) P = 0.799 bar ( = 485 %) Fig. 3 – Intermediate bubble shapes
4 Applications
First, an experimental set-up was carried out using a thickness measurement magnetic probe, in order to validate rheometer thickness measurement (fig.4).
Fig. 4 - Magnetic probe in contact with the pole
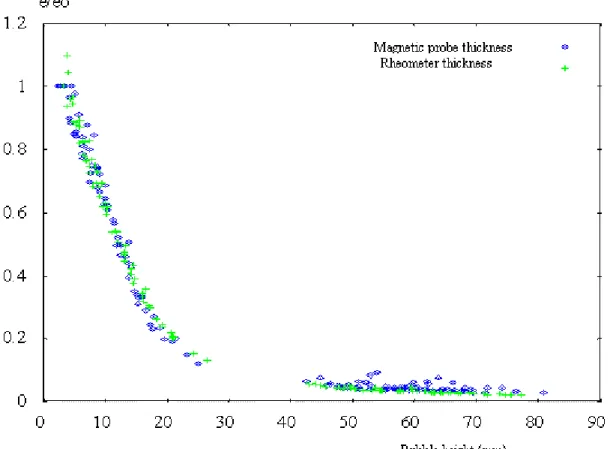
The clamping system is reversed. Then, a ball magnet is placed upon the membrane. The membrane is inflated for given pressure values. For each pressure value, the magnetic probe which has been fixed on a rack is bringing in perfect contact with the pole of the reversed bubble. We have proceeded to five measures for each pressure value. The bubble height H is measured using the video camera images analysis. In figure 5, the comparison between the thickness measured using the magnetic probe and the inflation rheometer thickness is presented. The agreement is fair except for large elongation i.e. 4.18 (H≥ 42 mm). In that domain, the uncertainty of the magnetic probe measurement increases due to local variations of the thickness (the sample slides between the clamps). Nevertheless, the weak discrepancy (15%) between the two methods at low and medium elongation allows to validate the inflation rheometer measurement.
We note the existence of an instability zone for 25mmH42 mm. This phenomenon is related to the stress-induced crystallisation of the elastomer during the biaxial elongation (Mullins, 1947).
Fig. 5 - Comparison between magnetic probe thickness and inflation rheometer thickness versus bubble height
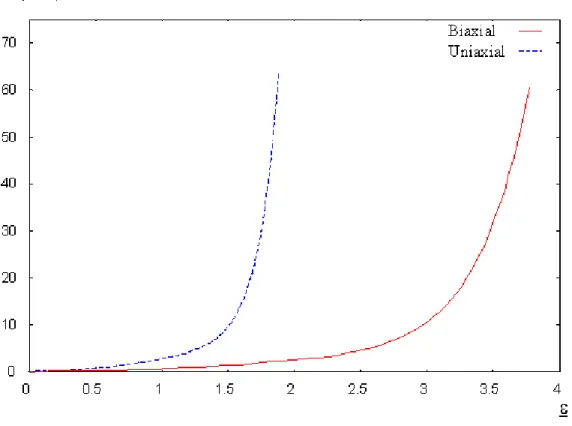
Preliminary results obtained for static inflation are presented now. The pressure is imposed at a given value. The different parameters are calculated using the inflation rheometer (thickness of the inflated membrane, curvature radius, circonferential stress and stretch) The procedure is repeated until the elastomer limit of elongation is reached (before bursting). Circonferential biaxial stress–elongation curve of the elastomer studied is plotted in figure 6 and compared with the uniaxial stress–elongation curve at ambient temperature. Uniaxial and biaxial curves are very closed. This is not the case with generalised stress-strain data (fig.7). Depending on the type of elongation, the equivalent strain and stress are defined bellow:
zz , zz (uniaxial elongation) (5)
Fig. 6 - Comparison between biaxial and uniaxial stress-elongation for an elastomer (T= 25°C)
Fig. 7 - Comparison between biaxial and uniaxial equivalent stress-strain elongation for an elastomer (T= 25°C)
5 Conclusion
The biaxial rheological properties of an elastomer have been characterised using an inflation rheometer. For this elastomer in particular, the biaxial behaviour is very close to the uniaxial behaviour. But the comparison depends whether we use the equivalent stress and strain or the uniaxial and circonferential stress and strain.
Adding an air convection oven to the present bubble-inflation rheometer will allow to heat polymers above the glass transition temperature and to obtain the biaxial stress-strain data of polymers.
References
Alexander H., « Tensile Instability of Initially Spherical Balloons », Int. J. Engng. Sci., Vol. 9, pp. 151-162, 1971
Denson C.D. and Hylton D.C., « A rheometer for measurement the viscoelasticity response of polymer melts in arbitrary planar and biaxial extensional flow fields », Polym. Eng. Sci., Vol.20, No. 8, pp. 535-539, 1980
Mullins L., « Effect of stretching on the properties of rubber », J. of Rubber Research, Vol.16, No.12, pp. 275-289, 1947
Reuge N., "Mise au point et optimisation d’un rhéomètre équibiaxial pour la caractérisation d’un élastomère", DEA Report, in french, 1998.
Rivlin R.S. and Saunders D.W., « Large elastic deformation of isotropic materials - VII. Experiments on the deformation rubber », phil. Trans. R. Soc., Vol. A243, pp. 251-288, 1951
Schmidt F.M., « Modélisation numérique et étude expérimentale du soufflage de bouteilles en P.E.T », PhD thesis, in french, ENSMP (CEMEF), 1995
Schmidt L.R. and Carley J.F, « Biaxial Stretching of Heat-Softened Plastic Sheets: Experiments and Results », polym. Engn. Sci., Vol. 15, No1, pp. 51-62, 1975
Thomas L. and Tintillier M., « Développement et mise au point d’une méthode d’essai de bullage de flans en P.E.T avec mesure vidéométrique », in french, DEA Report, ENSTIMD, 1992
Treolar L.R.G., « Strains in inflated rubber sheet and the mechanism of bursting », Trans. Inst. Rubber Ind., Vol.19, pp. 201-212, 1944
Verron E., « Contribution expérimentale et numérique au procédés de moulage par soufflage et thermoformage », PhD thesis, in french, ECN, 1997