Passive design of a force-displacement curve using topology
optimization
Jongsuh LEE
1, Thibaut DETROUX
1, Gaëtan KERSCHEN
1*1Space Structures and Systems Laboratory (S3L), University of Liège, Department of Aerospace and
Mechanical Engineering, Liège, Belgium
2Department of Materials Science and Engineering, Seoul National University, Seoul 56789, Korea
[email protected]
*
G.Kerschen
uliege.
@be
Abstract
The objective of this study is to develop an optimization methodology to trace a prescribed force-displacement curve. For this purpose, we employ the topology optimization to find the layout of a structure that minimizes the difference from the predefined force-displacement curve. In addition, we propose a constraint that is necessary for the initial design of the structure to escape from its inherent nonlinearities. The effectiveness of the proposed method is verified by performing a simulation with a thin plate.
Keywords : Force-displacement curve, topology optimization, hardening and softening nonlinearities, slope constraint
1. Introduction
The generalized Hook’s law is not valid if a structure is under large deformation, meaning that the force-displacement (F-D) curve exhibits nonlinear behavior due to geometric nonlinearity. Geometric nonlinearities can be of the softening or hardening types, i.e., variations of displacement with respect to increasing external force is decreased or increased, respectively [1]. For instance, a thin plate is governed by the hardening nonlinearity in general [1-2]. In the present, we propose a methodology to find the layout of a structure that traces a predefined F-D curve in which softening, hardening, or both nonlinearities are involved. If the nonlinearity in the prescribed F-D curve differs from the inherent nonlinearity in the initial design—for instance, the softening nonlinearity for a thin plate—it may seem impossible to find a layout that thoroughly follows the prescribed curve in the optimization problem. Therefore, we take the slope of the curve into account as well as the values of the prescribed F-D curve in order to adapt to the nonlinearities on the curve. The slope is involved in the optimization problem as a constraint. Simulation is performed to verify the proposed method, in which a thin plate is used. In the simulation, the St. Venant-Kirchhoff model [3] is used to describe the behavior of the material. The purpose of the simulation in this work is to find the layout of the structure that exhibits a softening behavior.
2. Optimization formulas
To find a structural layout tracing a given F-D curve, the following optimization formulation was considered:
2 * ( )
Min
N i i i c u f u
(1) min max:
( )
,
1,
where ( )
i i i i i f fdf
st
s f
i
N
s f
du
(2)In this formula, u and u* denote the displacement when the external force f is applied and the prescribed displacement
© The 14th International Conference on Motion and Vibration Control (MoViC 2018) The 14th International Conference on Motion and Vibration
MoViC2018
at the corresponding force f, respectively. N is the number of load steps and ρ is the design variable. In Eq. (1), c is a scalar objective function measuring the sum of the differences between the actual displacement u and the target displacement u* for N steps of given loads. Eq. (2) shows defined constraints. Here, s represents a slope on the F-D
curve at external force f and it is bounded by two prescribed values: θmin and θmax.
3. Simulation
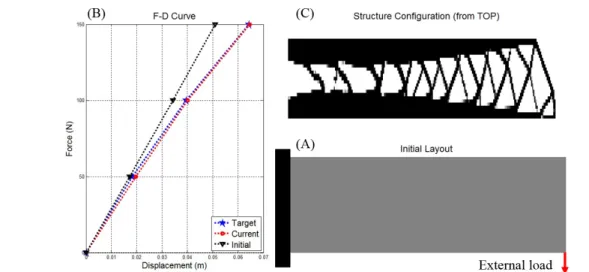
The proposed method is demonstrated on a thin plate. The initial layout used in the optimization problem and its essential and natural boundary conditions are depicted in Figure 1 (A). The total number of elements is 6000 (25 x 240).
Fig. 1 (A) Initial design layout and its essential and natural boundary conditions; (B) three F-D curves measured from the initial layout (▪▪▼▪▪), prescribed (▪▪★▪▪) in the optimization problem, and measured from the optimized layout (▪▪○▪▪); (C) optimized layout from the topology optimization.
Figure 1 (B) shows three F-D curves that are measured from the initial design layout (▪▪▼▪▪), prescribed
(▪▪★▪▪), and measured from the optimized layout (▪▪○▪▪). The curve measured from the initial layout looks like
a straight line, but it is slightly curved upward, meaning that the initial design behaves with the hardening nonlinearity. The prescribed (target) curve depicts the softening nonlinearity. Therefore, in the optimization process, the inherent nonlinearity must be converted from hardening to softening, and the slope constraint in Eq. (2) helps this conversion. Figure 1 (C) shows the optimized layout, and the measured F-D curve from this layout is plotted in Figure 1 (B). It agrees well with the prescribed curve.
4. Conclusions
This study introduced an optimization methodology to find a structural layout that traces a prescribed curve, in which the slope of the prescribed F-D curve is involved. The effectiveness of the proposed approach was demonstrated by a simulation in which a thin plate is employed and the softening behavior is set as a target curve. References
[1] J. N. Reddy, Theory and analysis of elastic plates and shells - 2nd edition, London: CRC Press, 2007.
[2] J. Lee, T. Detroux and G. Kerschen, "Harmonic balance computation of the nonliear frequency response of a thin plate," in 24th International Congress on Sound and Vibration (ICSV24), London, 2017.
[3] N. Kim, Introduction to nonlinear finite element analysis, Florida: Springer, 2015.
© The 14th International Conference on Motion and Vibration Control (MoViC 2018)