Science Arts & Métiers (SAM)
is an open access repository that collects the work of Arts et Métiers Institute of
Technology researchers and makes it freely available over the web where possible.
This is an author-deposited version published in: https://sam.ensam.eu Handle ID: .http://hdl.handle.net/10985/6914
To cite this version :
Franck MOREL, Anne MOREL, Yves NADOT - Comparison between defects and micro-notches in multiaxial fatigue – The size effect and the gradient effect International Journal of Fatigue -Vol. 31, n°2, p.263-275 - 2009
Any correspondence concerning this service should be sent to the repository Administrator : [email protected]
Comparison between defects and micro-notches in
multiaxial fatigue – The size effect and the gradient effect
F. Morela, , , A. Morela, , Y. Nadotb,
a Arts et Métiers ParisTech CER Angers, 2 boulevard du Ronceray, BP 93525, 49035 Angers Cedex 01, France
LMPM, ENSMA, Téléport 2, BP 40109, 86961 Futuroscope Cedex, France
Abstract
This paper attempts to improve the understanding of the multiaxial high cycle fatigue response of micro sized stress concentrations or notches of different geometries. The investigation is composed of an experimental part and a numerical part. In the former, three types of micro-notches or “artificial defects” are compared: spherical, elliptical and circumferential. All types have the same basic dimensions, the difference being the 3D geometry. The notches were machined on the surface of smooth cylindrical specimens made of mild steel. The fatigue limits under reversed tension (push–pull) and reversed torsional loading conditions for different micro-notch sizes have been experimentally determined. In the numerical part, finite elements simulations using a cyclic elasto-plastic material behaviour law show that the mechanical state ahead of the different stress concentrations change drastically with the loading mode and the geometry of the artificial defect. From a fatigue point of view, it is shown that a stress gradient correction is required for all the loading, size and geometry configurations. Once the gradient correction is made and a proper multiaxial criterion is used, it appears that the size effect due to increasing the loaded surface area at the notch tip for the different geometries is negligible compared to the gradient effect.
Keywords
Micro-notch; Artificial defect; Multiaxial criterion; Gradient effect; Size effect
Nomenclature
G gradient of the hydrostatic stress
Q, b coefficients of the non-linear isotropic Voce’s law
R isotropic internal variable (scalar) or radius of the yield surface
R0 initial value of the yield surface radius
deviatoric stress tensor
Ta revolved shear stress amplitude
kinematic internal variable (tensor)
α, κ material coefficients of the local Papadopoulos criterion
β, q, n material coefficients of the criterion with a gradient correction total, elastic and plastic parts of the strain tensor
γ, C coefficients of the non-linear kinematic Amstrong–Frederick law
ΣD fatigue limit under purely reversed tensile loads (push–pull)
ΣH,max maximum value of the hydrostatic stress over a loading period
τD fatigue limit under purely reversed torsional loads
average value of the resolved shear stress amplitudes acting over all the possible glide systems of an elementary volume
1. Introduction
The fatigue limit of notched components or materials containing inherent defects (e.g. micro-shrinkage pores in cast materials) is of great importance for the industrial application of these materials and is generally accepted to depend on both the defect geometry and the loading mode.
Stress concentration factors Kt are often used to describe the effects of notches [1] and [2]. They
estimate the stress amplification in the vicinity of the geometric discontinuity in the case of linear elastic areas. Under cyclic loading, fatigue concentration factors Kf were introduced first in the 1950s
and related to stress concentration factors Kt by means of empirical relations [3] and [4]. More recently
some authors used finite element simulations to describe stress gradient near notches and integrated these results to fatigue life calculations based on local stress concept, e.g. with investigations of Eichlseder [5].
However, to date very few methods have been proposed to account for both the multiaxial stress state and the stress gradient occurring around a micro-notch or a defect. Moreover, if a notch is sufficiently sharp, cyclic plasticity occurs at the notch tip that tends to an asymptotic level under a given loading mode. This remark holds true for the stress strain state around a defect. If this asymptotic state corresponds to plastic shakedown, then the initiation of a crack is likely to occur. On the contrary, if the material tends to recover a purely elastic response, the fatigue limit is obtained or at this threshold level, no crack initiation is expected.
Some authors consider that the fatigue limit of notched components is due to small cracks that stop growing (or non-propagating cracks), in which the threshold stress intensity factor has been reached [6]. However, most of the time, the non-propagating cracks are observed at the specimen surface. A recent study carried out in the bulk material showed that these cracks occurring below the fatigue limit are small corner cracks and never join each other to create a bigger crack around the defect [7]. Furthermore, certain authors have observed according to observations fatigue initiation mechanisms are not different between defect free and defective material [8].
The influence of multiaxial loading conditions on the fatigue limit is usually described by means of a high cycle fatigue criterion. Many endurance criteria have been proposed and they typically use the stress (or strain) history over a loading period, to estimate at least two relevant mechanical quantities. The combination (linear or otherwise) of these parameters must not be greater than a threshold value.
Dang Van’s model, for example, uses a linear combination of the asymptotic microscopic shear stress and the hydrostatic stress reached during a loading period.
The aim of this paper is to study the influence of notches and defects in terms of high cycle multiaxial fatigue. More precisely, experimental and numerical studies are undertaken to investigate the influence on the fatigue strength of:
1. The stress and strain redistribution due to the cyclic plasticity at the notch tip. 2. The multiaxial loading mode at the notch root.
3. The artificial defect or notch size and shape.
In this paper, the terms notch and defect are used interchangeably. However in all cases the terms refer to artificial stress concentration.
An experimental comparison is undertaken between notches and artificial defects in order to evaluate the possibility of considering defects as 2D notches. In particular, how does the geometry of the different stress concentrations (spherical surface defects, ellipsoidal surface defects, and circumferential notches) influence the multiaxial stress state and the stress gradient? And, is there a notch size effect when dealing with the influence of micro-sized stress concentrations on the fatigue strength?
In the section that follows, the material investigated is described (i.e. mild steel C35), together with its fatigue response to purely reversed tensile and torsional loads. Experimental results obtained using specimens containing artificial surface defects and notches of different sizes and shapes, tested in reversed tension and torsion, are then described.
The second section describes the numerical analyses carried out to estimate the stress fields around circumferential notches and spherical or elliptical defects of different sizes. The FE meshing conditions and the non-linear plasticity rule used to simulate the experimental cyclic elasto-plastic behaviour are detailed. Once an asymptotic cyclic state is obtained, the corresponding stress distribution around the defect or notch can be used as the input data for a fatigue analysis.
In the third section, the fatigue analysis is conducted. A multiaxial endurance criterion based on the concept of elastic shakedown is used to define the fatigue strength conditions. This criterion is applied using the calculated elasto-plastic stress field.
The stress gradient occurring at the notch root tends to zero as the distance ahead of the notch increases, under a tensile load. This gradient must be properly evaluated since it is known to be beneficial to the fatigue strength. For the two loading modes, tension and torsion, and the different geometries and sizes, the gradient effect is detailed. The size effect is also explored.
2. Experimental details
The material tested is a C35 carbon steel containing two phases: ferrite and pearlite. The pearlite bands are oriented in the rolling direction (longitudinal). This does not influence the average size of the
grains which is, in all direction, approximately 22 μm for the ferrite grains and 16 μm for the pearlite grains. The distance between two pearlite bands corresponds to one or two ferrite grains. The rolling direction corresponds to the longitudinal specimen axis for all of the specimens studied. More details concerning this material can be found in ref [8] but it must be kept in mind that the results presented here concern a body centred cubic (BCC) poly-crystalline metal. Hence, the generalization to other structures like faced centred cubic (FCC) metals should be done with care as the local hardening mechanisms as well as plastic glide conditions are very different. The mechanical properties for the C35 are: the Young modulus = 210 GPa, Poisson’s ratio = 0.3, the ultimate tensile strength = 582 MPa, the monotonic yield strength = 353 MPa, and the cyclic yield strength = 278 MPa. Fatigue tests are performed on cylindrical specimens (ϕ6 mm tensile specimens and ϕ12 mm torsional specimens) taken from a ϕ80 mm rolled bar along the longitudinal direction. All samples were polished using p4000 silicon carbide sand paper. The specimens were subsequently stress relieved in a vacuum at 500 °C for one hour in order to relieve any residual stresses induced via polishing or machining. Tensile fatigue tests were conducted at 100 Hz and at 50 Hz for the torsional tests using a resonance fatigue testing machine.
Tests were firstly conducted on the defect free material (i.e. smooth specimens) in order to determine the reference fatigue limit. Fig. 1a shows the tensile fatigue test results and Fig. 1b the torsional results, with a load ratio R = −1 for both cases. The fatigue limits obtained under both loading conditions are given below:
Fig. 1. Reference SN curves for the mild steel C35 under (a) reversed tensile loads and (b) reversed torsional loads.
Tensile fatigue limit: ΣD = 236 MPa ± 12 MPa
Torsional fatigue limit: τD = 169 MPa ± 9 MPa
The change in these fatigue limits has been determined for specimen geometries containing different micro-defects and micro-notches. As it is very time consuming to determine a statistically valid fatigue limit using the traditional S–N or staircase approaches, a step-by-step method has been used in the following. A specimen containing an artificial defect is cycled for 5 × 10⁶ cycles below the fatigue limit.
If no failure occurs, the same specimen is re-tested at a higher stress level. This procedure is repeated until the failure is achieved. The results presented in this paper have been determined using this procedure and the fatigue limit is taken to be the average value of two specimens tested by the step-by-step method. It is well known that this method can modify the fatigue limit due to coaxing effect [9]. Therefore, a comparison between the staircase statistical method and the step-by-step method has been performed in another study to demonstrate the validity of this technique for this material [8]: only 4% difference is obtained between both methods. Hence, the step-by-step method is considered to give good estimates of the fatigue limit for this material.
Artificial defects are introduced at the surface of fatigue specimens by means of electric discharge machining (EDM). This method is suitable for the machining of artificial defects of different shapes and sizes, which are reproducible. Micro circumferential notches are machined using a classical turning process with special tools prepared for each micro-notch geometry. Three different types of defects are considered (see Fig. 2):
• Spherical shaped micro-defects (obtained via EDM): referred to as “defect A”. • Ellipsoidal shaped micro-defects (obtained via EDM): referred to as “defect B”. • Circumferential micro-notches (obtained via turning): referred to as “defect C”.
Fig. 2. The three notch/defect geometries studied: (a) Circumferential notches (type C), ellipsoidal defects (typeB) and spherical defects (type A). (b) Identical radii for each defect.
The comparison between these defect types is done using:
• Four radii for the type A defects (spherical): 80 μm, 160 μm, 320 μm and 730 μm. • Three radii for the type B defects (ellipsoidal): 160 μm, 320 μm and 730 μm. • Two radii for the type C defects (circumferential notch): 320 μm and 730 μm.
Each size is not common to the three defect types because the smallest sizes were difficult to machine in a reproducible manner (especially for the notch). The defect size precision is approximately ±20 μm. There are however two sizes common to all defect types: 320 μm and 730 μm which are used as the basis for the comparison. Fig. 2a shows the three different defect types. As shown in Fig. 2b the defect radius is the same for each defect type, the only difference being the length of the defect.
One purpose of this work is, by holding the radius constant for each notch/defect type, to investigate if the size of the highly stressed area at the notch/defect root greatly affects the fatigue result. Note that the spherical defect have the smallest highly stressed area and the circumferentially micro-notched specimens have the largest stressed area, with the ellipsoidal defects being an intermediate case. In a previous study using the same material (C35), the evolution of the fatigue limit as a function of the defect size was obtained experimentally under tensile loads [8]. The principal results are summarised below and a Kitagawa type diagram is presented in Fig. 3:
(1)
When the fatigue limit ΣD is presented as a function of the square root of the defect area (or projected
area) as defined by Murakami [6], the same evolution was observed for both spherical and ellipsoidal defects.
Fig. 3. Evolution of the fatigue limit as a function of the defect size for the different geometries loaded in (a) tension and (b) torsion (experimental results [8]).
For specimens containing spherical defects loaded in tension, the results are as follows:
• For a spherical defect: .
• For a spherical defect: .
• For a spherical defect: .
For specimens with ellipsoidal defects, the relationship between the radius and the area was determined by measurements made on the fracture surface after failure in order to take into account the interaction between the defect and the specimen geometry.
• For an ellipsoidal defect: .
• For an ellipsoidal defect: .
• For an ellipsoidal defect: .
The results obtained with specimens containing micro-notches are given directly in Fig. 4.
Fig. 4. Evolution of the fatigue limit expressed in terms of nominal stress as a function of the defect size for the three geometries (i.e. spherical defects, ellipsoidal defects and circumferential notches) for the two loading modes (reversed tension and reversed torsion).
All of the results are presented in Fig. 4 where the fatigue limit is plotted against the radius of the defect for the three defect types tested and the two loading modes.
For specimens loaded in torsion, similar tests are conducted and lead to the following evolution of the torsional fatigue limit:
(2)
The initial conclusions from this experimental work are as follows:
– The fatigue limit decreases with the defect size, for both loading modes (tensile and torsion). – The drop in the fatigue limit is more pronounced in tension than in torsion. This most probably
implies that the material has lower defect sensitivity to macroscopic shear stress. This will be analysed in the following section by considering local stress state and triaxiality around the defects.
– As the defect size increases the fatigue limit decreases and tends to an asymptotic value.
All of the numerical simulations, discussed below, are carried out by applying a nominal stress corresponding to the experimentally determined fatigue limits for the two loading modes and the different notch geometries. For instance, for the geometry containing a spherical defect of radius R = 320 μm and loaded in reversed tension, the applied nominal stress for the numerical simulation is Σa = 157 MPa.
In order to determine the stress and strain distributions around the notch, a time-independent plasticity model is used. This model uses the von Mises yield criterion, the normality flow rule and combined non-linear kinematic and isotropic hardening.
From among the vast number of material behaviour models, of varying level of sophistication, developed to model the elastic-plastic behaviour of metals under cyclic conditions, the classical cyclic hardening model of Chaboche [10], combining the Armstrong-Frederick and Voce laws is used. This model makes use of two internal state variables to describe the isotropic and kinematic hardening: a scalar variable R, describes the isotropic hardening, and a second-order tensor , describes the kinematic hardening. The variable allows the Bauschinger effect to be modelled.
In the classical manner, the strain tensor is divided into an elastic and plastic part: (3)
And as usual for time-independent plasticity models, the yield surface is defined in the deviatoric stress space as f = 0, according to the von Mises criterion:
(4)
where and are the deviatoric stress tensor and the kinematic hardening tensor and J2( ) is the
second stress invariant of the stress tensor . R is the radius of the yield surface.
Kinematic hardening implies the translation of the yield surface in the stress space. This is modelled using an Amstrong–Frederick-type law described by:
(5)
where γ and C/γ are two material coefficients characterising the saturation rate and the saturation value of and p is the accumulated plastic strain. If γ = 0, the classical linear kinematic hardening law of Prager is found.
The isotropic hardening rule given by the Voce law controls the evolution of the isotropic hardening stress R associated with the expansion or contraction of the yield surface:
where Q and b are material coefficients. Q is the asymptotic value of the isotropic variable R at saturation and b indicates the speed at which saturation is achieved. R0 is the initial value of the yield
surface radius.
R0, Q, b, γ and C are the five material parameters that must be identified. Their values are estimated
from experimental cyclic stress–strain curves measured while controlling the total strain at room temperature and pressure: R0 = 250 MPa, Q = −50 MPa, b = 10, γ = 200 and C = 45 000 MPa.
After the stabilisation of the stress-strain hysteresis loop at the notch tip, the stress distributions at the notch tip or defect root are determined.
For both loading conditions (i.e. tensile and torsional), two features of the micro-stress concentrations are investigated:
1. The multiaxial stress state at the notch root, or more precisely, the change of stress state as a function of the different micro-stress concentration sizes and shapes.
2. The stress gradient ahead of the notch tip and the change in gradient as a function of the micro-stress concentration size and shape.
3.1. The reversed tensile loading condition (push–pull)
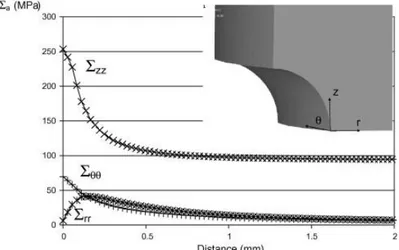
For the cyclic tensile loading condition, Fig. 5 shows the distribution of the three stress components (axialΣzz, tangential Σθθ and radial Σrr) determined via an elasto-plastic FE analysis as a function of the
distance from the notch root for a circumferential notch of radius 320 μm. The distribution of these three components for the other sizes and the other geometries show the same trends, whereby the axial stress Σzz is always the greatest and the radial stress Σrr is equal to zero at the notch root.
Fig. 5. Distribution of the three stress components (axial Σzz, tangential Σθθ and radial Σrr) determined for the
tensile loading mode via an elasto-plastic stress analysis as a function of the distance from the notch root for a circumferential notch of radius 320 μm.
In order to investigate the influence of the defect size on the stress field, for the same geometry, in the following, for the sake of simplicity, only the axial stress Σzz distribution will be considered. Note that
the maximum stress levels (at the root) as well as the gradients are given for the fatigue limit levels experimentally observed.
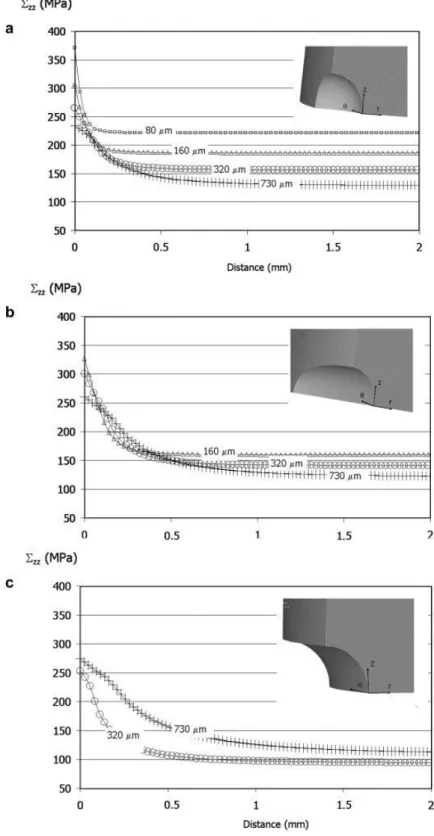
Fig. 6 shows the axial stress Σzz distributions corresponding to the three defect types: spherical,
ellipsoidal and circumferential notch and for the different sizes. Figs. 6 a, b and c shows that the maximum stress level (for all stress components) as well as the gradient seems to increase with decreasing defect size. This illustrates the beneficial role of the stress gradient on the fatigue strength providing an elasto-plastic analysis has been done. It also implies that a local approach without any consideration of the stress distribution/gradient would lead to conservative predictions. This is particularly true for the spherical defects (Fig. 6a) for which four different sizes (80 μm, 160 μm, 320 μ m and 730 μm) have been tested. The three sizes (160 μm, 320 μm and 730 μm) for the ellipsoidal defects show the same trend. For the circumferential notch, the results for the two sizes (320 μm and 730 μm) seem to indicate the opposite trend. However, the stress gradients and the maximum axial stresses, for both sizes, are very similar. Hence, it is difficult to make a conclusion concerning the behaviour of the circumferential notch when compared to the two other defect types.
Fig. 6. Distribution of the axial stress component Σzz determined for the tensile loading mode via an
elasto-plastic stress analysis as a function of the distance from the notch root for (a) a spherical defect (b) an ellipsoidal defect and (c) a circumferential notch of different sizes.
In order to study the influence of the defect/notch geometry, the size is held constant and the stress distribution is investigated as a function of the defect type. Fig. 7 shows the axial stress Σ
zz distributions for a spherical defect, an ellipsoidal defect and a circumferential micro-notch with the
being identical. However, it is clear that when the defect size goes from 730 μm to 320 μm, both the stress and the gradients increase.
Fig. 7. The effect of the stress concentrator type (i.e. spherical defects, ellipsoidal defects and circumferential notches) on the axial stress distribution Σzz ahead of the notch tip in reversed tension. The defect size is a)
320 μm and b) 730 μm.
The similarity of the defect types when comparing the stress distributions also holds true for the biaxial ratio, defined here as being Σθθ/Σzz. More exactly, Fig. 8 shows that for the two defect sizes (a) 320 μm
and (b) 730 μm, the biaxial ratio distributions for the micro-notch and the ellipsoidal defect are very close while the biaxial ratio for the spherical defect is lower. At the notch tip, the biaxial ratios for the ellipsoidal defect and the notch lies between 0.25 and 0.3, while for the spherical defect the value is close to 0.2. In the bulk material, a continuous decrease of this ratio occurs and is compounded by a decrease in the defect size.
Fig. 8. The effect of the stress concentrator type (i.e. spherical defects, ellipsoidal defects and circumferential notches) on the biaxiality ratio defined as Σθθ/Σzz ahead of the notch tip under reversed tensile loads. The defect
size is (a) 320 μm and (b) 730 μm.
It can be hence concluded that the ellipsoidal defect and the micro-notch show very similar stress states and stress distributions. The difference with the spherical notch only appears as the tangential stress is slightly lower than in the two other cases.
All of the previously described observations made using numerical simulations using tensile loads indicate that the stress state at the notch root is a function of the geometry, but the distribution of the largest stress component, Σzz, is not that affected by this geometry. This observation holds true only if
the defect size is held constant. It has also been shown that the size has a real effect on both the maximum stress value and the stress gradient.
3.2. The reversed torsional loading condition
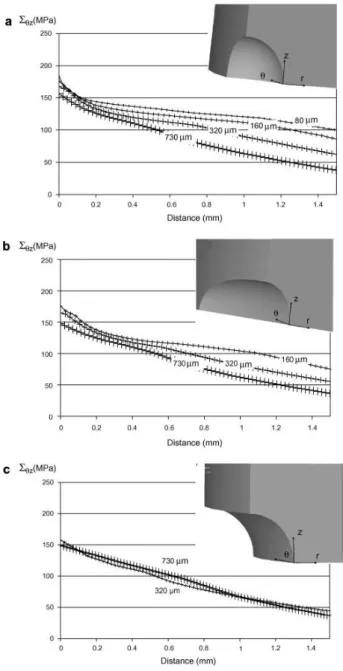
As per the previous section, the influence of both the defect type and size is investigated, in this case for reversed torsional loads, on the stress values and stress distributions. Unlike the tensile case, torsional loads induce at the notch tip only a shear stress component Σθz with no hydrostatic stress. Fig. 9 summarises the shear stress Σθz distributions corresponding to the three defect types: (a)
spherical, (b) ellipsoidal and (c) circumferential notch, for the different sizes. It appears that the maximum stress value is not strongly affected by the defect type. Concerning the influence of the defect size, a slight increase of the shear stress is observed with decreasing size. This increase has nothing to do with the one observed under tensile loads. Indeed, the evolution of the maximum stress value in tension seems to follow the stress gradient evolution and shows a real increase for the
smallest size. For instance, for the spherical defects, when loaded in tension the axial stress undergoes a 59% increase when the size goes from 730 μm to 80 μm, while the shear stress due to the torsional loads only increases by 17% for the same size change.
.
Fig. 9. Distribution of the shear stress Σθz determined via an elasto-plastic stress analysis under a torsional
load, as a function of the distance from the notch root for (a) a spherical defect (b) an ellipsoidal defect and (c) a circumferential notch of different sizes.
Another very important feature of the torsional loading mode is that, unlike the tensile case, the gradient is not greatly affected by the defect geometry and size. This trend is highlighted in Fig. 10 where the shear stress Σθz distributions are plotted for a spherical defect, an elliptical defect and a
each other and the maximum shear stress value is also close to the reference fatigue limit obtained with smooth specimens (i.e. 169 MPa).
Fig. 10. The effect of the stress concentrator type (i.e. spherical defects, ellipsoidal defects and circumferential notches) on the shear stress distribution Σθz ahead of the notch tip loaded in reversed torsion. The defect size is
(a) 320 μm and (b) 730 μm.
The previously discussed results are obtained by finite element simulations of specimens loaded at the experimentally determined fatigue limit. Tests were conducted with different defect sizes, geometries and different loading conditions. However, at this stage, it seems necessary to analyse the results by the mean of an “equivalent fatigue stress” capable of describing the complex cyclic stress state. Furthermore, in the next section it will be shown that an equivalent stress is not enough because of the gradient effect.
4. Fatigue analysis and gradient effect
n the last two decades, the Dang Van multiaxial fatigue criterion [11] has been largely used and is now well-known in the scientific community. This model accounts for the orientation distribution of grains, employing a micro-plasticity analysis to assess the intensity of local plastic strain within individual grains. Although small fatigue crack growth behaviour is not described in this approach, the elastic shakedown of the cyclic micro-plasticity response is considered to be another source of a fatigue limit. This limit is generally lower than that associated with grain boundary blockage of micro-cracks. Within the same micro-plasticity framework, Papadopoulos proposed another endurance criterion [12] in which it is assumed that each plastically deformed grain within the elementary material volume follows
a combined isotropic and kinematic hardening rule. Papadopoulos showed that a root square mean of the macroscopic resolved shear stress amplitude Ta, within the elementary volume V, denoted
as , is proportional to an upper bound estimate of the accumulated plastic meso-strain in certain grains of V, oriented so that their easy glide planes are parallel to a material plane. The notation < > represents an integration carried out over all the possible glide systems of the elementary volume.
The multi-axial endurance criterion is defined as an inequality applied to a linear combination of and the maximum hydrostatic stress ∑H reached during a loading period:
(6)
This approach is an improvement over the Dang Van model when dealing with non-proportional loading conditions. Indeed, it has been shown [13] that phase shift effects and the related micro-damage mechanisms are not properly taken into account by the Dang Van criterion. Better predictions are achieved with the Papadopoulos criterion. α and κ are two material coefficients calculated from two fatigue limits. For instance, if τD is the fatigue limit for a purely reversed torsion loading and ΣD for a
purely reversed tension loading:
κ=τD
In the following the Papadopoulos criterion is applied to the fatigue results discussed above. Using the cyclic elasto-plastic FE analyses, the critical location in terms of the criterion is determined and the fatigue strength is applied at this point. Note that for all the defects loaded in tension, the critical point is located at the notch tip. This is not the case for the torsional loading condition, for the spherical and the ellipsoidal defects, in which the critical point occurs in a zone where the hydrostatic stress plays an important role. For the circumferential notch under torsion however, the critical point occurs at the notch root.
Fig. 11 shows the Papadopoulos equivalent stress (defined as ) as a function of the defect size for the three defect geometries and two loading modes. This figure shows a kind of notch size effect. That is, as the defect size tends to zero, the fatigue strength increases strongly and becomes much bigger than the expected fatigue limit around 169 MPa.
Fig. 11. The evolution of the Papadopoulos equivalent stress (at the hotspot) as a function of the notch/defect size for each geometry (i.e. spherical defects, ellipsoidal defects and circumferential notches).
The circumferentially micro-notched specimens, loaded in tension or torsion, are not very sensitive to this effect. This is perhaps due to the fact that only two sizes have been tested for this geometry. The spherical and elliptical defects are more sensitive to the size of the defect for both loading modes. There are many different ways to explain this observation. Indeed, it is well-known in high cycle fatigue that most classical multiaxial fatigue criteria fail to predict correctly the fatigue strength in the presence of strong stress concentrations or stress gradients.
More precisely, local fatigue criteria based on the hot spot method, that is criteria based on the stress or strains at the most loaded point, generally underestimate the fatigue life.
To date, several approaches have been introduced to deal with the stress gradient effect in HCF. Some use the concept of a critical distance and adapt a fatigue criterion by applying it at a given distance ahead of the notch (or crack tip) [14] or by using an average value in a given process zone ahead of the notch root [15]. A clear link between this critical distance and a microstructural length (like the mean grain size) or a physical phenomenon has not yet been established. These approaches are however found to provide satisfactory results within an engineering framework.
Recently, Bertolino et al. [16] showed, by means of microstructural simulations, that the stress gradient occurring at the notch tip can strongly influence the probability of finding a favourably oriented grain at the notch root. This leads to an average increase in the fatigue strength, which can be correlated to the intensity of the stress gradient. From bending simulations with different gradients, it appears that the stress gradient has a non-negligible effect on the homogeneous solution. More exactly, it is shown that the classical homogenization approaches do not work when there is a high stress gradient. The number of grains that sustain the maximum applied stress level decrease significantly as the gradient increase. In short, the high localization of stresses cause the failure of the homogenization assumptions as only a few grains are exposed to very high stresses.
These results provide a physical explanation for the critical distance methods and notch factors encountered in engineering practice.
For the work presented in this paper, the authors believe that it is not necessary to perform numerical fatigue analyses using a polycrystalline model at the mesoscopic scale as Bertolino et al have done. It is important to remember that the aim of the work presented here is to undertake a comprehensive experimental and numerical study, using an elasto-plastic finite element analysis, to distinguish between the size effect and the gradient effect.
Consequently, to account for the gradient effect occurring under the different loading modes or the different local stress states in the region of the notch/defect root, the idea proposed by Papadopoulos is used, whereby an extension of any multiaxial endurance criterion can be done by introducing a dependence on the spatial gradient of the maximum value of the hydrostatic stress reached during a loading cycle [17]. From the analysis of tensile fatigue test results carried out on smooth specimens, with or without mean stresses, he showed that the gradient of the deviatoric part of the stress tensor seems not to influence the fatigue strength. This observation leads to the expression of a criterion in which only a normalised value of the hydrostatic stress is used:If ΣH,max ≠ 0:
with (8)
where
In the particular case where ΣH,max = 0, the criterion writes:
where (P;x,y,z) is a coordinate system centred on the critical point P at the surface of the loaded specimen.
β and n are the two coefficients of a decreasing power type law that reflects the beneficial influence of the stress gradient on the fatigue strength.
The absence of shear stress gradient dependence in this criterion is a choice made by the authors following Papadopoulos opinion. This assumption could be validated by means of torsion fatigue tests on cylindrical specimens with different notches. Unfortunately, the authors did not have enough test results to confirm this hypothesis but will use it in the following.
In the following, this hydrostatic stress gradient correction is applied to the results discussed above. As can be seen in Fig. 6, due to the defect geometry, the stress gradient is not constant along the plotting line: significant evolution from the notch tip at the surface to the bulk is observed. For this reason, it is decided to calculate the gradient over the size of the defect. This way to do leads to estimate G by assuming that the stress decreases linearly from the critical point at the surface, to the stress level
occurring at a distance of one defect size from the surface. The average stress gradient calculated this way is found to incorporate the main trend observed in the fatigue of notched component [19].
All the normalised gradient values are gathered in the Table 1 for the spherical defect, the elliptical defect and the circumferential micro-notch under purely reversed tension and purely reversed torsion.
Table 1. Normalised gradient values estimated at the critical point of the notch tip for the spherical defect, the elliptical defect and the circumferential micro-notch under purely reversed tension and purely reversed torsion
Loading mode Purely reversed tension Purely reversed torsion
Spherical defect R = 80 μm 5.7 10.4 R = 160 μm 2.5 5.2 R = 320 μm 1.3 2.7 R = 730 μm 0.6 1.1 Elliptical defect R = 160 μm 2.3 1.6 R = 320 μm 1.3 1.1 R = 730 μm 0.6 0.8 Circumferentially micro-notch R = 320 μm 1.3 3.7 R = 730 μm 0.5 1.1
Fig. 12 shows the Papadopoulos equivalent stress modified by the hydrostatic stress gradient.
Fig. 12. The evolution of the Papadopoulos Equivalent stress (including the gradient effect) Σeq,G as a function of
the defect/notch size for all geometries (i.e. spherical defects, ellipsoidal defects and circumferential notches).
The exponent n in Eq. (7) is assumed to be equal to 1.0. This choice leads to a first order approximation of the gradient effect but it is shown that it allows to achieve good predictions with the available data. The coefficient β must be identified using one of the experimental results obtained for a notched component. For the C35 mild steel used here, β = 0.3.
The beneficial effect of the stress gradient is now incorporated into the criterion and the correction significantly shifts all the experimental points toward the horizontal line. Despite this correction, some predictions still lie beyond the ±10% error band, however the errors are markedly improved compared to those observed without the correction (see Fig. 11).
5. Discussion
It is assumed that the stress and strain fields obtained using the elasto-plastic finite element analyses are reasonable approximations of the actual fields. Since the stress state at the notch root is not uniaxial, a suitable multiaxial fatigue approach has been used. More precisely, an endurance criterion based on a mesoplasticity analysis has been utilized.
This endurance criterion has been initially applied at the surface of the notch (i.e. the hotspot) where a crack is most likely to occur according to the criterion. Recall that the criterion coefficients were identified using two reference fatigue limits for smooth specimens, at 1 × 10⁷ cycles, one determined
under purely reversed tensile loads and the other in purely reversed torsion.
Fig. 11 shows the results of this initial analysis. The Papadopoulos equivalent stress is plotted as a function of the notch or defect size. Perfect predictions correspond to the solid horizontal line, equal to the smooth specimen reversed torsional fatigue limit. Two dashed lines which correspond to a prediction error of ±10% are also shown. This figure highlights the fact that, the experimental data for the different geometries and sizes, when applied to this criterion (without a gradient correction), shows a clear trend when the defect size decreases. More precisely, the predictions become more and more conservative as the defect or notch size decreases, regardless of the geometry and the loading mode. Effectively, a kind of size effect is observed and seems to be only due to the stress distribution close to the defect rather than to the local stress state at the hotspot which is already incorporated into the multiaxial endurance criterion.
The second step of the fatigue analysis was to introduce the gradient correction as previously discussed.Fig. 12 shows the reanalysed results presented in the same manner as Fig. 11 except the hydrostatic stress gradient correction has been applied to the equivalent stress through the product ΣH∗
h(G). The effect of such a correction is obviously beneficial for the predictions, with almost all of the predictions lying within the ±10% error band. This correction is very efficient for the smallest defects for which the gradients at the notch root are the highest as shown in Fig. 6.
The approach proposed in this work shows the capacity to improve the endurance criterion predictions for any loading mode, stress concentrator geometry or size.
In the author’s opinion, this is simply due to the fact that:
– A cyclic elasto-plastic material behaviour law has been used. – An endurance criterion accounting for any multiaxial loading is used. – A gradient effect correction is introduced.
These three ingredients are gathered in one simple fatigue model whose efficiency is proved in this study.
The size effect in fatigue of notched component can also be seen as the probability of finding a well oriented grain or grains in which a micro-crack can initiate. In other words and as numerically shown by Bertolino et al[16], when the stress gradient is high, fewer grains are subject to plastic deformation and consequently to crack initiation. On the contrary, with a uniform stress distribution over a larger
scale, for example for the biggest defects, the situation is closer to the case of a smooth specimen. For this reason, the gradient correction has almost no effect on the fatigue strength when dealing with stress concentrators that are much larger than a microstructure scale like the average grain size. By holding the radius constant, for each notch/defect type, it was possible to investigate if the size of the highly stressed area at the notch/defect root greatly affects the fatigue result. Even though it is difficult to give a definitive answer to this question because of the difficulty of comparing fatigue data from a notched component and a material containing defects, it appears that the stress distribution in the bulk material and hence the stress gradient has a higher influence than the size of the highly stressed area at the notch/defect root.
Hence, the experimental results presented here indicate that the gradient effect appears to be more important compared to the effect of the size of the loaded surface. Recall that the difference between rotating bending and plane bending can not be explained only by the influence of the gradient whereas the difference between tensile fatigue results and rotating bending results can be explained from this point of view. Indeed, the plane bending fatigue limit is very often higher than the rotating bending fatigue limit [15]. This indicates that the size of the loaded surface can influence the fatigue strength. For rotating bending all the points at the surface are subjected to the same stress level and the same stress state. The tensile loading mode leads to the same feature but does not include a stress gradient. For plane bending, in which there is obviously a stress gradient, all the points of the surface are not equally stressed. The probability of finding a defect that leads to the specimen failure is therefore lower. The endurance criterion employed in the previous section can not account for the size effect even if the gradient correction is introduced.
A probabilistic approach based on the weakest link concept could be introduced to side step this drawback[18]. However, if a Weibull type law is defined at the specimen surface (where cracks generally initiate in high cycle fatigue), this would not able to account for the gradient effect that occurs in all the experimental results discussed in this paper.
6. Conclusions
The experimental and numerical work presented in this article, conducted under conditions of High Cycle Fatigue, is an investigation of the effect of different micro stress concentration geometries (i.e. spherical defects, ellipsoidal defects and circumferential notches) on the local stress state and stress gradient. Two loading conditions are considered (tensile push–pull and reversed torsion). It is seen that in order to correctly predict the experimental results an elasto-plastic FE analysis, a multiaxial fatigue criterion and a correction for the stress gradient are required.
From this study, the following conclusions can be drawn:
– Under tensile loading conditions at the experimentally determined fatigue limit, the maximum stress of any of the stress components as well as the gradient increases with decreasing defect size. This illustrates the beneficial role of the stress gradient on the fatigue strength providing an elasto-plastic stress analysis has been carried out.
– Under tensile loading conditions, the stress state at the notch root is a function of the geometry, but the distribution (i.e. the gradient) of the largest stress component (in the
specimen coordinate system), Σzz, is not that affected by the geometry. This observation holds
true only if the defect size is kept constant. The size has a real effect on both the maximum stress value and the stress gradient.
– Under torsional loading conditions, the micro-concentrator size has only a slight effect on the maximum shear stress. The increase induced is much lower than that observed in tension. – Unlike the tensile case, the gradient when loaded in torsion is not greatly affected by the
defect geometry and size.
– When a cyclic elastic-plastic model, a multiaxial endurance criterion and a gradient correction are applied, the experimental results for the three micro-concentrator types of different sizes are correctly predicted with an error of ±10%.
– The size of the highly stressed area at the micro-concentrator root, which is smallest for the spherical defects and largest for the circumferential notches, with the ellipsoidal defects being of intermediate size, does not significantly influence the fatigue strength.
References
[1]R.E. Peterson
Design factors for stress concentrations, parts 1 to 5
Mach Des (February–July) (1951)
[2]H. Neuber
Theoretical calculation of strength at stress concentration
Czechoslovak J Phys, 19 (3) (1969), p. 400
[3]E. Siebel, M. Stieler
Dissimilar stress distributions and cyclic loading
Z Ver Deutsch Ing, 97 (1955), pp. 121–152
[4]J.E. Shigley, C.R. Mischke
Mech Eng Des (5th ed)McGraw-Hill, Inc., New York (1989)
[5]W. Eichlseder
Fatigue analysis by local stress concept based on finite element results
Comput Struct, 80 (2002), pp. 2109–2113
[6]Murakami Y, Metal fatigue: effects of small defects and nonmetallic inclusions. Elsevier editor, 2002.
[7]Y. Nadot, J. Mendez, N. Ranganathan
Influence of casting defect on the fatigue limit of nodular cast iron
[8]T. Billaudeau, Y. Nadot, G. Bezine
Multiaxial fatigue limit for defective materials: mechanisms and experiments
Acta Mater, 52 (2004), pp. 3911–3920
[9]Y. Murakami, Y. Tasunoki, T. Endo
Existence of the coaxing effect and effects of small artificial holes on the fatigue strength of an aluminium alloy and 70–30 brass
Met Trans A, 15a (1984), pp. 2029–2038
[10] J.L. Chaboche
Constitutive equations for cyclic plasticity and cyclic viscoplasticity
Int J Plasticity, l5 (3) (1989), pp. 247–302
[11]Dang Van K. In: McDowell DL, Ellis R, editors. Proceedings of advances in multiaxial fatigue. ASTM STP 1191; 1993. p. 120–30.
[12]Papadopoulos IV. Fatigue limit of metals under multiaxial stress conditions: the microscopic approach. Technical Note No. I.93.101, Commission of the European Communities, Joint Research Centre, ISEI/IE 2495/93; 1993.
[13]F. Morel
A critical plane fatigue model applied to out-of-phase bending and torsion load conditions
Fatigue Fract Eng Mater Struct, 24 (2001), pp. 153–164
[14]D. Taylor
The theory of critical distances
Engng Fract Mech, 75 (2008), pp. 1696–1705
[15]F. Morel, T. Palin Luc
A nonlocal theory applied to high cycle multiaxial fatigue
Fatigue Fract Engng Mater Struct, 25 (2002), pp. 249–665
[16]G. Bertolino, A. Constantinescu, M. Ferjani, P. Treiber
A multiscale approach of fatigue and shakedown for notched structures
Theor Appl Fract Mech, 48 (2007), pp. 140–151
[17]I.V. Papadopoulos, V.P. Panoskaltsis
Invariant formulation of a gradient dependent multiaxial high-cycle fatigue
Engng Fract Mech, 55 (4) (1996), pp. 513–528
[18]F. Morel, N. Huyen
Plasticity and damage heterogeneity in fatigue
Theor Appl Fract Mech, 49 (2008), pp. 98–127
Multiaxial fatigue limit criterion for defective materials


![Fig. 3. Evolution of the fatigue limit as a function of the defect size for the different geometries loaded in (a) tension and (b) torsion (experimental results [8])](https://thumb-eu.123doks.com/thumbv2/123doknet/7305053.209460/7.892.329.567.599.979/evolution-fatigue-function-different-geometries-tension-torsion-experimental.webp)