Analysis
of
ultraviolet
P
Cygni
profiles
in
the
spectra
of
O-type
stars
F. Nemryland
J.
Surdej2Institut
d'Astrophysique de Liège avenue de Cointe, 58-4000 Liège
Belgium
In the framework of the analysis
t"i:T,'f,r::.tioo
of ob."rved P Cygni line profiles,we describe and compa,re the nth order moment method with the line profile fitting technique. We then point out that,
if
we wantto
make a proper statistical studyof the UV P Cygni profiles observed in the spectra of O-type stars, we have to take
into account the severe pollution efects due to a forest of FeIV and FeV absorption
Iines. We discuss a method allowing to correct the observed profiles for the presence of
photospheric lines and we give estimates of the error on
M
caused by this pollution.Keywords
:
Lines: formation, Lines: identification, Lines: profile, Spectroscopy, Stars: mass loss.1-
The
nth
order
moments
'W'''
method
1.1
Definition
The
first
order momentWl
of aP
Cygni line proûle wasflrst
introduced by Castor et al. (1981)in
the framework of the Sobolev approximation.It
was generalized by Surdej (1982, 1983a, 1983b, 1985), Surdej and Hutsemékers (1990) and Hutsemékers and Surdej (1990).The
nth
order momentof a
resonanceP
Cygniline
profile formedin
an expandingenvelope
with
a terminal velocityu*
is defined by(1) where
#À
tt
the normalized line profile function and À12 is the rest wavelength of theline orofile
in
the frame of the observer.ffvru
poruX-
u-ut2
I/^o, - l/111' (2)
(3) we find that
lAspirant au Fonds National de la Recherche Scientifique (Belgium) 2Ohercheur
From this definition, we see
lhat
Wo is the equivalentwidth.
Forz
od.d., Wn does only depend on the opacity structure andfor n
even,l7r,
depends onboth
the opacity andvelocity structures.
L.2
Physical meaning of
the
moments
1.2.1
The
first
order
moment
a)
Opticallythin
lines;
Making use of the factthat
the fictitious opacityat
a givenpoint
in
the envelope is'Tt6')=Mf(x'),
where
X'
is the
reduced velocity*,
M
is the
mass lossrate
and/(X')
is
a function depending on the ionization and the velocity structures,it
can be shown that, for the caseof optically
thin
lines, the moment l{ro is given byw1
=afur)*,
(4)at*
which implies
that
lTrois
directly proportionalto
M
irrespectivelyof
the
opacity andvelocity structures, turbulence, rotation, or relativistic
efects.
Similar relations may alsobe derived for the case of resonance doublets or subordinate lines. The opacity law may be
then conveniently re-written
in
the form,i,=*îmh#
In the above expressions, 4" and
Kp
are two constants, (rù1) represents the mean ionizationfraction actoss the envelope and
.[
is the radial distance expressedin
terms of the stellar radius.b)
Opticatly thick lines:
W1is
no longer proportionalto
M,
but
by
meansof
Eqs.(a) and (5),
it
is possibleto
computeWt
as a function ofWl
andto
construct curves of astrophysical interest.L.2.2
The other
momentsMaking a same d.evelopment for the other momentsWn asfor W1, we may show that
Wl
andW!
arc related to the momentum and the kinetic erergy rate of the envelope, respectively.1.3
"log'Wo
-
log 'W$" and
"log'Wo -
log
W,,,"
diagrams
Fig.
1 illustrates,for
n
=
2,
the "logWn-
logWfl"
diagram constructedfor
18 models based on relations listedin
table 1. Given a measured moment Wn,it
is possible to deriveW|
bVjust
locatingit
in
the diagra^rn.In
this diagra,m, we seethat
for unsaturated InesWnis
on the linearpart
of the curve which impliesthatWl
is independent of the model.For saturated lines, the derived value for trYj becomes very sensitive to the adopted model.
'''.' I
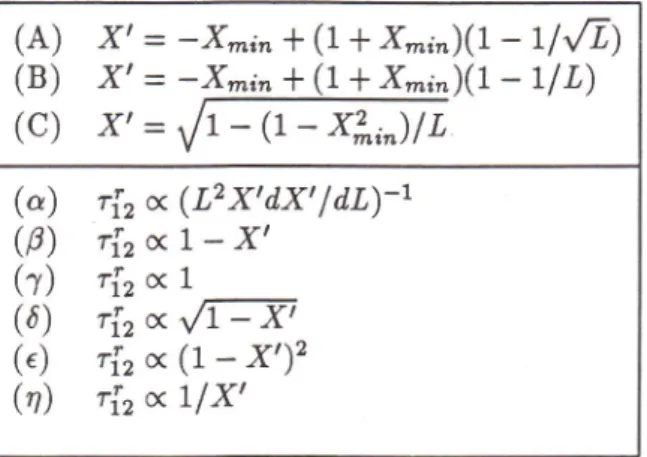
Figure L: The "logW2
-logWf"
diagram computed for 3 velocity fields a,nd 6 opacity laws(see table 1) under the Sobolev approximation.
(A)
X'=
(B)
X,=
(C)
XI
:
-
L/'[r)
-rlL)
-X*in
+
(1+
x*i")(l
-X^in
+
(1+
X^i")(l
1-
(1-
x?"àlL
(")
ri, x
(L2X'dX'1df,1-t
(p) ri2xL-X'
(r)
r{,
x I
(d) rizx,,,ffi
(.)
,iz
o
(L-
X')'
(rt)
ri, x
rlXl
Table
1.
The 3 velocity fields and 6 opacity laws used as representativeto
describe the properties of expanding envelopes.Similar diagrams are easily constructed fot Ws, Wy, and Ws.
Furthermore, "1og
Wn-logWn'"
diagrams may also be used in order to estimate the velocityand opacity structures.
In
conclusion, we cân saythat
the nth
order moment methodis
well adaptedto
thestudy of properties of expanding envelopes
in
which P Cygni profiles are formed.L.4
Comparison
with
the line profile
fitting
technique
1) The line profile
fitting
technique and the moment method are complementary : havingmade use of the
latter
oneto determineW!
and the velocity and opacity laws, thefitting
method should be an interesting toolto
confirm and/or refine the previous results.2) Measured moments are insensitive to the spectral resolution (Castor, 1981). The nth order moments method
is
then also well adaptedto
the study of under-resolvedP
Cygniline profiles.
3) The nth order moment method allows one
to
consider simultaneously large samplesof data's via the construction of observational "logWo
-logWn"
diagrams. Comparison of these diagra.ms with theoretical ones is very straightforward.4)
Contraryto
the linefitting
method whereit
is difficult
to
derive uncertainty for calculated parameters hker{rrXtr}[0,
realistic error estimates of the derived pararnetersWf;
can be easily assigned on the basisof
"IogWn-logWf;"
diagrams. Indeed, from theobserved dispersion of the "logWo
-logWf;"
curves, we can easily estimate the upper valueW{
sachthat,
dueto
the uncertaintyin
the choice of the model, the error on Wf; is lessthan
100%,
WY-
0.3L,Wy
= 0.24,Wï =
0.L7,Wy
=
0.15.5)
None of the two methods can be appliedto
the case of saturated profiles (see the asymptotic behaviour of the curvesin
Fig.
1 for la,rge values ofW!).
6) Except for the case where lines of the sa,me elements are observed, none of the above
methods solves the ultimate problem of determining the fractional ionization abundances.
1.5
Effects of turbulence
In
many cases, profi.les computed under the Sobolev approximation cannot match theob-served profiles
: it
is necessa.ry to include the presence of turbulencein
the envelope whensolving the radiative transfer equation
(cf.
Lamers et al., 1987).For optically thin lines,
it
can be shown that the profile formedin
a turbulent envelopeis
simplythe
convolution bythe
absorption profrle ofthe
P
Cygni one which would beformed
in
the srme envelope without turbulence. This leadsto
simple relations betweenthe corresponding moments Wn and Û7j, respectively (Surdej, 1985). For instance,
wo=ffi:;,
W=-w\'
-
(1+
*)''
Adequate combinations of the moments should allow us to estimate both
l7f
and;}
.2
Pollution
of
P Cygni line
profiles
by FeIV
and FeV
photo-spheric
lines
in
the
ultraviolet
spectrum
of O-type
stars
2.L
fdentification
of
the
photospheric lines
The
atlas ofIUE
O-type stars publishedby
Walborn, Nichols-Bohlin and Panek (1985)provides us
with a
uniquetool to
study the
mass loss phenomena taking placein
the atmospheresof
early-typestars.
Trying
to
measure the momentsof the
resonance line transitions due to CIV, SiIV, HeII and NfV, we encountered serious difficulties when settingthe
levelof
the local continuum whichis
severely afectedby
a forestof
FeIV and FeVphotospheric lines. This prevents one from making any accurate measurements (see Figs.
È/i'. r. S.::r .
ilii,
"
Ê! ,: trt F:.\.'r'f:.
r:. ,l l.l[,
f . :, l, :. li :'.r : l f.Figure
2:
The
"logW1-IogW!"
curves obtainedwith
the modelB.B
of tablel
and for different turbulent velocities,
*
=
O(tr),0.1(+),0.2(O), 0.3(A)Figure
3:
(u)
A
representativeSiIV
P
Cygniline
profilefor
supergiant O-type stars asconstructed
from the
average spectrumof
28 objects selectedin
the WNP
atlas.
Thevertical lines
at
the top and at the bottom of this figure represent the expected positions and strengths of FeV and FefV lines, respectively.(b)
sa,me as (a)but
for a sub-sample of 20 main-sequence and dwarf O-type stars.Figure
4:
Same asFig.
3but
forthe CIV
P
Cygni line proflles as constructed from theaverage spectrum of the 50 first (upper line) and the 48 last (lower line) O-type sta,rs in the
WNP atlas.
2.2
'What
are
the
effects due
to
the
presence
of
iron
lines?
2.2.t
A
correcting
method
In
view of the obvious efects of the FefV and FeV lines on the shape of the P Cygni UVline proflles
(
Figs. 3 and 4), one has to estimate the error introduced by the presence of the former on the derived mass loss rates. In the framework of the Sobolev approximation,we have established a method for "depolluting" the observed P Cygni proflles and restoring the profile
that
would have been recordedin
the absence of photospheric lines.We showed
that
(Nemr5
Surdej, IIernaiz, 1990),for
negative frequenciesX
in
the profile :E(x)-uffi,
(6)|.(/ and
that
for positive frequenciesX,
E(X)
-
Ep(x)
-
E"(x)
+1,
(8")xso
where
Ep(X)
is the observed flux profile,E.(X)
the
continuumflux,
E(X)
the correctedflux profrle and (E")xSs is the mean continuum flux over the negative frequencies covering
the profile.
This method was tested for different values
of
Wl
andfor
non turbulent or turbulent atmospheres (seeFig. 5). In
view of the excellent results illustratedin
figures 5a and 5b,the use of our correcting method is plainly justified.
2.2.2
Correction of
profiles and estimates
of the error
ot ù
In
view of the resultsin Fig.
6 and table 2,it
isnot
sufrcientto
set a pseudo-continuumto correct for the effects of underlying photospheric lines. Let us notice that in some cases,
Figure 5: (a) The dashed line curve illustrates the average continuum
in
the spectral rangeof the CfV doublet resonance line for 5 stars showing no wind effects. This continuum was
used in order to simulate a "polluted" resonance P Cygni line profile (solid line). With Eqs.
(6)
and (7), we correctedthis
"polluted" profile and obtained the dotted line curve. Thecrosses indicate the corresponding
P
Cygni profile calculatedwith
aflat
continuum. Theturbulent velocity was
null.
(b) same as (a) butfor
f
=
0.1.Figure
6:
(a)
The solid linein
this
figure displays the originalSifV
P
Cygoi line proflleof supergiant O-type sta.rs as illustrated
in Fig. 3a.
The dashed line correspondsto
the former line profile corrected for the photospheric absorption lines by means of the stellar spectrumin Fig.
3b, unafected by stella,r wind effects. The horizontal lines labelledA,
B, C represent different settings of the local stella,r continuum used when measuring the first order moment W1(seetext).
(b)
same us (a)but
for the representative CIV P Cygni line profile constructed from a sample of 20 main-sequence and dwarf O-type stars.-0.t -0.8 Logr(g l 'l.t -1.6 4'.A ,,1 -0.2
-
{'/' . -0.0 {.t .l -1.2 - 'l'l - .1.6Y
.'|'t -2 .22 '2'1 -2-A + rq r{")
û)
x f ds UJ J U É x f J L3 U: J u É À(Â) rato la20 Bt0 l3t0TIIî
'll'rl
,l
I [rl[1 l,'tï,
I I I' :'
I Irl
li lll uY,1 I I I I I II
r'l
'lt
t!70 l3t0 t390 t400 l4lo 6000 Ylkmirlx f J q u = J u Ê f J L U =