Usability of a home-based test for the measurement of fecal calprotectin in
asymptomatic IBD patients
Caroline Belloa, Arne Rosethb, Jordi Guardiolac, Catherine Reenaersa, Alexandra Ruiz-Cerullac, Catherine Van Kemsekea, Claudia Arajolc, Christian Reinhardd, Laurence Seidele, Edouard Louisa
a Department of Gastroenterology, University Hospital CHU of Liège, Belgium
b Department of Medicine, Section of Gastroenterology, Lovisenberg Diaconal Hospital, Oslo, Norway c
Department of Gastroenterology, Hospital Universitari de Bellvitge-IDIBELL, L'Hospitalet de Llobregat, Barcelona, Spain
d BÜHLMANN Laboratories AG, SchÖnenbuch, Switzerland
e Department of Biostatistics and Medico-economic Information, University Hospital, CHU of Lieège, Belgium
ABSTRACT
The aim of our work was to test the usability of fecal calprotectin (FC) home-based test in inflammatory bowel disease (IBD) patients.
Methods: IBD patients were prospectively recruited. They had to measure FC with a dedicated tool and
smartphone application, 5 times at two weeks intervals over an 8 weeks period. They had to fill in a usability questionnaire at the first and the last FC measurement. A System Usability Scale (SUS: 0-100) and the Global Score of Usability (GSU: 0-85) were calculated. FC was also centrally measured by ELISA. Results: Fifty-eight patients were recruited. Forty-two performed at least one FC measurement and 27 performed all the FC requested measurements. The median (IQR) SUS (0-100) at the first and last use were 85 (78-90) and 81 (70-88), respectively; the median (IQR) GSU (0-85) at the first and last use were 74 (69-80) and 77 (68-83), respectively. Adherence to the planned measurements and usability of the tool were higher in females and in less severe disease. The intra-class correlation coefficient between home-based and centrally measured FC was 0.88.
Conclusion: The adherence to home-based measurement of FC was fair. Usability scores for the home-based test
were high. There was a good correlation with the centrally measured FC by ELISA.
Keywords : Fecal calprotectin ; Home-based test ; Inflammatory bowel disease ; Self-care ; Usability
1. Introduction
Inflammatory bowel diseases (IBD)—Crohn's disease (CD) and Ulcerative Colitis (UC)—consist in chronic inflammatory conditions of the gastrointestinal tract that most of the time evolve through remitting and relapsing periods. Recently, the importance of achieving mucosal healing in these pathologies has been highlighted [1]. This has led to the concept of treat to target, the target being a composite outcome including patients reported outcome as well as intestinal healing [2]. Currently, the best way to assess intestinal healing is ileocolonoscopy, which remains the gold standard [1]. However, endoscopy presents some limitations: it is relatively expensive and its repetition is not widely accepted by patients due to its invasiveness and a low risk of complications. A non-invasive and easily available marker of bowel inflammation is fecal calprotectin (FC). It is protein produced by neutrophils. This biomarker is well correlated to endoscopic inflammation and can even detect histological inflammation despite endoscopic remission [3-6].
Current tests for FC need to be performed in laboratories, which means to collect and bring the stool samples to the hospital for analysis. That is particularly uncomfortable for patients, which may lead to relatively low adherence to the monitoring plan. In a recent large nationwide survey in France, main reasons for low acceptability of stool collection were embarrassment to collect the stools, the dirtiness feeling and the problem of transporting the sample [7].
Recently, thanks to technological developments, it has become possible to measure directly the stool concentration of calprotectin in individual samples through a rapid immunochromatographic assay captured by a
smartphone's camera, potentially transforming
the measurement of FC into a home-based test allowing the patient to measure FC him/herself [8-11]. Preliminary studies have suggested a good correlation between this measurement and classical ELISA and a good usability in healthy volunteers [10,11]. However data on IBD patients are still scarce [9,12] and the practicability of such measurements in routine practice has still to be confirmed.
Hence the primary aim of our study was to evaluate the usability of such a home-based test for the measurement of FC in IBD patients and the adherence to the planned measurements.
2. Patients and methods 2.1. Patients
We prospectively recruited patients with CD or UC, in clinical remission or with mild activity of their disease, from three IBD centers in Barcelona, Oslo and Liege. To be recruited, the patients had to be diagnosed with CD or UC for at least 6 months, be >18 years of age, have a Harvey Bradshaw Index (HBI) [13] <7 for CD and a partial clinical Mayo score [14] <3 for UC, a stable treatment with no change and no surgery planned in a near future. They also had to own a smartphone compatible with the IBDoc® tool (BÜHLMANN) and to declare themselves motivated to perform measurements of FC and to answer questionnaires.
Data collected for each patients were: age, sex, clinical centre (Lovisenberg Diaconal Hospital Oslo, Hospital Universitari de Bellvitge of Barcelona or CHU of Liège), type of IBD (CD or UC), treatment(s) (5ASA, immunosuppressants (IS), corticoids and/or biologics) and HBI (for CD patients) or partial clinical Mayo score (for UC patients).
The protocol was accepted by the Ethical Review Board of each participating centre and all patients gave their written informed consent before inclusion.
2.2. Standardized training
Patients received a standardized information on the IBDoc® device, given by trained IBD nurses or IBD doctors and got access to information documents and demonstration procedures. They also received materials and accessories in an IBDoc test kit, composed by a CALEX Valve device filled with extraction solution, a test cassette, 2 stool collection papers and one camera test card, to get trained. They had to download an app called "CalApp" on their smartphone, available on iTunes App store or on Google Play store. They had to enter their IBDoc account email address and password, and to read and accept the End User Licence Agreement (EULA).
2.3. FC measurements and questionnaires
Patients were asked to collect stool and measure FC with the CalApp (IBDoc®), as demonstrated during the training, five times, two weeks apart, over an 8 weeks period. At the second, third or fourth measurements a subset of patients (patients included at CHU of Liege hospital) was asked to perform 3 extraction procedures to test for reproducibility of the extraction process. For these extracts, as well as for all the measurements performed with the CalApp, a stool extract was sent to the central laboratory at BUHLMANN for FC measurement by ELISA. This extract was sent by the patient in specific envelopes on the day of the collection to BUHLMANN laboratory where it was received within 2-3 days and immediately frozen at -80 °C. It was defrozen only once for the fecal calprotectin measurement, within one year after having been collected and frozen. The measurement at central laboratory was blinded from the home-based test results. The patients also had to answer a structured questionnaire twice: once before the first stool collection (day 0), and once at the end of the study period, at week 8.
The questionnaire contained Likert scales (0-5) and simple questions with yes/no answer (17 overall) on the understanding of the methods, the ability to use the extraction device, the ability to use the reading cassette and the smartphone camera, and the use of the portal where results were stored. From there, we calculated a Global Score of Usability (GSU; calculated by summing up the values of the Likert scales and attributing 5 points for yes and 0 for no in the yes/no questions; ranging 0-85). The questionnaire also contained 4 other simple questions with yes/no answer, about the trust in the results, the added value of the test for disease management, the appropriateness of the use of a smartphone for a medical test and the foreseen use of this tool in the future in the routine setting. Finally a set of 10 Likert scale questions led to a second global usability score: the System
Usability Scale (SUS; ranging 0-100). The System Usability Scale (SUS) is a simple, widely used survey developed in the 1980s as a subjective measure of system usability. SUS is technology independent and has since been tested on hardware, consumer software, websites, cell-phones, IVRs and other devices [15].
We also analyzed the adherence to the monitoring plan by calculating the proportion of FC measurements done. We divided the patients in three groups: group 1: no measurement performed, group 2: 1-4 measurements and group 3: all 5 measurements.
2.4. Statistics
The results are presented as medians and quartiles (Q1-Q3) for continuous variables, and as frequency tables for categorized variables. To compare the variables between measures at day 0 and week 8, the Wilcoxon sign rank test was used for continuous variables and the McNemar test for categorized variables. The ordinal logistic regression was used to study the adherence to planned measures (according to the 3 pre-specified categories: no measurement performed, 1-4 measurements performed, all 5 measurements performed) with respect to clinical characteristics, demographics, usability scores and 4 yes/no questions about the trust in the results, the added value for disease management, the appropriateness of the use of a smartphone for a medical test and the foreseen use of this tool in the future in the routine setting. A linear regression was used to study the scores GSU and SUS with respect to the same factors. The adherence to planned measures, GSU and SUS were also evaluated in a multivariate analysis with a stepwise selection of the variables. Other comparisons were done between factors (Spearman correlation coefficient between continuous variables, chi-square test between categorical variables and Kruskal-Wallis between continuous and categorical variables).
Reproducibility of the stool extraction process by the patient was assessed by the calculation of the variance components for the three successive stool extracts performed on the same stool by the subset of patients who accepted to perform these successive stool extracts. Agreement between FC measured by the home-based test and the central ELISA was assessed by the intra-class correlation coefficient (and its 95% lower confidence limit). The difference between the two measures was assessed by the Wilcoxon sign rank test. The Bland and Altman method and the Spearman correlation coefficient were used to assess the correlation between the magnitude of the measure and the difference between the two techniques. FC measurements were also categorized in three categories: normal (≤100 µg/g), borderline (101-299 µg/g) and elevated (≥300 µg/g). The agreement between the two methods to classify the semiquantitative FC value was also estimated by the Kappa coefficient of Cohen.
Variability of the fecal calprotectin measure over time was assessed by measuring the coefficient of variation between successive measures and by analyzing the impact of time (representing the successive measures) in a generalized linear mixed model.
The performance of the home-based test to predict a fecal calprotectin >300 µg/g was assessed, calculating sensitivity, specificity, negative predictive value and positive predictive value.
Results were considered significant at the level of uncertainty of 5% (p < 0.05). The calculations were performed using SAS version 9.4 and figures were done in R version 3.2.2.
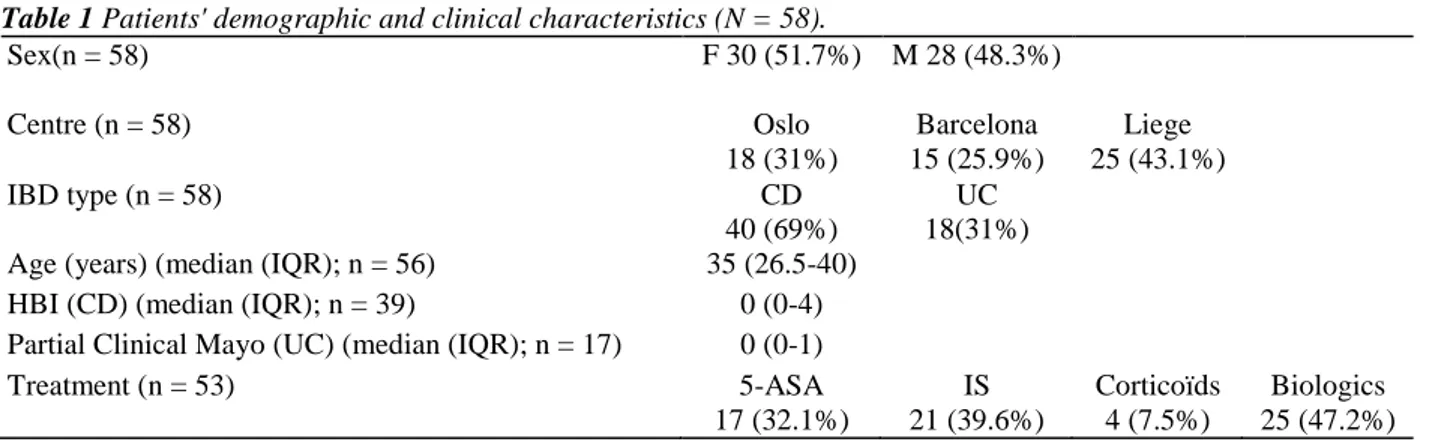
Table 1 Patients' demographic and clinical characteristics (N = 58).
Sex(n = 58) F 30 (51.7%) M 28 (48.3%)
Centre (n = 58) Oslo Barcelona Liege
18 (31%) 15 (25.9%) 25 (43.1%)
IBD type (n = 58) CD UC
40 (69%) 18(31%) Age (years) (median (IQR); n = 56) 35 (26.5-40)
HBI (CD) (median (IQR); n = 39) 0 (0-4)
Partial Clinical Mayo (UC) (median (IQR); n = 17) 0 (0-1)
Treatment (n = 53) 5-ASA IS Corticoïds Biologics
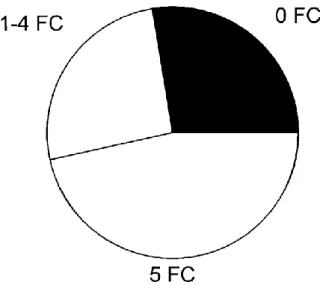
Fig. 1. Adherence to the planned fecal calprotectin (FC) measurements with the home-based test (N = 58).
Patients were split into three categories depending on the number of measurements they performed, over a total of 5 which was initially planned. 27.6% of the patient did not perform any measurement, 25.9% performed 1-4 measurements and 46.6% performed all 5 measurements.
Fig. 2. Global Score of Usability (GSU) and System Usability Scale (SUS) at day 0 and week 8 (N = 58).
Between day 0 and week 8, there was no significant change in the GSU (74 (IQR: 69.1-80) vs. 77 (IQR: 68-83)), while there was a slight but significant decrease in the SUS (85 (IQR: 77.5-90) vs. 81.3 (IQR: 70-87.5) (p = 0.0025)).
3. Results
3.1. Patients' characteristics, global adherence to the measurement plan and usability
In total, 58 patients were included into the study. Characteristics of the patients are shown in Table 1. Among the 58 patients, 42 performed at least 1 FC measurement (72.4%), and 27 (46.6%) performed the 5 requested FC measurements (Fig. 1).
The questionnaires were filled in at day 0 by 39 patients and at week 8 by 40 patients. Those patients correspond to a high proportion of the patients who measured FC at least once with the home-based test.
The median GSU was 74 (IQR: 69.1-80) at day 0, and 77 (IQR: 68-83) at week 8. There was no statistically significant difference between GSU at day 0 and at week 8 (p = 0.48) (Fig. 2).
The median SUS significantly decreased between day 0 (85; IQR: 77.5-90) and week 8 (81.3; IQR: 70-87.5) (p = 0.0025) (Fig. 2).
There was no statistically significant difference between day 0 and week 8 concerning the trust in the tool (87.1% and 90.3%; p = 0.32), the perception of a better management of the disease thanks to the tool (86.1% and 83.3%; p = 0.56), the confidence in using a smartphone for a medical purpose (100% and 94.4%; p = 0.16), and the probability of future use of the tool (100% and 97.2%; p = 0.32).
3.2. Factors associated with adherence and usability of the test
The adherence to the planned FC measurements was significantly higher in females (p = 0.034), in 5ASA treated patients (p = 0.027). It significantly increased with lower disease activity in CD (p = 0.016) and higher GSU at day 0 (p = 0.010). It differed between centers (p = 0.025); it was higher in Barcelona compared to Liege. It was also higher in patients declaring that this tool would help them to better manage their disease at day 0 (p = 0.016) (Table 2). In multivariate analysis, it was higher in females (p = 0.0077) and in 5ASA treated patients (p = 0.042).
The GSU at day 0 differed between centers (p = 0.013); it was significantly higher for Barcelona patients as compared to Liege. It also inversely correlated with disease activity assessed by HBI in CD (r = -0.47, p = 0.015). No factor was associated with GSU in multivariate analysis at day 0.
The SUS was only significantly higher in females at day 0 in univariate (p = 0.040) and multivariate analysis (p = 0.042).
Patients who were not treated with biologies expressed a greater trust (100% vs. 72.2%, p = 0.022) in the tool and thought it would help them to better manage their disease (100% vs. 65%, p = 0.007). No factor was significantly associated with the confidence in using a smartphone as a medical device. At week 8, the patients who stated they would like to use the device in the future for the management of the disease were significantly younger (36 vs. 55 years, p = 0.012).
Table 2 Ordinal logistic regression of the adherence to the planned measurements of FC with the home-based
test with respect to factors (N = 58).
Number of FC measurements 0 1-4 5 P Sex(n = 58) Female 23.3% 13.3% 63.3% Male 32.1% 39.3% 28.6% 0.034 Centre (n = 58) Oslo 22.2% 27.8% 50.0 Liège* 40.0% 32.0% 28.0% Barcelona* 13.3% 13.3% 73.3% 0.025* IBD type (n = 58) CD 25.0% 32.5% 42.5% UC 33.3% 1.1% 55.6% 0.73 Treatment (n = 53) 5-ASA 17.6% 5.9% 76.5% No 5-ASA 27.8% 33.3% 38.9% 0.027 Steroids 25% 0% 75% No steroids 24.5% 26.5% 49% 0.42 IS 23.8% 28.6% 47.6% No IS 25% 21.9% 53.1% 0.81 Biologics 28% 32% 40% No Biologics 21.4% 17.9% 60.7% 0.20
Age (n = 56) (years; median (IQR) 32 (22-44) 28.5 (24-36) 37 (31-46) 0.11
HBI (n = 39) (CD; median (IQR) 4 (2-6) 0 (0-3) 0 (0-2) 0.016
Partial clinical Mayo (n = 17) (UC; median (IQR) 0 (0-0) 3.5 (1-6) 0 (0-2) 0.86
GUS at day 0 (n = 43; median (IQR) 57.1
(32.3-79.5)
72.1 (70-80.3)
75 (71.2-81.8) 0.010 GUS at week 8 (n = 41; median (IQR) 66.4 (61.2-84) 77 (68-80) 78.3 (72.5-84) 0.14
SUS at day 0 (n = 39; median (IQR) 88.8
(77.5-93.8)
83.8 (75-86.3)
87.5 (77.5-90) 0.90
SUS at week 8 (n = 40; median (IQR) 82.5 (65-85) 75
(67.5-82.5)
83.8 (72.5-87.5)
0.10
Comfortable with smartphone use for a medical purpose (at day 0; n = 38)
No 25% 0% 0%
Yes 75% 100% 100% 0.98
Future use of the device (at day 0; n = 40) No 0% 0% 0%
Yes 100% 100% 100% 0.99
Better disease management (at day 0; n = 39) No 60% 12.5% 7.7%
Yes 40% 87.5% 92.3% 0.016
The * is indicating that the difference is significant between Barcelona and Liège.
Fig. 3. Correlations between fecal calprotectin (FC) measured with the home-based test and the central ELBA
(N = 169). The intra-class correlation coefficient between measures was 0.88 with an inferior limit of the coefficient at 0.82. The values obtained with the central ELBA were significantly higher than with the home-based test (158 (63-581) vs. 120 (49-419); p< 0.0001).
3.3. Reproducibility of the extraction and reading procedures
Eleven patients recruited at the CHU of Liege Hospital performed three successive stool extraction processes on their second, third or fourth measurement. The mean of the individual coefficients of variation was 17.5% (range: 0-42%). The analytical variation coefficient was 25.1% while the subject variation coefficient was 96.7%.
3.4. Correlations between FC measured with the home-based test and the central ELISA
A total of 169 individual FC measures were available, coming from 42 out of the 58 patients. A median of 3 matched Central ELISA/home-based tests was performed per patient. The correlation between the two measures is shown in Fig. 3. The intra-class correlation coefficient between measures was 0.88 with an inferior limit of the coefficient at 0.82. The values obtained with the central ELISA were significantly higher than with the home-based test (158 (63-581) vs. 120 (49-419); p < 0.0001). Bland and Altman method showed that the greater the FC value, the greater the difference between the central ELISA and the home-based test (r = 0.90, p < 0.0001). When categorized in normal (≤100 µg/g), borderline (101-299 µg/g) and elevated values (≥300 µg/g), 140/169 measures (82.8%) were similarly classified with the two methods and the Cohen Kappa coefficient was 0.73 (0.65-0.82). Among these 140 measures, 65 were normal, 22 borderline and 53 elevated. Among the 29 misclassified, 14 were normal with the home-based test and borderline with the ELISA, 4 borderline for the home-based test but normal with the ELISA, 6 borderline for the home-based test but elevated with the ELISA, 5 elevated with the home-based test but borderline with the ELISA.
The coefficient of variation of fecal calprotectin over time was 59% for ELISA and 69.4% for the home-based test. There was no significant impact of time in a generalized linear mixed model on the level of fecal calprotectin measured by either central ELISA (p = 0.16) or home-based test (p = 0.07).
The sensitivity, specificity, negative predictive value and positive predictive value of the home-based test to predict a fecal calprotectin >300 µg/g by ELISA were, 89.8%, 95.5%, 91.4% and 94.6%.
4. Discussion
Several studies concerning the evaluation of new tools for measuring FC by patients themselves and with the use of smartphones have been recently published. These were intended to compare the measurement of FC with these tools with the gold standard ELISA. These studies mainly concerned healthy subjects and rarely patients [8-12]. Our study confirms the good correlation between home-based and central ELISA measurement of FC on a relatively large number of pathological samples from IBD patients. It also shows a good usability of the home-based tool and a fair adherence to the planned FC measurements. Finally, it highlights patients' profiles associated with lower usability scores and at risk of lower adherence to the planned measures using this tool. Globally, the correlation between the FC measured by the home-based tool and the central ELISA was good. Particularly when FC values were categorized in normal, borderline or high, only a minority were misclassified. This is in agreement with previously reported results with healthy subjects and highlights the fact that this good correlation persists for higher FC values [10,11]. The variation between FC coming from three different extracts from the same stool sample was also relatively low when considering the range of possible variations of FC in pathological situations and its clinical relevance. This is reassuring on the validity of the extraction process made by the patients. This confirms previous studies on the feasibility of stool extraction by the patient him/herself and reproducibility between several extractions from the same bowel movement [16,17].
The global adherence to the planned measurements was fair with three quarters of the patients at least performing one measurement over the 8 weeks study period. Nevertheless, the majority of patients did not strictly adhere to the planned measures and a small number even did not perform any test. This reflects the difficulty to obtain full adherence to this kind of monitoring plan. To our knowledge, this is one of the first time this kind of adherence was formally measured in IBD. In a previous landmark and pioneering study, a higher adherence rate, around 85%, was reported from a prospective cohort in which self-measurement of calprotectin was used in the setting of a more global management plan leading to tailored dosage of infliximab in CD [12]. The higher adherence in that study may have been linked to the more extensive education and training given to the patient as well as to the formal empowerment which was linked to it, the patients having to contact the health care providers for the planning of the next infliximab infusion [12]. Also, in the present study, we requested a measurement of fecal calprotectin every other week, which is higher than usually done or recommended in routine practice. This high frequency of measurement mat have lowered the adherence. Interestingly, in the present study, we could identify profiles of patients at high risk of non-adherence: non 5ASA users, and males. Non 5ASA users may be considered as having more aggressive disease requiring immunosuppressants or biologics to be controlled. The ability to be empowered in chronic disease may be influenced by disease severity and activity, and for example, hospitalized patients with disease flare may be less keen to be empowered while outpatients in longstanding remission may be willing to take greater part in their disease management. Likewise, patients with biologics, usually more severe, had less trust in the tool and significantly less of them stated this tool would help them to manage their disease in the future. However, this correlation between empowerment ability and disease severity has not been uniformly confirmed in other chronic diseases [18]. Lower adherence also correlated to lower global usability score. This highlights that by improving usability, particularly in these specific categories of patients we might improve the adherence. Self-management can be beneficial for the patient, but it requires, on the one hand, as suggested in the Pedersen et al. study [12], a formal patients empowerment, and on the other hand a sufficient level of self-efficacy. Techniques have been developed to increase self-efficacy by specific problem-solving skills training [19,20]. In other chronic diseases where biological or clinical measures are also done by the patients, like diabetes, the adherence to self-management plan is associated with several dimensions: cost, participants' emotion, and the Self-Monitoring Blood Glucose process [21]. More particularly, the barriers identified included: frustration related to high blood glucose reading, stigma, fear of needles and pain, cost of test strips and needles, lack of motivation, knowledge, and self-efficacy. Facilitators were also identified: experiencing hypoglycemic symptoms, desire to see the effects of dietary changes, desire to please the physician, and family motivation. Although some of these factors may be similar in fecal calprotectin self-monitoring in IBD, specific barriers and facilitators should also be searched in this setting. We found that the usability, as measured by two different usability scores, can be considered as excellent [22]. There was no improvement over time but the scores were already very high for the first use. The absence of improvement over time could suggest that there is a subset of patients having difficulty to understand and use this kind of device. Those patients should be identified from the start and a complementary training should be given to them. We didn't ask patients about the highest level of education they had completed, so we don't know if those for whom the test was the easiest were those who had the highest level of education. Another recent study found a significantly higher correlation between home-based and central ELISA measured FC for academic patients, but they couldn't conclude if they simply better understood the instructions, were more
precisely oriented when performing the test, or if they asked more help if needed [9]. Only a few factors were associated with the tool usability. Particularly, the female sex was associated with a higher SUS score at day 0, both in univariate and multivariate analysis. This may have also contributed to better adherence. On the opposite, on the top of having lower adherence, CD patients with more active disease, also had lower scores of usability. Finally, we found that patients who thought to use the tool in the future were on average younger. This probably has to do with the modern character of the tool.
In conclusion, this study confirms that the use of a home-based tool for measuring FC by the patient him/herself is feasible and reached high usability scores in the patients who decided to use it. We also confirmed a good correlation between the measurements made by this home-based test and the central ELISA. Although a small half of the patients actually performed all the planned tests, a quarter did not perform all the planned test and the last quarter did not even perform any test. The adherence to the planned tests was associated with the Global Usability Score suggesting the fact that more appropriate explanations for some patients may improve the adherence by increasing self-efficacy. We also disclosed specific profiles of patients associated with low adherence and low usability, for whom the tool or the training should be adapted.
Conflict of interest
None declared.
Funding
This work was supported by a grant of the Buhlmann Company, Switzerland.
Appendix A. Supplementary data
Supplementary data associated with this article can be found, in the online version, at http://dx.doi.org/10.1016/j.dld.2017.05.009.
References
[1] Annese V, Daperno M, Rutter MD, et al. European evidence based consensus for endoscopy in inflammatory bowel disease. Journal of Crohn's and Colitis 2013;7:982-1018.
[2] Peyrin-Biroulet L, Sandborn W, Sands BE, et al. Selecting therapeutic targets in inflammatory bowel disease (STRIDE): determining therapeutic goals for treat-to-target. American Journal of Gastroenterology 2015;110:1324-38.
[3] Schoepfer AM, Beglinger C, Straumann A, et al. Fecal calprotectin more accurately reflects endoscopic activity of ulcerative colitis than the lichtiger index, C-reactive protein, platelets, hemoglobin, and blood leukocytes. Inflammatory Bowel Diseases 2013;19:332-41.
[4] D'Haens G, Ferrante M, Vermeire S, etal. Fecal calprotectin is a surrogate marker for endoscopic lesions in inflammatory bowel disease. Inflammatory Bowel Diseases 2012;18:2218-24.
[5] Guardiola J, Lobaton T, Rodriguez-Alonso L, et al. Fecal level of calprotectin identifies histologic inflammation in patients with ulcerative colitis in clinical and endoscopic remission. Clinical Gastroenterology and Hepatology 2014;12:1865-70.
[6] Lin JF, Chen JM, Zuo JH, et al. Meta-analysis: fecal calprotectin for assessment of inflammatory bowel disease activity. Inflammatory Bowel Diseases 2014;20:1407-15.
[7] Buisson A, Gonzalez F, Poullenot F, et al. Patients' point of view regarding acceptability and usefulness of inflammatory bowel disease monitoring tools: results from a nationwide multicentre study (the ACCEPT study). Gastroenterology 2016;150:s984.
[8] Hessels J, Douw G, Yildirim DD, et al. Evaluation of prevent ID and quantum blue rapid tests for fecal calprotectin. Clinical Chemistry and Laboratory Medicine 2012;50:1079-82. [9] Vinding KK, Elsberg H, Munkholm P, et al. Fecal calprotectin measured by patients at home using smartphones- a new clinical tool in
monitoring patients with inflammatory bowel disease. Inflammatory Bowel Diseases 2016;22:336-44.
[10] Elkjaer M, Burisch J, Voxen Hansen V, et al. A new rapid home test for faecal calprotectin in ulcerative colitis. Alimentary Pharmacology Therapeutics 2010;31:323-30.
[11] Weber J, Ueberschlag ME, Prica M, et al. Validation of a smartphone-based patient monitoring system measuring calprotectin as the therapy follow-up marker. Journal of Crohn's and Colitis 2015;l(S9):S212-3. [12] Pedersen N, Elkjaer M, Duricova D, et al. eHealth: individualisation of infliximab treatment and disease course via a self-managed web-based solution in Crohn's disease. Alimentary Pharmacology Therapeutics 2012;36:840-9.
[13] Harvey RF, Bradshaw JM. A simple index of Crohn's disease activity. The Lancet 1980:1:514.
[14] Walsh AJ, Ghoch A, Brain AO, et al. Comparing disease activity indices in ulcerative colitis. Journal of Crohn's and Colitis 2014;8:318-25.
[15] Brooke J. SUS: a retrospective. The Journal of Usability Studies 2013;8:29-40.
[16] Kristensen V, Malmstrøm GH, SkarV, et al. Clinical importance of faecal calprotectin variability in inflammatory bowel disease: intra-individual variability and standardisation of sampling procedure. Scandinavian Journal of Gastroenterology 2016;51:548-55.
[17] Lasson A, Stotzer PO, Öhman L, et al. The intra-individual variability of faecal calprotectin: a prospective study in patients with active ulcerative colitis. Journal of Crohn's and Colitis 2015;9:26-32.
[18] Riley JP, Gabe JP, Cowie MR. Does telemonitoring in heart failure empower patients for self-care? A qualitative study. Journal of Clinical Nursing 2013;22:2444-55.
[19] Cook PF, Emiliozzi S, El-Hajj E, et al. Telephone nurse counseling for medication adherence in ulcerative colitis: a preliminary study. Patient Education and Counseling 2010;81:182-6.
[20] Solomon MR. Information technology to support self-management in chronic care: a systematic review. Disease Management & Health Outcomes 2008;16:391-401.
[21] Ong WM, Chua SS, Ng CJ. Barriers and facilitators to self-monitoring of blood glucose in people with type 2 diabetes using insulin: a qualitative study. Patient Preference and Adherence 2014;8:237-46.
[22] Bangor A, Kotum P, Miller J. Determining what individual SUS scores mean: adding an adjective rating scale. The Journal of Usability Studies 2009;4, 114-112.