HAL Id: hal-02122434
https://hal.archives-ouvertes.fr/hal-02122434
Submitted on 7 May 2019
HAL is a multi-disciplinary open access
archive for the deposit and dissemination of sci-entific research documents, whether they are pub-lished or not. The documents may come from teaching and research institutions in France or abroad, or from public or private research centers.
L’archive ouverte pluridisciplinaire HAL, est destinée au dépôt et à la diffusion de documents scientifiques de niveau recherche, publiés ou non, émanant des établissements d’enseignement et de recherche français ou étrangers, des laboratoires publics ou privés.
Loutfi Nuaymi, Ziad Noun
To cite this version:
Loutfi Nuaymi, Ziad Noun. Simple capacity estimations in WiMAX/802.16 system. PIMRC’06 : 17th annual IEEE international symposium on personal, indoor and mobile radio communications, september 11-14, Helsinki, Finlande, Sep 2006, Helsinki, Finland. �10.1109/PIMRC.2006.254129�. �hal-02122434�
1-4244-0330-8/06/$20.002006 IEEE
SIMPLE CAPACITY ESTIMATIONS IN WIMAX/802.16 SYSTEM
Loutfi Nuaymi, Ziad Noun
ENST Bretagne
CS 17607 - 35576 Cesson-Sévigné Cedex - FRANCE e-mail: { loutfi.nuaymi, ziad.noun}@enst-bretagne.fr ABSTRACT
In this paper, we propose some simple capacity estimations for WiMAX/ IEEE 802.16 system. The OFDM Physical layer of 802.16 is considered. We compare between the now-classical data rates values based on OFDM considerations and data rates obtained in simulation taking into account inter-cell interference. Figures are given for various scenarios of frequency reuse (1x1 and 1x3) and services (real-time and FTP) allowing interesting observations about WiMAX radio efficiency. These results can be used as an order of magnitude of more realistic WiMAX performance results.
I. Introduction
WiMAX Technology promoted by the WiMAX Forum and based on IEEE 802.16-2004 standard [1] and its amendment 802.16e [1a] is a very promising BWA, Broadband Wireless Access, Technology. Some studies have been published about the throughput of WiMAX [3], [4]. These papers consider a complex system simulator. In this paper we try to estimate the capacity of WiMAX system with simple Matlab programs. We consider a simple simulation model in order to have some results that can be considered as an order of magnitude for the more realistic results. The figures obtained give way to some interesting comments.
The system model is described in the following Section. In Section 3, we propose data rates values based on OFDM and WiMAX system considerations. In Section 4, we estimate the effect of interference which cannot be avoided in wireless systems on data rate and system performance. The figures obtained in Sections 3 and 4 are commented in the last section which contains also the conclusion.
II. Simulation model
In order to study the capacity of WiMAX system, we consider a dense urban interference-limited network deployment with uniformly distributed subscriber stations (SS) in many cells. We consider the OFDM-256 PHYsical Layer of IEEE 802.16, the only one included in the first WiMAX Forum system profiles. During data transfer, the subscribers stay at the same position (stationary) and are always connected to their initial best serving base station (BS). The considered model has 36 sites in a wrapped-around (torus-like) zone with 3 sectors per site, and 900 m site-to-site distance, leading to 108 sectors (300m cells).
Simulations have been performed in 1x1 and 1x3 frequency reuse schemes. 3.5 MHz (1x1 model) and 10.5 MHz (1x3 model) bandwidth availability scenarios in the 3.5 GHz
frequency band have been assumed. These 2 models lead to 1 cell per site with 3.5 MHz bandwidth frequency for each cell. The base stations (BS) operate in FDD (Frequency-Division Duplexing) mode, with 10 ms frame duration (see [1] for all possible frame durations of a 802.16 system). The OFDM symbol duration is Ts = Tb+Tg where Tb is the useful symbol
time, given by:
FFT b )*8000*N 8000*n BW floor( T=
where BW is the frequency bandwidth (BW=3.5 MHz in our case), n is the sampling factor (n=8/7) and NFFT is the length
of Fast Fourier Transformation (NFFT = 256). This equation
leads to a Tb equal to 64µs. The guard time is noted Tg, and
corresponds to the CP (Cyclic Prefix). The value of Tg is
given by [1]: Tg = G*Tb
where G is the ratio of CP time to useful time. We choose
G = 1/16 which leads to Tg = 4 µs and Ts = 68µs. The number
of OFDM symbols in the frame can then be computed. It is equal to 147 symbols per frame (see Figure 1). We study the capacity of WiMAX system in the downlink. In this case, 3 OFDM symbols are dedicated to the preamble at the beginning of the frame (2 OFDM symbols) and to the FCH, Frame Control Header, a subheader in the downlink frame (1 OFDM symbol).
Frame i-2 Frame i-1 Frame i Frame i+1 Trame i+2
Downlink frame DL PYH PDU
preamble FCH DL burst #1 DL burst #2 … DL burst #n
3 OFDM Symbols 144 OFDM Symbols
Figure 1: FDD Downlink Frame
We do not consider the MAP messages (DL-MAP and UL-MAP) which sizes from 2 and up to 15 OFDM Symbols depending of the number of users of the frame. As a result, we have 144 OFDM symbols as payload symbol.
An Erceg propagation model [2] and a slow fading (standard deviation equal to 8 dB) have been considered. The radio interface supports full automatic Link Adaptation functionality with maximum throughput optimization. The BS transmitted power is fixed and equal to 2 Watts, i.e., downlink power control is switched off. The BS antenna is considered to be 35 m above the ground, with 17 dBi gain. The SS antennas heights are fixed equal to 1.5 m above the ground, 0 dBi gain. Table 1 gives an overview on the main parameter settings used in our simulation model.
Table 1. The simulation model main parameters
Parameter value
Number of sites 36 Number of cells 108 Frequency reuse pattern values 1x1 1x3
Available bandwidth 3.5 MHz (in 1x1 scheme) 10.5 MHz (in 1x3 scheme) Frequency band 3.5 GHz
MSS distribution Random uniform Propagation model Erceg A [2] BS RF TX power 2 watts (33 dBm)
BS antenna 17 dBi, 35 m above ground MSS antenna ground Omni, 0 dBi, 1.5 m above Power control (PC) Downlink PC switched off Slow fading std.
deviation 8 dB Modulation and coding
rate 64QAM ¾ (all WiMAX Modes) BPSK ½, QPSK ½,…, Link adaptation criterion Enabled, best throughput OFDM symbol duration 68 µs, 4µs CP (Cyclic Prefix) Duplexing FDD
Frame duration symbols MAP + 144 symbols 10 ms (147 OFDM symbols, 3 payload)
Scheduler Cyclic Round Robin
III. Data rates calculation interference not considered
The WiMAX throughput is given by the equation: E * coderate * G 11 * N N * 8000 * ) 8000*n BW floor( throughput FFT used + =
where Nused is the number of used subcarriers (data
subcarriers), Nused = 192, coderate is the rate of channel
coding and E is the modulation efficiency (the number of bits per subcarrier). Coderate and E are function of the modulation and coding scheme (MCS), e.g. coderate = ½ and E = 4 when the 16-QAM, 1/2 MCS is considered.
According to this equation, the throughput of a WiMAX cell for the different WiMAX MCSs is given in Table 2 (Bandwidth = 3.5 MHz).
Table 2. throughput of WiMAX cell, in Mbit/s, for 3.5 MHz bandwidth G ½ BPSK 1/2 QPSK 3/4 QPSK 16-QAM 1/2 16-QAM ¾ 64-QAM 2/3 64-QAM ¾ 1/32 1.46 2.92 4.36 5.82 8.73 11.64 13.09 1/16 1.41 2.82 4.23 5.65 8.47 11.29 12.70 1/8 1.33 2.67 4.00 5.33 8.00 10.67 12.00 1/4 1.20 2.40 3.60 4.80 7.20 9.60 10.80
The equation above considers all the frame (including synchronization and control messages) as useful throughput. Hence the effective throughput is smaller if the following overheads are considered: the preamble length (2 OFDM symbols in the beginning of downlink frame), FCH message length (1 OFDM symbol), and broadcast messages (DL-MAP, UL-(DL-MAP, UCD, DCD…) which length is variable according to the number of served users in the cell, as well as to the length of control message specified to each user.
For BW = 3.5 MHz, FDD duplexing, frame duration equal to 10 ms, 10 active users in the cell, normal transmission (AAS, STC, subchannelization, etc. not used), the MAP messages not containing an Extended_IE (Extended Information Element), the effective WiMAX throughput is given in Table 3.
Table 3: effective WiMAX throughput, in Mbit/s (BW= 3.5 MHz, frame duration = 10ms, 10 users)
G 1/2 BPSK 1/2 QPSK 3/4 QPSK QAM 16-½ 16-QAM ¾ 64-QAM 2/3 64-QAM 3/4 1/32 1.33 2.67 3.99 5. 33 8.00 10.67 12.00 1/16 1.29 2.58 3.88 5.18 7.77 10.35 11.65 1/8 1.20 2.42 3.63 4.84 7.27 9.70 10.91 1/4 1.07 2.15 3.23 4.31 6.47 8.63 9.71
The spectrum efficiency is given by the equation below:
BW t throughpu effective efficiency Spectrum =
According to this equation, the Spectrum efficiency may reach 3.4bit/s/Hz
5 . 3 12
= (in 64-QAM ¾ case), which is a relatively high efficiency compared to other known wireless and cellular systems.
IV. Effect of interference on data rates
In this section we try to estimate the WiMAX performance taking into account inter-cell interference. Simulations are executed with Matlab programs based on the system model described in section 2. The modulation/coding thresholds are taken from papers [3], [4]. Two types of service are considered: either a real time service with 200 Kbits/s as fixed throughput, or 500 Kbytes download file as FTP service.
All the users that have a real time service try to access to the system for one time. The users that have a sufficient modulation/coding scheme (>QPSK ½) are accepted by the system. The others, which have a BPSK ½ or QPSK ½ modulation/coding scheme are considered as blocked (to avoid charging system for long time with modulation/coding schemes having a poor spectrum efficiency). For these users, we calculate their percentage according to the total number of real time users. Once the user is connected to the system, he remains served until the end of simulation. We calculate, for active users (not blocked), the percentage of ‘outage’ time where the received signal strength of some active user is below the corresponding threshold of their modulation/coding schemes.
Table 4: percentage of blocked users (real time service) according to frequency reuse pattern
Frequency reuse pattern Percentage of blocked users 1x1 37% 1x3 7%
Figure 2: percentage of ‘outage’ time as function of users’ number per cell in two frequency reuse patterns
(1x1 reuse pattern)
The users that have a FTP service try to connect to the system during at least in one minute. If the connection is blocked (received strength signal is not sufficient, even for QPSK ½), the user try to connect to the system at another
time. A user that have a successful download try to connect to the system again for a new service. For these users we calculate the mean download delay of a 500 Kbytes file. The BS serves the real time connections first and then divides the remaining bandwidth between the FTP connections in an equal manner (cyclic round robin scheduler). Finally we calculate the mean cell throughput and spectrum efficiency of the system.
Two simulations are performed where the two types of service are considered. In the first simulation the 1x1 frequency reuse pattern is used. The 1x3 pattern is used in the second simulation. Each user has one type of service, 40% of users have a real time service and 60% have a FTP service. The percentage of blocked users (real time service) is given in Table 4. The percentage of ‘outage’ time is given by figure 2. The mean download delay (for FTP service) is given by figures 3 and 3a. The mean cell capacity is given by figures 4 and 4a. As result, the spectral efficiency goes from 1.6 to 0.55 bit/s/Hz (1x1 model) and from 1.7 to 0.94 bit/s/Hz (1x3 model).
A third simulation has been performed in 1x1 frequency reuse pattern, where only the FTP service is considered, i.e., all users have the same service. The results are given in figures 5 and 6. The spectrum efficiency goes from 3 to 0.7 bit/s/Hz.
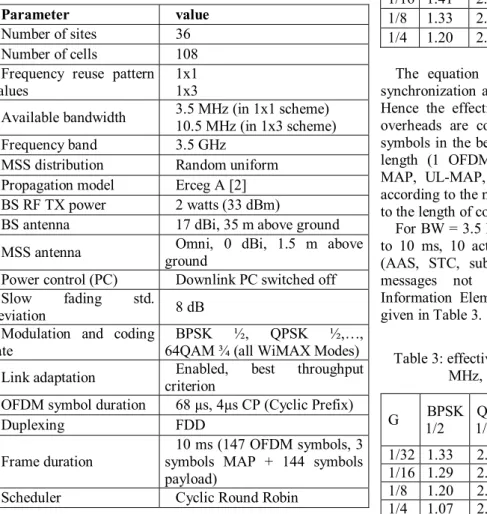
Figure 3: mean download time (in seconds) as function of mean number users per cell in a 1x1 frequency reuse pattern
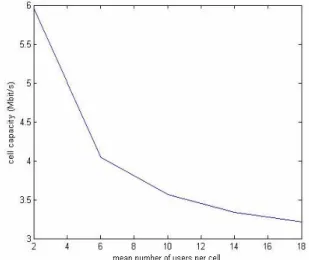
A fourth simulation is performed in 1x1 frequency reuse pattern, where only the real time service is considered, the simulation is performed as ‘snap shot’. The bandwidth is divided in an equal manner between the users. The percentage of blocked users is 20%. The cell capacity is shown in figure 7. The spectrum efficiency varies between 2 and 1.6 bit/s/Hz. The reason for this big efficiency is the snap shot simulation where the variation of received signal strength is not considered.
V. Analysis of results and conclusion
In this paper we propose estimations of the capacity of WiMAX system. Considering a simple simulation model we propose some results that can be used as an order of magnitude for the more realistic results.
Using 1x3 frequency reuse pattern, the interference is reduced in the system. This interference reduction allows users trying the access to system to have a good carrier-to-noise ratio. This explains the difference between the two percentages of blocked users in table 4. As a counterpart, the data rate efficiency in bits/s/Hz/Cell is smaller.
Figure 3a: mean download time (in seconds) as function of mean number users per cell in a 1x3 frequency reuse pattern
Figure 4: cell capacity (in Mbits/s) as function of users’ number per cell in a 1x1 frequency reuse pattern In figures 2, 3 and 4, it is clear that the system performances depend strongly on the users’ number. The system in the 2 frequency reuse patterns have approximately the same results in case of little number of active users. Then, these results differ greatly when the number of active users per cell increases, i.e., where the interference level increases. In figure 3, the mean download time of 500 Kbytes’ file becomes smaller in 1x3 reuse pattern than 1x1.
In figure 4 we notice the difference of system capacity between the 2 reuse patterns, where this capacity decreases from 3.2 Mbit/s in 1x3 model to less than 2 Mbit/s in 1x1 model, in case of a loaded system. Hence, the spectral efficiency decreases from 0.94 bit/s/Hz in 1x3 model to 0.55 bits/s/Hz. This interesting efficiency, even in a 1x1 reuse pattern, shows the advantage of WiMAX technology in comparison to other technologies.
Figure 4a: cell capacity (in Mbits/s) as function of users’ number per cell in a 1x3 frequency reuse pattern
Figure 5: mean download time (in seconds) as function of users’ number per cell
Figure 5 represents the mean download time of 500 Kbytes file where all users have the same service. Evidently, this time increases when the active users’ number increases. We notice that the system is more efficient than before (when we considered two services in the system). This is because in this case the system has one service which can be achieved quickly and the resources become quickly free again instead of serving a user that have a long time service (real time service as video conference). This explains the higher system
capacity especially in case of small number of active users in the system (11 Mbit/s), where the BS achieves the service quickly (less than 1 second) and becomes free again, listening if there is some user asking for a new service. So the interference duration created by this BS is very small, hence the interference level in the system is very small.
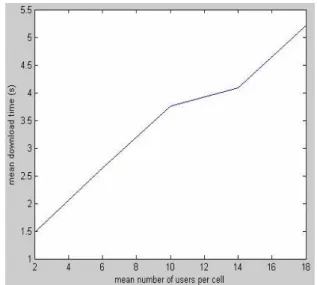
Figure 6: cell capacity (in Mbits/s) as function of users’ number per cell
Figure 7: cell capacity (in Mbits/s) as function of users’ number per cell
As a conclusion we can say that capacity is highly correlated to the number of active users in the system, the services types and the frequency reuse pattern. WiMAX system presents an interesting spectrum efficiency in comparison to other wireless technologies (0.55 bit/s/Hz in 1x1 frequency reuse pattern and 0.94 bit/s/Hz in 1x3 pattern) while supporting many types of service such as real time service, FTP service and others. The WiMAX performances
can be more efficient if some advanced techniques like AAS (advanced antenna systems) and MIMO (Multiple-Input Mutliple-Output) are considered. Efficient radio resource management procedures such as power control allow the use of 1x1 pattern with a small outage probability. This is then a guaranty to have a high spectral efficiency. A Future topic of research would be the study of power control of WiMAX: what can be proposed in the framework of WiMAX and what are the corresponding performances.
REFERENCES
[1] IEEE 802.16-2004, IEEE Standard for local and metropolitan area networks, Air Interface for Fixed Broadband Wireless Access Systems, Oct. 2004.
[1a] IEEE 802.16e, IEEE Standard for local and metropolitan area networks, Air Interface for Fixed Broadband Wireless Access Systems, Amendment 2: Physical and Medium Access Control Layers for Combined Fixed and Mobile Operation in Licensed Bands and Corrigendum 1, Feb. 2006 (Approved: 7 dec 2005).
[2] V. Eceg, K.V.S Hari, M.S. Smith, D.S. BAUM, “Channel Models for Fixed Wireless Applicatons”, IEEE 802.16.3c-01/29r4, Jul. 2001.
[3] C.F. Ball, E. Humburg, K. Ivanov, F. Treml, “Performance Analysis of IEEE 802.16 Based Cellular MAN with OFDM-256 in Mobile Scenarios”, IEEE VTC 2005 Spring, May. 2005.
[4] C.F. Ball, F. Treml, X. Gaube, A. Klein, « Performance Analysis of Temporary Removal Scheduling applied to mobile WiMAX Scenarios in Tight Frequency Reuse », IEEE PIMRC 2005, Sep. 2005.