HAL Id: hal-02450541
https://hal.archives-ouvertes.fr/hal-02450541
Submitted on 23 Jan 2020
HAL is a multi-disciplinary open access
archive for the deposit and dissemination of
sci-entific research documents, whether they are
pub-lished or not. The documents may come from
teaching and research institutions in France or
abroad, or from public or private research centers.
L’archive ouverte pluridisciplinaire HAL, est
destinée au dépôt et à la diffusion de documents
scientifiques de niveau recherche, publiés ou non,
émanant des établissements d’enseignement et de
recherche français ou étrangers, des laboratoires
publics ou privés.
Intracavity Brillouin gain characterization based on
cavity ringdown spectroscopy
Ananthu Sebastian, Stephane Trebaol, Pascal Besnard
To cite this version:
Ananthu Sebastian, Stephane Trebaol, Pascal Besnard. Intracavity Brillouin gain characterization
based on cavity ringdown spectroscopy. OSA Continuum, OSA Publishing, 2019, 2 (12),
pp.3539-3545. �10.1364/OSAC.2.003539�. �hal-02450541�
Intracavity Brillouin gain characterization based
on cavity ringdown spectroscopy
A
NANTHUS
EBASTIAN,
1S
TÉPHANET
REBAOL,
1,* ANDP
ASCALB
ESNARD11Univ Rennes, CNRS, Institut FOTON - UMR 6082, F-22305 Lannion, France *Corresponding author: [email protected]
Abstract: We report a technique based upon the cavity ringdown method that enables to characterize the Brillouin gain coefficient directly in a laser cavity. Material gain, optical cavity parameters and lasing properties can be extracted from measurements whithin a single experiment.
© 2019 Optical Society of America under the terms of theOSA Open Access Publishing Agreement 1. Introduction
The constant need for laser spectral purity improvements is driven by the growing panel of applications in fundamental [1, 2] and applied physics [3, 4]. One of the most promising approach to generate compact and narrow linewidth lasers is based on the stimulated Brillouin scattering (SBS) optical nonlinearity [5]. The establishement of SBS in an optical cavity [6] gives rise to the coherent emission of a Stokes wave. Impressive noise performances have been reported in such Brillouin lasers [7–9]. To reach such high laser performances, one of the most important parameters to evaluate is the material gain coefficient.
The brillouin gain coefficient, can be expressed in function as material parameters by [10]: gB=
2πn7p2 12
cρ0λ2p∆νBVA
(1) where c is the vacuum velocity of light, λpthe laser pump wavelength and ∆νBis the Full Width
at Half Maximum (FWHM) of the Brillouin gain. Other parameter values are given in table 1. Usually, the gBmay be estimated through classical pump-probe experiments [11], self-heterodyne
[12], Fabry-Perot interferometry [5] or threshold power determination [13, 14]. In those methods, the SBS phenomenon is generated by injecting a pump power signal in a single-pass waveguide. Close to SBS threshold, a Stokes signal can be efficiently created in the counter propagating direction of the incident pump.
The Stokes frequency is downshifted from the pump frequency by the Stokes shift νB. The
associated gain profile is described by: gB(ν) = gB
(∆νB/2)2
(ν − νB)2+ (∆νB/2)2
(2) Probing the gain profile by above mentionned methods allows to determine ∆νB. Then introducing
∆νBvalue and material constants, extracted by other experimental means or from calculations,
into Eq. (1) gives a Brillouin gain coefficient estimation. Those methods suffer from several drawbacks. First, to reach the SBS threshold, one have to either use long waveguide [13] or high pump power [14], which are not always suitable depending on the material and cavity design (waveguide, microresonator). And secondly, the gBparameter can be inferred at the expense of
knowing material constants, which are not systematically available depending on the material under study.
The cavity ringdown method (CRDM) has been successfully implemented in various optical cav-ities [15–17] to determine coupling regime and dispersive properties [15], selective amplification in erbium doped media [18], mode coupling [19] and nonlinear parameters [20, 21].
In this letter, we propose to extend the use of the CRDM to retrieve the Brillouin gain coefficient.
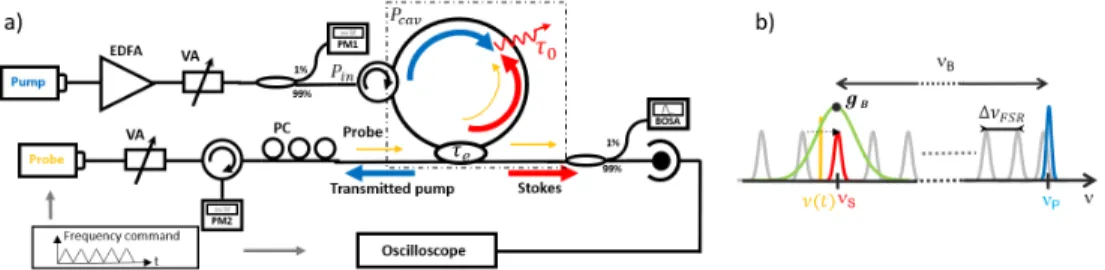
Fig. 1. a) Experimental setup for Brillouin gain cavity ringdown determination. EDFA: Erbium-doped fiber amplifier, VA: variable attenuator, PC: polarization controller, BOSA: Brillouin optical spectrum analyzer, PM : Powermeter. b) Spectral overview of the CRDM method. Pump laser line (blue), Brillouin gain curve (green), probed cavity mode (red) and probing laser line (yellow). νBcorresponds to the Brillouin shift, where ∆νF SRstands for the spectral spacing between cavity modes.
Performing Brillouin gain characterization inside the laser cavity allows to take advantage of the light recirculation of the Stokes wave inside the resonator. In fact, this tends to strongly reduce the length of the waveguide and the applied laser-pump power required to reach the SBS threshold in comparison to usual pump-probe techniques. Moreover, the gain coefficient is retrieved without the need of material parameter values. It allows also to identify several nonlinear processes that can occur for example in high-Q resonator as thermal drift and Kerr effect [21].
The paper is organized as follows : First, we describe the procedure to retrieve the intracavity Brillouin gain coefficient from the CRDM technique. Then, we detail the experimental bench used to generate and probe the SBS gain in the cavity and finally we detail and discuss our results.
2. Principle
Figure 1 b) recalls the spectral arrangement of waves taking part in the SBS process when studied in a resonant cavity. The blue line corresponds to the pump signal at frequency νPthat produces
a Stokes gain (green curve, Eq. (2)) through the SBS process. In the background of the figure, the periodic distribution of the ring cavity modes are colored in gray. Our cavity configuration is based on a non-resonant pumping. It includes a circulator that does not allow resonant clockwise propagation. Thus the laser pump only experiences a single round trip before being ejected. It also prevents any cascaded Brillouin generation to occur. Then, only the first order Stokes wave is resonant in the fiber ring cavity. The perimeter of the resonator, that fixed the free spectral range of the cavity (∆νFSR), and the spectral gain distribution insure to favor the amplification of
one cavity mode (red color line), that we call the Stokes-mode. We consider that the Stokes-mode at the frequency νS is seeded at the maximum of the gain value gB.
We have now to determine how the Stokes-mode linear-losses might be compensated by the Brillouin gain as a function of the incident pump power Pin. The following model description is
based on the coupled mode theory described elsewhere [15, 22] and adapted to the present study for the purpose of Brillouin gain characterization.
The resonator schematic is shown in Fig. 1 a) (dashed square). We consider the temporal amplitude evolution uS(t) of the Stokes-mode. Its total photon lifetime τ/2 experienced by this
cavity mode is: 1 τ = 1 τ0 + 1 τe (3) where τ0/2 and τe/2 are the intrinsic photon and the coupler lifetimes respectively. The intrinsic
photon lifetime expresses the losses or gain of the cavity while the coupler lifetime relates to the coupling strength between the cavity and the input/output fiber. We can relate the coupling coefficient |κ2| and the intensity round-trip attenuation a2to their respective photon lifetime.
Indeed, in the high finesse approximation (|κ|2× a2≈ 1) [23], the coupler lifetime can be related
to the coupling coefficient by |κ2|= 2τ
L/τewhere τLis the photon round-trip time. The intrinsic
photon lifetime τ0is related to the intensity round trip attenuation a2by:
a2 = 1 − 2τL/τ0 (4)
Then a positive τ0 corresponds to an optical attenuation with a2 < 1 while a negative τ0
implies optical Brillouin gain with a2 > 1. Moreover, the intensity round-trip attenuation of the
Stokes-mode can be expressed as:
a2= β × e−αLLegBPc a vLeff/ Aeff = a2
opegBPc a vLeff/ Aeff (5)
where β is the inner local losses including the contribution of splices, circulator and coupler; αL
the fiber-loss coefficient; Aeffthe effective fiber-mode area. L and Leffare respectively the cavity
length and the effective interaction length. a2opis the intensity round-trip attenuation of the cold
cavity mode without stimulated Brillouin scattering. Here Pcavis the nonresonant intracavity
pump power.
As can be seen in Eq. (5), increasing the pump intensity Pcav, allows the resonator linear losses
experienced by the Stokes-mode to be compensated over a single round-trip. Thereby, intensity round-trip attenuation a2and intrinsic photon lifetime τ
0can be tuned through pump intensity
keeping constant the coupler lifetime.
τ0can be evaluated experimentally using the CRDM technique and therefore a20and a2. Indeed,
the probe signal coupled in the Stokes mode, through the coupler, will experience attenuation or amplification within a round-trip. It follows that, experimental estimation of the Brillouin gain coefficient can be obtained by using Eq. (4) together with Eq. (5):
gB= Ae f f PcavLeff lna 2 a2op (6)
The CRDM technique consists in probing the Stokes-mode by sweeping the frequency of a tunable narrow linewidth laser (yellow color line on Fig. 1) across the resonance. The sweeping speed of the laser is tuned sufficiently fast to observed ringing phenomenom characteristic from the transient response of the cavity. In its current version, our experimental bench allows to study resonator Q-factor as low as 107. The ringing effect is a signature of interferences between the
probing laser and the cavity mode waves at the output of the coupler. In a previous paper [15], we have determined an analytical expression for the transient response of a resonator as function of τ0, τeand the sweeping speed. By use of a least square method, this expression can be used to
retrieve the resonator lifetimes and then the Brillouin gain coefficient as shown on Fig. 2.
3. Experimental setup
The experimental setup is presented in Fig. 1 a). The fiber cavity is composed of a L= 20 m polarization maintaining silica fiber distributed as L1= 19 m from coupler to isolator and L2 = 1
m between isolator and coupler. Fiber length uncertainty is of the order of ±0.6 m. This cavity length giving a free spectral range (FSR) of ∆νFSR = 10 ± 0.3 MHz. The transient response
0.0 5.0 10.0 15.0 20.0 25.0 0.0 0.5 1.0 1.5 2.0 2.5 3.0 3.5 0,0 5,0 10,0 15,0 20,0 25,0 30,0 35,0 40,0 0,0 0,5 1,0 1,5 2,0 2,5 3,0 3,5 Time(s) 0,0 5,0 10,0 15,0 20,0 25,0 0,0 0,5 1,0 1,5 2,0 2,5 3,0 3,5 Tr ansm ission Time(s) 0,0 5,0 10,0 15,0 20,0 25,0 0,0 0,5 1,0 1,5 2,0 2,5 3,0 3,5 Experiment Theory Tr ansm ission
a)
b)
c)
d)
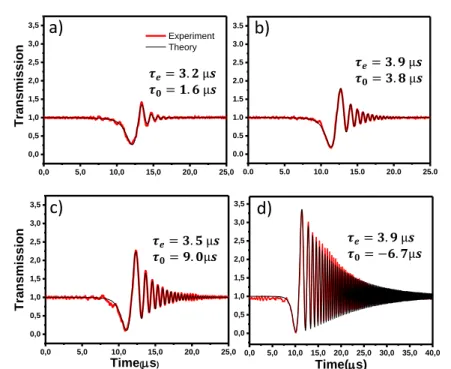
𝝉𝒆= 𝟑. 𝟐 µ𝒔 𝝉𝟎= 𝟏. 𝟔 µ𝒔 𝝉𝒆= 𝟑. 𝟗 µ𝒔 𝝉𝟎= 𝟑. 𝟖 µ𝒔 𝝉𝒆= 𝟑. 𝟓 µ𝒔 𝝉𝟎= 𝟗. 𝟎µ𝒔 𝝉𝒆= 𝟑. 𝟗 µ𝒔 𝝉𝟎= −𝟔. 𝟕µ𝒔Fig. 2. Transient responses of the probed cavity mode for various laser pump powers. From a) to d) the resonator-coupling regime shifts with increasing pump power from under coupling (Pin= 13.8 mW), critical coupling (Pin= 39.1 mW), over coupling (Pin= 41.7 mW) and
selective amplification regime (Pin= 58.5 mW). The sweeping speed extracted from the
theoretical fit gives ˜Vs= 2.8MHz/µs
acquired by the CRDM technique results from the beating between the transmitted probe and the output coupled Stokes-mode at the output of the coupler. The intensity of the probe, seeded in the Stokes-mode, has to be precisely determined after one round-trip. It is related to the input probe at the coupler position by the intensity round-trip attenuation (see Eq. (5)). The effective interaction length have to be precisely determined to optimized the evaluation of gB.
For our cavity configuration, Leff= L1+ |t2| × L2= 19.9 ± 0.6 m where the coupler transmission
coefficient |t2|= (1 − |k2|) is introduced to incorporate the pump intensity attenuation through
the coupler. The effective area of the fiber is Aeff= 84.9 ± 0.2 µm2. A part of the Stokes wave is
extracted from the resonator through a 95/5 coupler.
The experimental configuration to pump the SBS cavity is based on a single mode laser with 250 kHz linewidth centered at 1550 nm. Its intensity is amplified through an EDFA and then adjusted by a variable attenuator. 1 % of the pump is extracted through a coupler for intensity power monitoring (PM1). The nonresonant intracavity pump power Pcavis determined just after
the circulator and can be related to Pinby Pcav= α × Pinwhere α= 0.758 is the relative losses
experimentally evaluated. The circulator ensures a single pass of the pump signal within the fiber loop preventing re-injection. For sufficiently intense pump intensity, stimulated Brillouin Stokes signal is generated in the opposite direction of the pump signal. Extracted Stokes signal is analyzed spectrally through a high resolution BOSA and the intensity is recorded by a photodiode. The lasing threshold is determined when pump depletion starts corresponding to a pump power Pthequal to 62 mW.
We will now describe the CRDM setup. All the measurements are performed for a pump power Pinlower than the pump power lasing threshold Pth(corresponding to a range of 1-100 mW
Table 1. Material values for pure and 3% GeO2doped silica fibers.
Parameters SiO2 SiO2+ 3%GeO2
[25] [26] Refractive index [n] 1.45 1.46 Elasto-optic coefficient [p12] 0.271 0.236
Density [ρ(kg.m−2)] 2200 2244
in our main set-up) to be within the validy domain of the technique [15]. The probe signal is provided from a tunable laser with 250 kHz linewidth. The input power is less than 1 mW to prevent any saturation of the Brillouin gain medium. The sweeping speed extracted from the theoretical fit of the experimental data gives ˜Vs= 2.8MHz/µs. Before entering the cavity, the
signal intensity is controlled by a variable attenuator (VA) and its polarization adjusted through polarization controller (PC). The probe laser frequency is positioned close to the Stokes-mode with the help of the 10 MHz-resolution BOSA. The probe frequency is continuously swept across the resonant Stokes signal by a frequency command allowing the sweeping speed and the scanned frequency range to be adjusted. The transmission of the cavity mode is then collected by a photodiode and observed on an oscilloscope triggered by the frequency command.
Table 2. Comparison of gBvalues obtained for single mode silica fiber [24] in various
works. SH stands for Self-Heterodyne.
Methods gBvalue standard deviation
[×10−11m/W] [±10−12m/W] CRDM [our work] 1.94 1.5 SH [silica value] 2.45 1.8 SH [3% GeO2value] 1.92 1.4 Pump-probe [25] 2.29 -4. Results
CRDM signals are collected for input pump powers varying from 0 to Pth. Figure 2 presents
various CRDM signals collected for pump power ranging from 13.8 to 58.5 mW (red color curves). The normalized transmission is plotted as function of time. For increasing pump power, the amplitude, the number and the frequency of oscillations increase. To get more insight on those specific temporal signatures, data are fitted using the procedure described above and allows to determine τ0 and τeas function of Pin (See Fig. 2). As expected the τevalue is constant
over all the measurements because the coupler losses are fixed. For Pin = 0 mW, the cold
cavity parameters are extracted and gives τe = 3.8 µs and τ0 = 1.2 µs. Using the definition
Q = 2πνSτ/2 gives an estimated quality factor of 5.6 × 10⁸. For Pin = 13.8 to 50.1 mW,
τ0 increases, modifying the coupling regime from undercoupling (cold cavity) to the critical
coupling, the overcoupling and finally the transparency regime. For 50.1 mW< Pin< Pth, τ0
takes a negative value corresponding to the amplification regime. Indeed, the variation of τ0as
function of the pump power refers to a progressive compensation of the linear losses until the amplification regime.
±𝜎
𝑃
𝑡ℎ
10
20
30
40
50
60
70
1.6
1.8
2.0
2.2
g
B[
m/W]
Pump Power [mW]
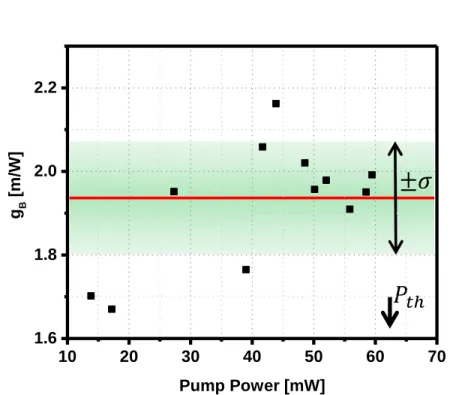
Fig. 3. Brillouin gain coefficient extracted from the CRDM signal for various input pump power. The mean value is equal to gB= 1.94 × 10⁻¹¹± 1.5 × 10⁻¹²m/W. This measure of gBvalue is compared to other works in Tab. 2
From those fitted datas, we are able to retrieve a2(Eq. (5)) and then the value of the Brillouin gain gBby use of Eq. (6). This procedure is applied for each pump power giving estimations of
the Brillouin gain parameter. Figure 3 summarized the extracted gain values as function of the pump power. The mean value (red dashed line) is equal to 1.94 × 10⁻¹¹m/W with a standard deviation (shaded green region) of ±1.5 · 10−12m/W. The uncertainty contribution to gBrelated
to Aeff, LBand Pcavgives 0.6 × 10⁻¹²m/W and does not increase the experimentally determined
standard deviation of gB. We can then conclude that the Brillouin gain standard deviation is
related to the experimental extraction of τ0.
To evaluate the pertinence of the method, we compare our CRDM technique to usual self-heterodyne method [12]. The Brillouin gain bandwidth is experimentally estimated to ∆νB=
27.5 ± 2 MHz. Then, using Eq. (1), gain coefficient can be determined. As mentioned before, this determination depends on material parameters of the used fiber. Fabrication process conditions (doping, temperature, etc.) affect those parameters. For example, a commercial single mode fiber in the C band region has usually a GeO2-doping concentration of few percents but this
value is often not known precisely. We report in table 1 material values for pure silica and 3%-doped GeO2silica fiber. Using those parameters, Brillouin gain estimation gives 2.45 and
1.92×10⁻¹¹m/W (see Table 2) respectively. The standard deviation, related to ∆ν
Bdetermination,
is bounded between ±1.4 × 10⁻¹²m/W< σ < 1.8 × 10⁻¹²m/W. Our g
Bdetermination is very
close from the one obtained by self-heterodyne using the parameters of a commercial monomode fiber 3%-doped with GeO2. Upon this example, we see that the material parameters strongly
impact the estimation of the Brillouin gain. Comparison to other works on similar silica fibers (see Tab. 2) give comparable gBvalues.
5. Conclusion
A cavity ringdown method is applied to stimulated Brillouin scattering in fiber cavity. Contrary to usual techniques, this new method gives access, through a simple and single measurement, as well to the Brillouin gain coefficient of the fiber material as to the cavity parameters. We have shown that the fast sweeping ringdown technique allows Brillouin gain to be characterized. The proof of concept has been experimentally demonstrated with a silica fiber ring resonator. This allowed us to determine unambiguously the coupling regime and to estimate the Brillouin gain coefficient of the material composing the resonator without the needs of material constants knowledge. The comparison to usual pump-probe techniques gives good agreements.
This cavity ringdown method can be applied to any kind of resonators allowing for example, the determination of Brillouin gain coefficient in microresonators, exotic material fiber rings and whispering gallery mode resonators.
The present work is supported under project FUI AAP20 SOLBO, with the help of BPI FRANCE and Pôle Images & Réseaux. We thank also UBL for its financial support.
The authors would like to thank P. Féron and Y. Dumeige for fruitfull discussions and for their careful reading of the manuscript.
References
1. Y. Jiang, A. Ludlow, N. D. Lemke, R. W. Fox, J. A. Sherman, L.-S. Ma, and C. W. Oates, “Making optical atomic clocks more stable with 10- 16-level laser stabilization,” Nat. Photonics 5, 158 (2011).
2. K. Predehl, G. Grosche, S. Raupach, S. Droste, O. Terra, J. Alnis, T. Legero, T. Hänsch, T. Udem, R. Holzwarth et al., “A 920-kilometer optical fiber link for frequency metrology at the 19th decimal place,” Science 336, 441–444 (2012). 3. J. Geng, C. Spiegelberg, and S. Jiang, “Narrow linewidth fiber laser for 100-km optical frequency domain reflectometry,”
IEEE Photonics Technol. Lett. 17, 1827–1829 (2005).
4. P. J. Rodrigo and C. Pedersen, “Reduction of phase-induced intensity noise in a fiber-based coherent doppler lidar using polarization control,” Opt. Express 18, 5320–5327 (2010).
5. E. Ippen and R. Stolen, “Stimulated Brillouin scattering in optical fibers,” Appl. Phys. Lett. 21, 539–541 (1972). 6. S. Smith, F. Zarinetchi, and S. Ezekiel, “Narrow-linewidth stimulated Brillouin fiber laser and applications,” Opt.
letters 16, 393–395 (1991).
7. W. Loh, J. Becker, D. C. Cole, A. Coillet, F. N. Baynes, S. B. Papp, and S. A. Diddams, “A microrod-resonator Brillouin laser with 240 Hz absolute linewidth,” New J. Phys. 18, 045001 (2016).
8. M.-G. Suh, Q.-F. Yang, and K. J. Vahala, “Phonon-Limited-Linewidth of Brillouin Lasers at Cryogenic Temperatures,” Phys. review letters 119, 143901 (2017).
9. A. Sebastian, I. V. Balakireva, S. Fresnel, S. Trebaol, and P. Besnard, “Relative intensity noise in a multi-stokes brillouin laser,” Opt. Express 26, 33700–33711 (2018).
10. G. P. Agrawal, “Nonlinear fiber optics,” in Nonlinear Science at the Dawn of the 21st Century, (Springer, 2000), pp. 195–211.
11. N. Shibata, R. G. Waarts, and R. P. Braun, “Brillouin-gain spectra for single-mode fibers having pure-silica, geo 2-doped, and p 2 o 5-doped cores,” Opt. letters 12, 269–271 (1987).
12. R. Tkach, A. Chraplyvy, and R. Derosier, “Spontaneous brillouin scattering for single-mode optical-fibre characteri-sation,” Electron. Lett. 22, 1011–1013 (1986).
13. D. Cotter, “Observation of stimulated brillouin scattering in low-loss silica fibre at 1.3 µm,” Electron. Lett. 18, 495–496 (1982).
14. K. S. Abedin, “Observation of strong stimulated brillouin scattering in single-mode as 2 se 3 chalcogenide fiber,” Opt. Express 13, 10266–10271 (2005).
15. Y. Dumeige, S. Trebaol, L. Ghişa, T. K. N. Nguyen, H. Tavernier, and P. Féron, “Determination of coupling regime of high-Q resonators and optical gain of highly selective amplifiers,” JOSA B 25, 2073–2080 (2008).
16. G. N. Conti, S. Berneschi, F. Cosi, S. Pelli, S. Soria, G. C. Righini, M. Dispenza, and A. Secchi, “Planar coupling to high-q lithium niobate disk resonators,” Opt. Express 19, 3651–3656 (2011).
17. R. Henriet, G. Lin, A. Coillet, M. Jacquot, L. Furfaro, L. Larger, and Y. K. Chembo, “Kerr optical frequency comb generation in strontium fluoride whispering-gallery mode resonators with billion quality factor,” Opt. letters 40, 1567–1570 (2015).
18. A. Rasoloniaina, V. Huet, T. K. N. Nguyen, E. Le Cren, M. Mortier, L. Michely, Y. Dumeige, and P. Féron, “Controling the coupling properties of active ultrahigh-q wgm microcavities from undercoupling to selective amplification,” Sci. Reports 4, 4023 (2014).
19. S. Trebaol, Y. Dumeige, and P. Féron, “Ringing phenomenon in coupled cavities: Application to modal coupling in whispering-gallery-mode resonators,” Phys. Rev. A 81, 43828 (2010).
20. A. A. Savchenkov, A. B. Matsko, M. Mohageg, and L. Maleki, “Ringdown spectroscopy of stimulated raman scattering in a whispering gallery mode resonator,” Opt. Lett. 32, 497–499 (2007).
21. A. Rasoloniaina, V. Huet, M. Thual, S. Balac, P. Féron, and Y. Dumeige, “Analysis of third-order nonlinearity effects in very high-q wgm resonator cavity ringdown spectroscopy,” JOSA B 32, 370–378 (2015).
22. H. A. Haus, Waves and fields in optoelectronics (Prentice-Hall, 1984).
23. A. Yariv, “Universal relations for coupling of optical power betweenmicroresonators and dielectric waveguides,” Electron. Lett. 36, 321–322 (2000).
24. “Corning smf-28 ultra optical fiber,” https://www.corning.com/media/worldwide/coc/ documents/Fiber/SMF-28%20Ultra.pdf, note = Accessed 24 May 2019.
25. P. D. Dragic, “Brillouin gain reduction via b _{2} o _{3} doping,” J. Light. Technol. 29, 967–973 (2011). 26. N. Lagakos, J. A. Bucaro, and R. Hughes, “Acoustic sensitivity predictions of single-mode optical fibers using
![Table 2. Comparison of g B values obtained for single mode silica fiber [24] in various works](https://thumb-eu.123doks.com/thumbv2/123doknet/11651317.308540/6.918.270.646.579.742/table-comparison-values-obtained-single-silica-fiber-various.webp)