HAL Id: hal-00968897
https://hal.sorbonne-universite.fr/hal-00968897v2
Submitted on 18 Aug 2014
HAL is a multi-disciplinary open access
archive for the deposit and dissemination of
sci-entific research documents, whether they are
pub-lished or not. The documents may come from
teaching and research institutions in France or
abroad, or from public or private research centers.
L’archive ouverte pluridisciplinaire HAL, est
destinée au dépôt et à la diffusion de documents
scientifiques de niveau recherche, publiés ou non,
émanant des établissements d’enseignement et de
recherche français ou étrangers, des laboratoires
publics ou privés.
The electric double layer has a life of its own
Céline Merlet, David Limmer, Mathieu Salanne, René van Roij, Paul A
Madden, David Chandler, Benjamin Rotenberg
To cite this version:
Céline Merlet, David Limmer, Mathieu Salanne, René van Roij, Paul A Madden, et al.. The electric
double layer has a life of its own. Journal of Physical Chemistry C, American Chemical Society, 2014,
118 (32), pp.18291. �10.1021/jp503224w�. �hal-00968897v2�
The Electric Double Layer Has a Life of Its Own
C´eline Merlet1,2,3, David Limmer4, Mathieu Salanne1,2, Ren´e van Roij5,Paul A. Madden6, David Chandler7, and Benjamin Rotenberg1,2,∗
1 Sorbonne Universit´es, UPMC Univ. Paris 06,
CNRS, UMR 8234 PHENIX, 75005 Paris, France
2 R´eseau sur le Stockage Electrochimique de l’Energie (RS2E), FR CNRS 3459, France 3 Department of Chemistry, University of Cambridge, Cambridge CB2 1EW, UK
4 Princeton Center for Theoretical Science, Princeton, NJ-08544, USA
5 Institute for Theoretical Physics, Utrecht University, 3584 CE Utrecht, The Netherlands 6 Department of Materials, University of Oxford, Oxford OX1 3PH, UK 7 Department of Chemistry, University of California, Berkeley, CA-94720, USA and
∗ Corresponding author: [email protected]
(Dated: August 18, 2014)
Using molecular dynamics simulations with recently developed importance sampling methods, we show that the differential capacitance of a model ionic liquid based double-layer capacitor exhibits an anomalous dependence on the applied electrical potential. Such behavior is qualitatively incompatible with standard mean-field theories of the electrical double layer, but is consistent with observations made in experiment. The anomalous response results from structural changes induced in the interfacial region of the ionic liquid as it develops a charge density to screen the charge induced on the electrode surface. These structural changes are strongly influenced by the out-of-plane layering of the electrolyte and are multifaceted, including an abrupt local ordering of the ions adsorbed in the plane of the electrode surface, reorientation of molecular ions, and the spontaneous exchange of ions between different layers of the electrolyte close to the electrode surface. The local ordering exhibits signatures of a first-order phase transition, which would indicate a singular charge-density transition in a macroscopic limit.
Keywords: Molecular modelling, capacitance, ionic liquids, ordering, structural transition, impor-tance sampling methods
I. INTRODUCTION
The electric double layer is generally viewed as simply the boundary that interpolates between an electrolyte solution and a metal surface. In contrast, we show here that the interface between an electrode and a model ionic liquid exhibits behaviors distinct from that of the bulk liquid. At a particular voltage, the double layer under-goes an abrupt local ordering transition. The emergent ordered structure is consistent with that of room temper-ature ionic liquids found on mica surfaces1. At another
voltage, the interfacial charge density changes abruptly. This change appears to be consistent with observations of anomalous electrical capacitance observed experimen-tally2. Further, we show that this anomaly grows with
increasing electrode surface area, suggesting a singular charge-density transition in a macroscopic limit. These nonlinear electrochemical responses, whose molecular ori-gins we elucidate, offer a view of the electric double layer that deviates significantly from standard mean-field mod-els.
Generally, when an electrical potential is applied to an electrode in contact with an electrolyte it induces a local, partial demixing of the cations and anions at the interface. The surface charge is equal and opposite to the net charge in the double layer and thus at a given potential reflects the facility of the interfacial fluid to adopt a structure giving rise to that charge. The canon-ical model for the interfacial region of an electrolyte at
an electrode surface, the electric double layer, is that of Gouy and Chapman (GC)3. This mean-field model
ap-plies to a dilute solution of point ions and predicts that the degree of demixing induced by the voltage decreases exponentially with distance from a planar electrode sur-face and that the differential capacitance of the electrode-electrolyte double-layer increases monotonically with the magnitude of the applied electrode potential. Recently, there has been a great deal of interest in electrochemi-cal interfaces of room temperature ionic liquids (RTILs) driven in part by the potential for constructing superca-pacitors that exploit this charge separation to create high power energy storage devices4. Far from a collection of
noninteracting point charges RTILs are dense mixtures of ions, whose physical properties are largely determined by correlations between ions.
Effects arising from correlations within RTILs at elec-trochemical interfaces have been observed experimentally and in simulation5,6. Specifically, layering has been
ob-served in X-ray reflectivity experiments7,8, is detected in
surface force and AFM experiments9–12and has been
ex-amined in a number of computer simulation studies13–17.
Some of the latter have illustrated how the polarization of the charge density in an ionic liquid in response to an electrode potential is affected by this layering and the strong local coulomb ordering of the ions13,18.
In-plane ordering of the ions in RTIL has been detected at the liquid-vapor interface by X-ray scattering19, on mica
Some simulations21–24 have reproduced this effect and
indicated a connection to changes in the electrode charge density. Using in-situ STM and AFM measurements, Atkin, Endres and co-workers underlined the influence of phenomena such as surface reconstruction (e.g. with gold electrodes) and of impurities on the interfacial struc-ture25,26 and demonstrated the advantage of combining
these techniques with electrochemical impedance spec-troscopy to investigate these aspects27.
Not surprisingly then, the experimentally observed de-pendence of the differential capacitance on potential has often been found to depart markedly from the predic-tions of GC theory, often decaying with increasing po-tential and exhibiting sharp peaks that are interpreted as abrupt changes in the local ionic structuring. Efforts to extend GC theory to include effects from packing of ions have been made at the mean-field level with some success6. These account approximately for layering at
the interface28 and the tendency for local coulombic
or-dering of the ions at high voltage29–31. Specifically,
Ko-rnyshev and coworkers have demonstrated the effect of these extensions on the differential capacitance, qualita-tively reproducing some features observed in RTILs28,30.
However, correlations in-plane and effects from fluctua-tions have not been considered, omitting molecular detail and its role in determining the electrochemical properties of these systems. Such features are however essential in conditions where the liquid undergoes large structural re-organization, which as we discuss below, are intimately connected to non-monotonic features of the differential capacitance.
Here we address the correspondence between structure, fluctuations and electrochemical response in RTILs di-rectly by applying novel simulation methods. Such meth-ods are robust and free of assumptions related to the relative importance of correlations that constrain mean-field models. In section II we first describe the considered system and present the theoretical approach to determine the evolution of observables, such as the differential ca-pacitance or structural properties, with applied voltage. Section III then reports the main results of this study.
II. METHODS
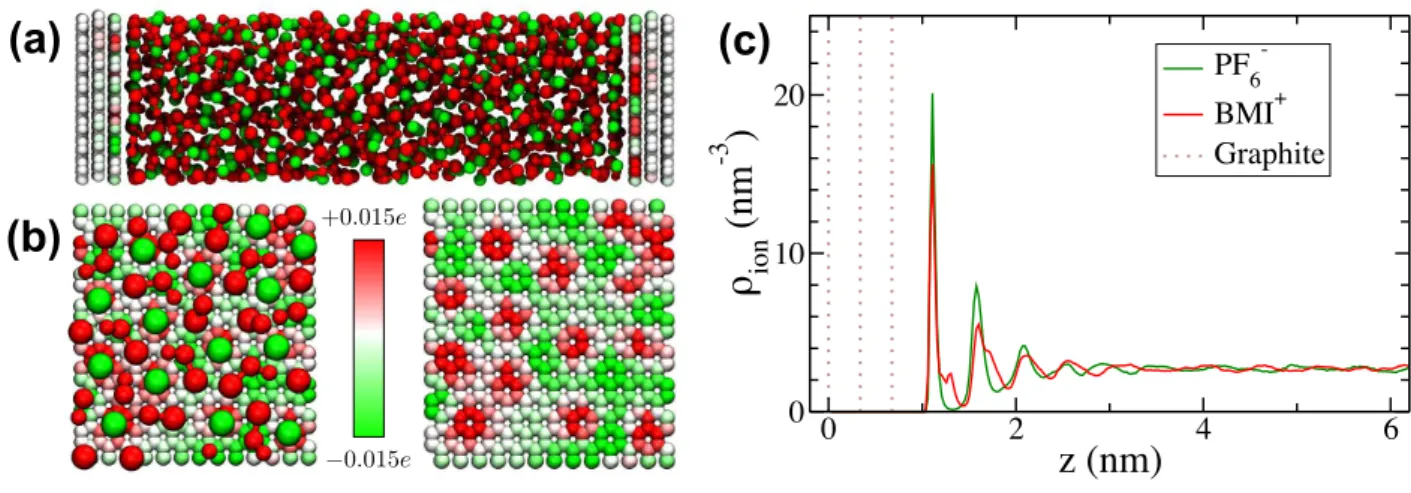
Microscopic ModelsThe specific system we consider is a molecular simulation model of liquid butylmethylim-idazolium hexafluorophosphate (BMI-PF6) bounded by
constant voltage graphite electrodes. BMI-PF6is an
ex-ample of a room temperature ionic liquid (RTIL) and has been studied previously32–34 . Figure 1(a) shows a
characteristic snapshot of the model electrochemical cell and Fig. 1(b) shows a characteristic snapshot of the po-sitions of the ions close to the electrode surface with the corresponding induced charges on the electrode surface, which fluctuate as a result of the constant potential con-straint. The force field we use to simulate the graphite electrode and the ionic liquid are the same coarse-grained
potentials as used in previous works32–36. Similarly, the
electrochemical cell is modeled as in previous works32–34
with each electrode consisting of three fixed graphene layers and subject to two-dimensional periodic boundary conditions37,38. The molecular level detail provided by
these simulations is evident in Fig. 1(c), where explicit layering within the fluid away from the electrode arises as a consequence of the discrete nature of the material39.
Importance Sampling In a recent paper, we have introduced a framework to analyze molecular simulation data from constant-electrode potential simulations41. We
exploit the method of histogram re-weighting42, which
allows us to study the induced electrode charge as a con-tinuous function of the applied potential, rather than by studying it in a series of simulations carried out at discrete values. The re-weighting method also enables us to obtain much better statistical precision than in the previous simulation studies through the utilization of data from multiple simulations. Such techniques are especially necessary when studying collective behavior, as timescales for reorganization make straightforward sim-ulation methods prohibitive.
To generate configurations for this histogram re-weighing technique, molecular dynamics simulations were conducted in the NVE ensemble with a time step of 2 fs. For each simulation, a 200 ps equilibration at T = 400 K is followed by a 10 ns production run from which configurations are sampled every 0.2 ps and the corresponding total charge Qtot= σ × S of the electrodes
(with σ the surface charge density and S the surface area) is used to determine the weight of this configuration in the ensemble at an arbitrary potential using the weighted histogram analysis method (WHAM)42. Application of
WHAM allows us to access statistics that would be un-obtainable directly from molecular simulation41 and to
sample the probability distributions of key variables as continuous functions of the applied potential. Simula-tions were performed for ten potential values (∆Ψ = 0.0, 0.2, 0.5, 0.75, 1.0, 1.25, 1.5, 1.75, 1.85 and 2.0 V) in order to ensure a good overlap between the histograms for Qtot,
as required for the histogram re-weighting. The distribu-tion of any property A is determined as a funcdistribu-tion of the applied potential from the joint distribution of Qtot and
A as
P (A|∆Ψ) = Z
dQtot P (Qtot, A|∆Ψ) . (1)
Specifically, we consider below as observables A: the sur-face charge density of the total electrode and that of subsamples of the electrodes, the numbers of anions and cations in the first fluid layers adsorbed on both elec-trodes, the in-plane structure factors in these layers and the orientation of cations in these layers.
0 2 4 6
z (nm)
0 10 20ρ
ion(nm
-3)
PF 6 -BMI+ Graphite(a)
(b)
(c)
−0.015e +0.015eFIG. 1: Simulated capacitor. (a) The capacitor consists of liquid butylmethylimidazolium (red) hexafluorophosphate (green) and graphite electrodes (white). The electrode geometry and force field are detailed in Ref.32. The force field employs the
ion-ion interactions from Roy and Maroncelli36, and a constant voltage, ∆Ψ, is maintained throughout a molecular dynamics
trajectory by adapting the algorithm of Siepmann and Sprik40. (b) Polarization of electrode is illustrated with a configuration
of the double layer (left), with molecules drawn smaller than space filling, and the underlying graphite electrode, with colors indicative of the instantaneous charge on the carbon atoms. During constant-potential simulations, the charge on carbon atoms fluctuates in response to the thermal motion of the adsorbed liquid. (c) The cation and anion density profiles perpendicular to the electrode surface at ∆Ψ=0V. For the cation the density is plotted for the center of mass.
III. RESULTS
Electrode charge distributions and capacitance The probability distribution P (σ|∆Ψ) of electrode sur-face charge density σ at various electrode potentials ∆Ψ is represented by a contour plot in Fig. 2a. The fig-ure shows the free energy landscape for the system as a function of surface charge density σ and potential ∆Ψ, in units of Boltzmann’s constant, kB, times
tem-perature, T . It is clear that there are three free en-ergy minima, at ∆Ψ ∼ 0.6V, 1.2V, and 1.8V, within the voltage range studied, which correspond to partic-ularly favorable configurations for the interfacial fluid to balance the corresponding surface charge densities of ∼ 1.0, 2.6, 4.1 µC/cm2. The minima are separated by
saddle points, at 0.9V, for example. A given voltage cor-responds to a vertical slice through the free energy sur-face and Fig. 2b shows sections for three voltages in the 0.8-1.0 V range.
The mean-square fluctuations in the electrode surface charge density determine the differential capacitance C (per unit area) as43,44,
C ≡ ∂hσi ∂∆Ψ =
S kBT
h(δσ)2i. (2)
where δσ = σ − hσi, and the angle brackets denote equi-librium average with fixed voltage ∆Ψ. Note that this relation between the response to voltage and the equi-librium fluctuations of the surface charge is not limited to the typical linear response approximation, as both the charge fluctuations and therefore the capacitance are generally potential dependent41. As seen in Fig. 3(a),
(b)
(a)
FIG. 2: Surface charge density distribution. (a) The probability distribution of the charge density σ on the elec-trodes is a function of the applied potential ∆Ψ. The two-dimensional graph of the distribution employs a logarithmic scale with lines separated by a difference of 0.5 kBT
distribu-tion is graphed as a funcdistribu-tion of σ in (b). Note the fat tails in the distribution, P (σ), and note the markedly non-linear shifts with changing voltage.
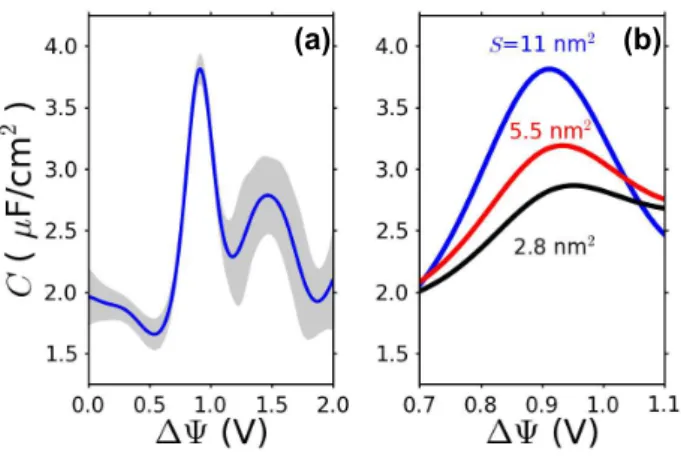
the capacitance exhibits two anomalous peaks, one near ∆Ψ = 0.9 V, the other near ∆Ψ = 1.5 V. Locating these critical voltages on the free energy surface (Fig. 2(a) shows that they correspond to the location of saddle points, where fluctuations sample two adjacent free en-ergy minima. Similar features in the differential capaci-tance have been reported in numerous experimental stud-ies27,45–49.
(a) (b)
FIG. 3: Capacitance. (a) Differential capacitance, C, com-puted from molecular simulation as a function of the applied potential ∆Ψ with an electrode surface area S = 11 nm2.
Shaded regions indicate the range of statistical uncertainty. (b) Growth of computed capacitance peak with growth of electrode surface area.
The peaks in capacitance arise from correlations within the interfacial layer of fluid. This is evident from the electrode surface charge distributions that exhibit non-Gaussian features characteristic of a first-order phase transition – fat tails at conditions away from phase coex-istence and a very flat distribution suggesting incipient bi-modality (limited here by a rather small system size) at conditions of coexistence50,51. If the relevant
struc-tures in the fluid comprise correlated domains that are small compared to the net surface area, the distribution will be Gaussian because the net surface-charge density will reflect many uncorrelated contributions (the usual Central Limit Theorem argument). Generally, the distri-bution, P (σ), shifts according to applied voltage,
P (σ|∆Ψ) ∝ P (σ|0) exp(− σ S ∆Ψ/kBT ) . (3)
In the Gaussian case, vertical sections through the free energy surface, −kBT ln P (σ), will be parabolas with
minima at the mean value of σ, and the application of voltage will produce a proportional shift of that mean -the free energy surface would have -the form of a regu-lar valley with the position of the minimum tracking the voltage smoothly. This is what has been found previ-ously for simple dielectrics or dilute solutions41. If the
correlated domains extend across the entire surface, the distribution will be non-Gaussian, and the application of voltage will shift the free energy minimum in a markedly non-linear way as different domain types are stabilized by different voltages. It is clear that the surface-charge distributions found in the simulations correspond most closely to the latter scenario and that, although the non-Gaussian characteristics are a global property of the free energy surface, they will be most pronounced at poten-tials close to 0.9V.
The size of our system is small, so that the non-Gaussian features are relatively subtle. Nevertheless, the system is large enough to exhibit size dependence of re-sponse. In particular, Fig. 3(b) illustrates the growth of the first ∼ 0.9V of the anomalous peaks in the dif-ferential capacitance as the observed electrode surface area is increased. In the absence of a phase transition, the capacitance C is an intensive property, i.e., h(δσ)2i
scales inversely with S. At conditions of a coexistence be-tween two phases, however, C will grow with system size because cooperativeness at a phase transition extends across the surface. The growth is significant. Ultimately, the capacitance at this voltage should increase linearly with S, but the system sizes we have been able to study are not yet large enough to reach that scaling regime. The fluctuations we consider might thus foreshadow an unbounded capacitance, a phenomenon that it not pre-dicted by previous theories even beyond mean-field31.
While studying larger system sizes in detail is not pos-sible with the computer resources currently available to us, we can nevertheless test the consequences of a pu-tative first order transition. For larger systems, one should expect a bimodal distribution of surface charge density with basins of the charge distribution separated by a free energy barrier growing with system size. We have performed simulations with a system size increased by 100% in the x and y directions for voltages close to the estimated coexistence voltage of 0.9V. For these large systems, both the ordered and disordered states are metastable over time scales of 500 ps, and the corre-sponding charge distributions do not overlap. This be-havior is consistent with the expected one for a first order transition. It raises the usual issue for studying phase transitions in molecular simulations: proper sampling requiring long simulation times and enhanced sampling techniques. Such an investigation could benefit from the development of simplified models and analytical theory capable of capturing the physical phenomena which un-derpin these effects. With these caveats in mind, note that such a transition would also lead to hysteresis in a macroscopic system, and that hysteresis has been ob-served experimentally for a very similar ionic liquid on graphene using X-ray reflectivity8.
The charge density σ is the same on both electrodes (up to a sign change). Its average value and its variance (hence the capacitance, see Eq. 2) reflect the response of the whole capacitor. In order to provide a microscopic interpretation for the observations described above, we have examined several order parameters based upon av-erages over the ionic positions at each electrode. Given the difference in shape and size between cations and an-ions, the microscopic structure of the interface is likely to differ at positive and negatively charged electrodes. In the following, results are reported as a function of the variable Ψ defined as +∆Ψ/2 (resp. −∆Ψ/2) for the positive (resp. negative) electrode when the capacitor is submitted to a voltage ∆Ψ. Since in the present system the point of zero charge is close to 0 V, with comparable
capacitances for both interfaces32, Ψ approximately
re-flects the actual potential drop across each double layer. Out-of-plane layering Figure 1(c) illustrates the density profiles for anions and cations at zero applied potential. Examples of the density profiles at higher po-tentials for this system have been shown elsewhere 52
and layering similar to that indicated in the figure per-sists over the full range of potentials studied here. Al-though the layering is a generic property of dense fluids, the arrangement of the ions within the layers depends on the details of the interionic interactions. In the present case, at 0V, the maxima in the principal peaks of the an-ion and catan-ion densities coincide, which shows that both ions have roughly the same size and may approach the surface equally closely (the small shoulder appearing on the cation peaks arises from different possible orienta-tions of the caorienta-tions on the surface). If the ions were of very different size, the cation and anion layers could be displaced from each other, as seen e.g. in Ref.53.
Fur-thermore, from the areas of corresponding cation and an-ion peaks for the first two layers it follows that a given layer contains a very similar number of cations and an-ions (a feature we explore in detail below). This will be favored (at low electrode surface charge, and in the ab-sence of strong attractive interactions of one species with the surface) by the coulombic interactions between the ions which will try to impose local charge neutrality.
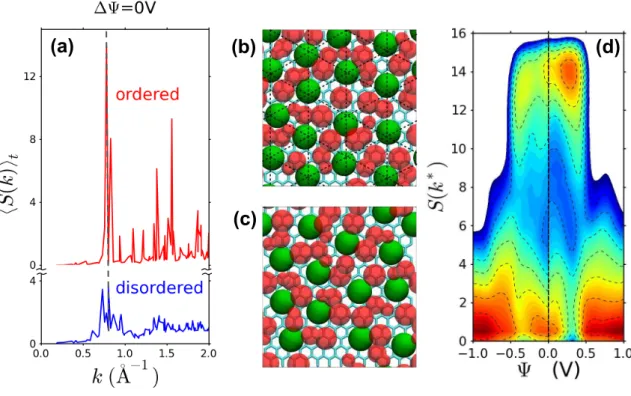
In-plane order The in-plane anion structure factor for the anions in the first adsorbed layer on a given elec-trode is S(k) = 1 N− X i,j eik·rij , (4)
where the sum runs over pairs of anions that are found in the first layer of fluid adjacent to the electrode sur-face and k is a wavevector which lies in the plane of the electrode and is commensurate with the periodic bound-ary conditions. These wavevectors form a discrete lattice and in Fig. 4a we have plotted the average value hSi as a function of |k| for two states visited along a the trajec-tory at ∆Ψ = 0V. At a given voltage, the interface may explore configurations with varying degrees of in-plane order. The bottom part corresponds to a fluid-like con-figuration, whereas the top one shows a strong, Bragg-like peak at k∗ ≃ 0.8 ˚A−1, which corresponds to 2π divided
by the mean nearest-neighbor separation of the anions in the first layer, and strongly suggests a 2-d lattice-like organization for the anions.
Figures 4b and 4c show snapshots which illustrate such ordered and disordered structures, respectively. The rela-tive contribution of these structures to an averaged prop-erty of the interfacial fluid, like the in-plane structure factor, depends on the voltage, as we shall see below. In particular, the lattice-like ordering only persists for a certain range of applied potentials.
The length scales of the underlying graphite play no role in this ordered structure. Indeed, structures like it are inferred from experiments of monolayers of BMI-PF6
on gold20. This is not to say that other systems cannot
show an effect of commensurability between in-plane or-der in the electrolyte and the surface23,54. But the role
of graphite in the system studied here is only that of a polarizable metal. Note also that the geometry of the tri-angular lattice is distinct from that of the (nearly) square electrode that is periodically replicated in the simulation. Thus, the ordered state we find in the simulation is not a finite-size artifact of the simulation geometry.
In Fig. 4d we show a contour plot of the probabil-ity distribution of values of S(k∗) as a function of
ap-plied potential. This is again plotted as -kBT ln P so
that the surface can be interpreted as a free energy land-scape in the structural order parameter S(k∗). This plot
reveals a substantial basin of stability for the ordered state of the first interfacial layer of fluid for potential differences ∆Ψ between about 0.5 and 0.75V (remember that Ψ = ±∆Ψ/2). This basin is present on both elec-trodes, even though the ordered state is less probable on the negative electrode. At both higher and lower volt-ages the fluid layer is translationally disordered. This observation strongly suggests that the peak in the differ-ential capacitance observed as the potdiffer-ential is increased through 0.9V is associated with the transition between an ordered, lattice-like state of the first layer and the disordered state. The first-order nature of this phase transition, which is evident from free energy surface in S(k∗), shows up in the statistics of the electrode
surface-charge fluctuations and the resulting peak in the differ-ential capacitance. However, the transition from the low potential, disordered state to the ordered state, which might be expected at about ∆Ψ = 0.35V, does not ap-pear to affect the surface charge significantly. Although a transition in first-layer structure is seen in S(k), it does not appear to be strongly coupled to the surface charge. In the present case, the transitions on both electrodes occur approximately at the same voltage ∆Ψ. For sys-tems where the difference in size and shape between cations and anions is stronger, or where the fine structure of the electrode plays a more important role, such transi-tions may occur for different voltages on each electrode. For example, previous work on electrochemical cells in-volving a molten salt, LiCl, and (100) aluminum elec-trodes, an order-disorder transition occurred in the first adsorbed layer close to the potential of zero charge23. For
positive surface charges, an ordered structure, commen-surate to the underlying metal structure was stabilized while the structure was liquid-like otherwise. As a result, a large step was observed on the charge vs. potential plot, which should be in principle associated to a large peak in the differential capacitance. Such a peak could not be evidenced since the importance sampling tools discussed here had not been introduced at that time. The asym-metric behavior could be attributed in that case to the large difference in polarizability between the lithium and chloride ions. As soon as the polarization effects (on the ions) were turned off, the ordered structure was unable to form, leading to an almost constant differential
capac-(a)
(b)
(d)
(c)
FIG. 4: In-plane structure of the adsorbed layer (a) Average anion-anion structure factor hS(k)i in the first adsorbed layer on the electrodes, as a function of the norm of the wave vector, for a voltage ∆Ψ = 0V. Structure factors for ordered and disordered states, which are both observed at this particular voltage, are averaged over 1 ns. (b) Configuration illustrating the adsorbed layer in the ordered state. (c) Configuration of a disordered state. (d) Probability distribution of the anion-anion structure factor at the maximum S(k∗) in the first adsorbed layer on the electrodes, as a function of Ψ, defined as +∆Ψ/2
(resp. −∆Ψ/2) for the positive (resp. negative) electrode when the capacitor is submitted to a voltage ∆Ψ. The probability is reported on a logarithmic scale, with lines separated by a difference of 0.5. Note the presence, on both electrodes, of three distinct basins, indicative of i. a low-voltage phase where the double layer is disordered, ii. an intermediate-voltage phase where the double layer is ordered, and iii. a high-voltage disordered phase where the double layer is charge unbalanced.
itance over the whole simulated potential range23.
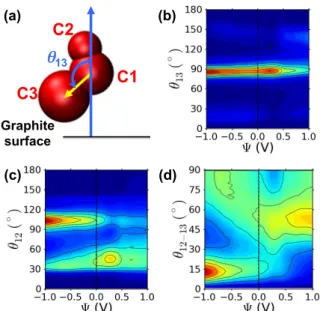
Cation orientation and stoichiometry of the lay-ersThe orientation of cations in the first ionic layer on the electrode evolves with the applied potential ∆Ψ. This can be measured using angles such as the one between the imidazolium ring-butyl (C1-C3) axis and the normal to the surface, illustrated in Fig. 5(a). The distributions of these angles as a function of Ψ are reported in Figs. 5(b), 5(c) and 5(d). On both electrodes, the C1-C3 axis re-mains almost parallel to the surface for all voltages. On the contrary, the distribution of the ring-methyl (C1-C2) orientation displays bimodality, with relative weights of the two configurations that evolve with the applied voltage. The cation may either lie flat on the surface (θ12 ∼ 90◦) or tilt with the methyl group pointing
out-ward (θ12 ∼ 30◦) while the imidazolium ring and butyl
group remain on the surface (θ13 ∼ 90◦). At 0 V, both
orientations have similar probabilities. With increasing voltage, the fraction of tilted cations increases on the pos-itive electrode and decreases on the negative one. This behavior is consistent with the electrostatic interaction between the positive partial charge of the methyl group
and the electrodes. The fact that the bulkier butyl and imidazolium ring remain closer to the surface may be due to packing effects, their smaller charge density com-pared to the methyl group and to the stronger attractive dispersion interaction with the wall, in agreement with observations for a model cation consisting of a charged head and a neutral tail55.
The value of the electrode surface charge at a given potential reflects the spatial distribution of the induced charge density in the interfacial layer of electrolyte. In order to relate this to the structural changes in the fluid, we have plotted in Fig. 6 the probability distributions for finding a given number of anions (N−) and cations (N+) in the first and second layers of fluid. This is
plotted as −kBT ln P (N ) so that it can be interpreted
as a free-energy landscape. The most striking features of these plots are the pronounced changes in the most probable number of anions in the first layer at both an-ode and cathan-ode that occur as the voltage is increased. The preferred numbers of both species in the second layer remains roughly constant, at least until the overall cell voltage (∆Ψ) exceeds 1.3V - corresponding to Ψ ∼ 0.65V.
C1
C2
C3
θ
13 Graphite surface (a) (c) (b) (d)FIG. 5: Orientation of cations on the electrodes. (a) Definition of the angle θ13between the imidazolium-butyl axis
and the normal to the graphite surface (into the fluid). The space-filling representation of the cation illustrates the three sites defined in the force field to model the imidazolium ring (C1) as well as the butyl (C3) and methyl (C2) side chains. The θ12angle is defined similarly, while the θ12−13angle
cor-responds to the angle with the normal to the molecular plane. (b) Probability distribution of the angle θ13as a function of
Ψ, defined as +∆Ψ/2 (resp. −∆Ψ/2) for the positive (resp. negative) electrode when the capacitor is submitted to a volt-age ∆Ψ. The probability is reported on a logarithmic scale, with lines separated by a difference of 0.5. (c) and (d) Same as (b) for the angle θ12and θ12−13.
The preferred cation number in the first layer remains constant until ∆Ψ reaches 1.0V and there is initially, close to zero volts, an apparent charge imbalance in the first layer because the number of cations exceeds that of anions.
When the voltage ∆Ψ exceeds about 0.35V the num-ber of anions at both electrodes increases so that it bal-ances the number of cations. This occurs because cations become increasingly orientationally ordered by larger ap-plied potentials and this allows enough space for the ad-ditional anions to enter the first layer. As the ions be-come tightly packed in the first layer, the structure fac-tor develops its Bragg-like peak (Fig. 4) showing that the lattice-like arrangement is associated with the ideal stoichiometry. Note that the capacitance (Fig. 3) is a decreasing function of potential between zero and about 0.6V, suggesting that the interfacial fluid becomes in-creasingly resistant to charging over this range. At Ψ about 0.5V, there is a sharp increase, over a narrow volt-age window, in the number of anions at the positive elec-trode, which is partially compensated by a smaller de-crease in the number of cations. At the cathode, there is a more extended transition at about Ψ ∼ −0.5V which
(a)
(b)
(d)
(c)
FIG. 6: Number of ions in the adsorbed layers Prob-ability distribution of the number of anions NAnions = N−
(a,c) and cations NCations = N+ (b,d) in the first (a,b) and
second (c,d) fluid layers on both electrodes, as a function of Ψ, defined as +∆Ψ/2 (resp. −∆Ψ/2) for the positive (resp. negative) electrode when the capacitor is submitted to a volt-age ∆Ψ. The distribution is reported on a logarithmic scale, with lines separated by a difference of 0.5.
results in still larger changes in the numbers of both an-ions and catan-ions. These rapid increases in the magnitude of the interfacial charge close to the electrode surface are responsible for the peak in the capacitance close to an overall cell voltage drop of ∆Ψ =0.9V.
From Figs. 4 and 6 it is clear that the nature of the structural transitions in the first layer that are re-sponsible for the capacitance peak at 0.9V are collective transitions between stoichiometric (N+ = N−),
lattice-like ordered states and non-stoichiometric, or partially demixed, disordered states with the latter persisting to higher potentials. A possible interpretation is that the increasing magnitude of the potential drives the like-charged ions out of the first-layer and causes the melting to the non-stoichiometric disordered phase. Notice that the capacitance peak is associated with the transition out of the ordered state, rather than the existence of the or-dered state itself: from the free energy landscape in Fig. 4 it is clear that the lattice structure is most stable for a voltage ∆Ψ of about 0.6-0.75V, substantially lower than that at which the capacitance peak is observed.
At higher potentials, in particular near to the second peak in the capacitance at ∆Ψ ∼1.45V (Fig. 3), the struc-ture factor (Fig. 4) suggests that the interfacial fluid lay-ers are laterally disordered. The ion numblay-ers in the first adsorbed layer on both electrodes are almost unchanged
close to this voltage (Fig. 6). Only in the second ad-sorbed layer can changes be observed, in particular for the number of anions on the positive electrode, but it is difficult to draw definitive conclusions from our data on the microscopic mechanisms underlying the second peak in capacitance.
IV. CONCLUSION
The present work illustrates that the interface between an ionic liquid and a metal electrode can exhibit struc-tures and fluctuations that are not simple reflections of surrounding bulk materials. This rich behavior is ab-sent from a mean-field picture that averages over intra-planar structure. The charge of the electrode is screened by the interfacial fluid and induces subtle changes in its structure. In the present case with ions of comparable sizes but different shapes, small voltages induce changes in the orientation of the anisotropic cations which dif-fer on the two electrodes. In turn, the effective lateral density changes, allowing for the in-plane ordering of the anions and cations in the first adsorbed layer. This in plane order is analogous to that found in experiment1.
The transition out of this ordered state into a disordered non-stoichiometric state is associated with a large change in the charge distribution across the interfacial region of the electrolyte and leads to a peak in capacitance. While a similar peak in the capacitance had been also noted
in experiment2, its origin had been debated27,56. This
work offers a microscopic explanation, free from the ex-perimental difficulties such as surface reconstruction and defects that plague such experimental studies. Moreover, the presence of ordered states like those we describe here may also be at the origin of the slow capacitive process that have been observed when recording broadband ca-pacitance spectra27,48. The structural changes are likely
to also induce different mechanical responses. The ap-proach developed in the present work should thus also provide insights into microscopic mechanism for voltage-dependent lubricants57 and RTIL-based actuators58.
Acknowledgements
BR and DC acknowledge financial support from the France-Berkeley Fund under grant 2012-0007. DTL was supported in the Helios/SERC project by the Director, Office of Science, Office of Basic Energy Sciences, and by the Division of Chemical Sciences, Geosciences, and Bio-sciences of the U.S. Department of Energy at LBNL at Lawrence Berkeley National Laboratory under Contract No. DE-AC02-05CH11231. CM, MS and BR acknowl-edge financial support from the French Agence Nationale de la Recherche (ANR) under grant ANR-2010-BLAN-0933-02. We are grateful for the computing resources on JADE (CINES, French National HPC) obtained through the project x2012096728.
[1] Liu, Y.; Zhang, Y.; Wu, G.; Hu, J. Coexistence of Liquid and Solid Phases of BMIM-PF6Ionic Liquid on Mica
Sur-faces at Room Temperature. J. Am. Chem. Soc. 2006, 128, 7456–7457.
[2] Su, Y.-Z.; Fu, Y.-C.; Yan, J.-W.; Chen, Z.-B.; Mao, B.-W. Double Layer of Au(100)/Ionic Liquid Interface and Its Stability in Imidazolium-Based Ionic Liquids. Ange-wandte Chemie 2009, 121, 5250–5253.
[3] Parsons, R. The Electrical Double Layer: Recent Experi-mental and Theoretical Developments. Chem. Rev. 1990, 90, 813–826.
[4] Simon, P.; Gogotsi, Y. Materials for Electrochemical Ca-pacitors. Nature Mater. 2008, 7, 845–854.
[5] Merlet, C.; Rotenberg, B.; Madden, P. A.; Salanne, M. Computer Simulations of Ionic Liquids at Electro-chemical Interfaces. Phys. Chem. Chem. Phys. 2013, 15, 15781–15792.
[6] Fedorov, M. V.; Kornyshev, A. A. Ionic Liquids at Elec-trified Interfaces. Chem. Rev. 2014, 114, 2978–3036. [7] Mezger, M.; Schr¨oder, H.; Reichert, H.; Schramm, S.;
Okasinski, J. S.; Schr¨oder, S.; Honkim¨aki, V.; Deutsch, M.; Ocko, B. M.; Ralston, J.; et al. Molecular Layering of Fluorinated Ionic Liquids at a Charged Sapphire (0001) Surface. Science 2008, 322, 424–428.
[8] Uysal, A.; Zhou, H.; Feng, G.; Lee, S. S.; Li, S.; Fenter, P.; Cummings, P. T.; Fulvio, P. F.; Dai, S.; McDonough, J. K.; et al. Structural Origins of Potential Dependent Hysteresis at the Electrified Graphene/Ionic Liquid
In-terface. J. Phys. Chem. C 2014, 118, 569–574.
[9] Atkin, R.; Warr, G. Structure in Confined Room-Temperature Ionic Liquids. J. Phys. Chem. C 2007, 111, 5162–5168.
[10] Perkin, S.; Albrecht, T.; Klein, J. Layering and Shear Properties of an Ionic Liquid, 1-Ethyl-3-methylimidazolium Ethylsulfate, Confined to Nano-films Between Mica Surfaces. Phys. Chem. Chem. Phys. 2010, 12, 1243–1247.
[11] Perkin, S. Ionic Liquids in Confined Geometries. Phys. Chem. Chem. Phys. 2012, 14, 5052–5062.
[12] Smith, A. M.; Lovelock, K. R. J.; Gosvami, N. N.; Li-cence, P.; Dolan, A.; Welton, T.; Perkin, S. Monolayer to Bilayer Structural Transition in Confined Pyrrolidinium-Based Ionic Liquids. J. Phys. Chem. Lett. 2013, 4, 378– 382.
[13] Pinilla, C.; Del P´opolo, M. G.; Kohanoff, J.; Lynden-Bell, R. M. Polarization Relaxation in an Ionic Liquid Confined Between Electrified Walls. J. Phys. Chem. B 2007, 111, 4877–4884.
[14] Fedorov, M. V.; Kornyshev, A. A. Ionic Liquid Near a Charged Wall: Structure and Capacitance of Electri-cal Double Layer. J. Phys. Chem. B 2008, 112, 11868– 11872.
[15] Vatamanu, J.; Borodin, O.; Smith, G. D. Molecular In-sights into the Potential and Temperature Dependences of the Differential Capacitance of a Room-Temperature Ionic Liquid at Graphite Electrodes. J. Am. Chem. Soc.
2010, 132, 14825–14833.
[16] Mendon¸ca, A. C. F.; Malfreyt, P.; P´adua, A. A. H. Inter-actions and Ordering of Ionic Liquids at a Metal Surface. J. Chem. Theory Comput. 2012, 8, 3348–3355.
[17] Mendon¸ca, A. C. F.; Fomin, Y.; Malfreyt, P.; P´adua, A. A. H. Novel Ionic Lubricants for Amorphous Carbon Sur-faces: Molecular Modeling of the Structure and Friction. Soft Matter 2013, 9, 10606–10616.
[18] Lanning, O.; Madden, P. A. Screening at a Charged Sur-face by a Molten Salt. J. Phys. Chem. B 2004, 108, 11069–11072.
[19] Jeon, Y.; Vaknin, D.; Bu, W.; Sung, J.; Ouchi, Y.; Sung, W.; Kim, D. Surface Nanocrystallization of an Ionic Liq-uid. Phys. Rev. Lett. 2012, 108, 055502.
[20] Pan, G.-B.; Freyland, W. 2D Phase Transition of PF6
Adlayers at the Electrified Ionic Liquid/Au(111) Inter-face. Chem. Phys. Lett. 2006, 427, 96–100.
[21] Pounds, M.; Tazi, S.; Salanne, M.; Madden, P. A. Ion Adsorption at a Metallic Electrode: An Ab Initio Based Simulation Study. J. Phys.: Condens. Matter 2009, 21, 424109.
[22] Kislenko, S.; Samoylov, I.; Amirov, R. Molecular Dynam-ics Simulation of the Electrochemical Interface Between a Graphite Surface and the Ionic Liquid [BMIM][PF6].
Phys. Chem. Chem. Phys. 2009, 11, 5584–5590. [23] Tazi, S.; Salanne, M.; Simon, C.; Turq, P.; Pounds, M.;
Madden, P. A. Potential-Induced Ordering Transition of the Adsorbed Layer at the Ionic Liquid / Electrified Metal Interface. J. Phys. Chem. B 2010, 114, 8453–8459. [24] Jha, K. C.; Liu, H.; Bockstaller, M. R.; Heinz, H. Facet Recognition and Molecular Ordering of Ionic Liquids on Metal Surfaces. J. Phys. Chem. C 2013, 117, 25969– 25981.
[25] Atkin, R.; Borisenko, N.; Dr¨uschler, M.; El Abedin, S. Z.; Endres, F.; Hayes, R.; Huber, B.; Roling, B. An In Situ STM/AFM and Impedance Spectroscopy Study of the Extremely Pure 1-Butyl-1-methylpyrrolidinium Tris(pentafluoroethyl)trifluorophosphate/Au(111) Inter-face: Potential Dependent Solvation Layers and the Herringbone Reconstruction. Phys. Chem. Chem. Phys. 2011, 13, 6849.
[26] Endres, F.; Borisenko, N.; Abedin, S. Z. E.; Hayes, R.; Atkin, R. The Interface Ionic Liquid(s)/Electrode(s): In Situ STM and AFM Measurements. Faraday Discuss. 2011, 154, 221–233.
[27] Druschler, M.; Borisenko, N.; Wallauer, J.; Winter, C.; Huber, B.; Endres, F.; Roling, B. New Insights Into the Interface Between a Single-crystalline Metal Electrode and an Extremely Pure Ionic Liquid: Slow Interfacial Processes and the Influence of Temperature on Inter-facial Dynamics. Phys. Chem. Chem. Phys. 2012, 14, 5090–5099.
[28] Kornyshev, A. A. Double-layer in Ionic Liquids: Paradigm Change? J. Phys. Chem. B 2007, 111, 5545– 5557.
[29] Lauw, Y.; Horne, M.; Rodopoulos, T.; Leermakers, F. Room-Temperature Ionic Liquids: Excluded Volume and Ion Polarizability Effects in the Electrical Double-Layer Structure and Capacitance. Phys. Rev. Lett. 2009, 103. [30] Bazant, M. Z.; Storey, B. D.; Kornyshev, A. A. Double
Layer in Ionic Liquids: Overscreening versus Crowding. Phys. Rev. Lett. 2011, 106, 046102.
[31] Skinner, B.; Loth, M. S.; Shklovskii, B. I. Capacitance of the Double Layer Formed at the Metal/Ionic-Conductor
Interface: How Large Can It Be? Phys. Rev. Lett. 2010, 104, 128302.
[32] Merlet, C.; Salanne, M.; Rotenberg, B.; Madden, P. A. Imidazolium Ionic Liquid Interfaces with Vapor and Graphite: Interfacial Tension and Capacitance from Coarse-Grained Molecular Simulations.J. Phys. Chem. C 2011, 115, 16613–16618.
[33] Merlet, C.; Salanne, M.; Rotenberg, B. New Coarse-Grained Models of Imidazolium Ionic Liquids for Bulk and Interfacial Molecular Simulations. J. Phys. Chem. C 2012, 116, 7687–7693.
[34] Merlet, C.; Salanne, M.; Rotenberg, B.; Madden, P. In-fluence of Solvation on the Structural and Capacitive Properties of Electrical Double Layer Capacitors. Elec-trochim. Acta 2013, 101, 262–271.
[35] Merlet, C.; Rotenberg, B.; Madden, P. A.; Taberna, P.-L.; Simon, P.; Gogotsi, Y.; Salanne, M. On the Molecular Origin of Supercapacitance in Nanoporous Carbon Elec-trodes. Nature Mater. 2012, 11, 306–310.
[36] Roy, D.; Maroncelli, M. An Improved Four-site Ionic Liq-uid Model. J. Phys. Chem. B 2010, 114, 12629–12631. [37] Reed, S. K.; Lanning, O. J.; Madden, P. A.
Electrochemi-cal Interface Between an Ionic Liquid and a Model Metal-lic Electrode. J. Chem. Phys. 2007, 126, 084704. [38] Gingrich, T. R.; Wilson, M. On the Ewald Summation of
Gaussian Charges for the Simulation of Metallic Surfaces. Chem. Phys. Lett. 2010, 500, 178–183.
[39] Hansen, J.-P.; McDonald, I. Theory of Simple Liquids; Academic Press: London, 4 ed., 2013.
[40] Siepmann, J.; Sprik, M. Influence of Surface-topology and Electrostatic Potential on Water Electrode Systems. J. Chem. Phys. 1995, 102, 511–524.
[41] Limmer, D. T.; Merlet, C.; Salanne, M.; Chandler, D.; Madden, P. A.; van Roij, R.; Rotenberg, B. Hydration of Metal Surfaces can be Dynamically Heterogeneous and Hydrophobic. Phys. Rev. Lett. 2013, 111, 106102. [42] Ferrenberg, A. M.; Swendsen, R. H. Optimized Monte
Carlo Data Analysis. Phys. Rev. Lett. 1989, 63, 1195– 1198.
[43] Johnson, J. Thermal Agitation of Electricity in Conduc-tors. Phys. Rev. 1928, 32, 97–109.
[44] Nyquist, H. Thermal Agitation of Electric Charge in Con-ductors. Phys. Rev. 1928, 32, 110–113.
[45] Alam, M. T.; Islam, M. M.; Okajima, T.; Ohsaka, T. Measurements of Differential Capacitance in Room Tem-perature Ionic Liquid at Mercury, Glassy Carbon and Gold Electrode Interfaces. Electrochem. Commun. 2007, 9, 2370–2374.
[46] Silva, F.; Gomes, C.; Figueiredo, M.; Costa, R.; Mar-tins, A.; Pereira, C. M. The Electrical Double Layer at the [BMIM][PF6] Ionic Liquid/Electrode Interface –
Ef-fect of Temperature on the Differential Capacitance. J. Electroanal. Chem. 2008, 622, 153–160.
[47] Lockett, V.; Sedev, R.; Ralston, J.; Horne, M.; Rodopou-los, T. Differential Capacitance of the Electrical Double Layer in Imidazolium-Based Ionic Liquids: Influence of Potential, Cation Size, and Temperature. J. Phys. Chem. C 2008, 112, 7486–7495.
[48] Roling, B.; Dr¨uschler, M.; Huber, B. Slow and Fast Capacitive Process Taking Place at the Ionic Liq-uid/Electrode Interface. Faraday Discuss. 2012, 154, 303–311.
[49] Cannes, C.; Cachet, H.; Debiemme-Chouvy, C.; Deslouis, C.; de Sanoit, J.; Le Naour, C.; Zinovyeva, V. A. The
Double Layer at [BuMeIm][Tf2N] Ionic Liquid - Pt or C Materials Interfaces. J. Phys. Chem. C 2013, 117, 22915–22925.
[50] Touchette, H. The Large Deviation Approach to Statis-tical Mechanics. Phys. Rep. 2009, 478, 1–69.
[51] Chandler, D. Introduction to Modern Statistical Mechan-ics; Oxford University Press, USA, 1987.
[52] Merlet, C.; P´ean, C.; Rotenberg, B.; Madden, P.; Si-mon, P.; Salanne, M. Simulating Supercapacitors: Can We Model Electrodes as Constant Charge Surfaces? J. Phys. Chem. Lett. 2013, 4, 264–268.
[53] Feng, G. A.; Qiao, R.; Huang, J. S.; Dai, S.; Sumpter, B. G.; Meunier, V. The Importance of Ion Size and Elec-trode Curvature on Electrical Double Layers in Ionic Liq-uids. Phys. Chem. Chem. Phys. 2011, 13, 1152–1161. [54] Kornyshev, A. A.; Vilfan, I. Phase Transitions at the
Electrochemical Interface. Electrochim. Acta 1995, 40, 109–127.
[55] Georgi, N.; Kornyshev, A. A.; Fedorov, M. V. The
Anatomy of the Double Layer and Capacitance in Ionic Liquids With Anisotropic Ions: Electrostriction vs. Lat-tice Saturation. J. Electroanal. Chem. 2010, 649, 261– 267.
[56] Lockett, V.; Horne, M.; Sedev, R.; Rodopoulos, T.; Ral-ston, J. Differential Capacitance of the Double Layer at the Electrode/Ionic Liquids Interface. Phys. Chem. Chem. Phys. 2010, 12, 12499–12512.
[57] Sweeney, J.; Hausen, F.; Hayes, R.; Webber, G. B.; En-dres, F.; Rutland, M. W.; Bennewitz, R.; Atkin, R. Con-trol of Nanoscale Friction on Gold in an Ionic Liquid by a Potential-Dependent Ionic Lubricant Layer. Phys. Rev. Lett. 2012, 109, 155502.
[58] Liu, Y.; Lu, C.; Twigg, S.; Ghaffari, M.; Lin, J.; Wino-grad, N.; Zhang, Q. Direct Observation of Ion Distribu-tions near Electrodes in Ionic Polymer Actuators Con-taining Ionic Liquids. Scientific Reports 2013, 3, 973.