A. Vanlierde(1), F. Dehareng(1), E. Froidmont(2), N. Gengler(3),
H. Soyeurt(3), C. Grelet(1), S. McParland(4), P. Dardenne(1)
(1) CRA-W, Valorisation of Agricultural Products Department, Gembloux, Belgium (2) CRA-W, Production and Sectors Department, Gembloux, Belgium
(3) ULg-GxABT, Agronomy Bio-engineering and Chemistry Department, Gembloux, Belgium (4) Teagasc, Moorepark, Cork, Irland
Context
Prediction of daily CH
4emissions from milk MIR spectra
Take home message
Reducing methane (CH4) emissions from dairy cows is a relevant challenge at two major levels:
The prediction of individual CH4 emissions from milk MIR spectra of dairy cows is possible. As MIR information is available,
it permits large scale applications (individual, herd, region, country levels) over years. Genetic selection, adapted good farming practices and diet/management advices can be initiated to reduce CH4 emission which was not possible before.
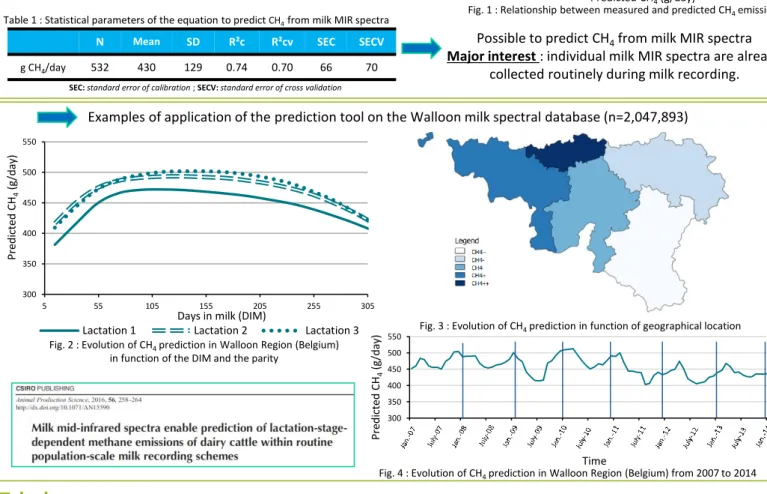
Table 1 : Statistical parameters of the equation to predict CH4 from milk MIR spectra
N Mean SD R²c R²cv SEC SECV
g CH4/day 532 430 129 0.74 0.70 66 70
SEC: standard error of calibration ; SECV: standard error of cross validation
A simple method to predict methane emissions
based on milk mid infrared spectra
[email protected] - www.cra.wallonie.be
Linked individual daily CH4 measurement
Milk Mid Infra Red (MIR) spectra
Environmental concerns CH4 Important greenhouse gas (GHG)
Economical perspective Animal efficiency CH4 production implies
losses of gross energy intake
Individual CH4 emissions have to be quantifiable on a large scale to study the exact link with those levers.
The main levers of actions are feeding, genetics and animal productivity.
100 200 300 400 500 600 700 800 900 100 200 300 400 500 600 700 800 M eas ur ed CH 4 ( g/ day ) Predicted CH4 (g/day)
Fig. 1 : Relationship between measured and predicted CH4 emissions
Ruminal fermentations cause 95% of the CH4 emissions from cows
influence milk composition (eg. fatty acids)
CH4 from cows = 40% of GHG emissions from agriculture sector
Link between CH4 emissions and milk composition
300 350 400 450 500 550 5 55 105 155 205 255 305 P re di ct ed CH 4 ( g/ day )
Days in milk (DIM)
Lactation 1 Lactation 2 Lactation 3
300 350 400 450 500 550 P re di ct ed CH 4 ( g/ day ) Time
Possible to predict CH4 from milk MIR spectra
Major interest : individual milk MIR spectra are already
collected routinely during milk recording.
Fig. 2 : Evolution of CH4 prediction in Walloon Region (Belgium)
in function of the DIM and the parity
Fig. 4 : Evolution of CH4 prediction in Walloon Region (Belgium) from 2007 to 2014
Fig. 3 : Evolution of CH4 prediction in function of geographical location