Road Sign Detection in Images:
A Case Study
R. Belaroussi
⊥, P. Foucher
†, J.-P. Tarel
⊥,
B. Soheilian
‡, P. Charbonnier
†, N. Paparoditis
‡⊥
Universit´e Paris-Est, LEPSIS, INRETS-LCPC,
58 Boulevard Lef`ebvre, F-75015 Paris, France
†
ERA27 LCPC,
11 Rue Jean Mentelin, B.P. 9, 67035 Strasbourg
‡
Universit´e Paris-Est, Laboratoire MATIS, IGN,
73 Avenue de Paris, 94165 Saint-Mand´e, France
Abstract
Road sign identification in images is an impor-tant issue, in particular for vehicle safety applica-tions. It is usually tackled in three stages: detec-tion, recognition and tracking, and evaluated as a whole. To progress towards better algorithms, we fo-cus in this paper on the first stage of the process, namely road sign detection. More specifically, we com-pare, on the same ground-truth image database, re-sults obtained by three algorithms that sample differ-ent state-of-the-art approaches. The three tested al-gorithms: Contour Fitting, Radial Symmetry Trans-form, and pair-wise voting scheme, all use color and edge information and are based on geometrical mod-els of road signs. The test dataset is made of 847 images 960 × 1080 of complex urban scenes (avail-able at www.itowns.fr/benchmarking.html). They feature 251 road signs of different shapes (circular, rectangular, triangular), sizes and types. The pros and cons of the three algorithms are discussed, allowing to draw new research perspectives.
1. Introduction
In the field of traffic sign identification which is im-portant for vehicle safety applications, most of the at-tention has been laid on signs of particular shape (rect-angles and circles) and type (speed limits) to take ad-vantage of these features. When not focused on a spe-cific type of road signs, many systems use color based
segmentation followed by a recognition stage (PCA, ge-netic algorithm, or template matching at several scales and pose shifts). This kind of approach relies on learn-ing from large trainlearn-ing databases due to numerous types of road signs, see [3] for an interesting example. A way to alleviate the problem of building the training dataset consists in starting by a detection stage combining color and shape, more efficient than a color based segmenta-tion. As an illustration, in [1], Adaboost approach is compared to the use of a Hough Transform (HT) on cir-cular speed signs, and the HT is finally selected for its flexibility and speed. To progress in the design of better road sign identification algorithms, we think that it is important to evaluate and compare each stage, in itself, starting by the first stage of the process: the detection.
Actually, most of the road sign detectors are based on the use of the geometrical model of road sign border and applied on the gradient map of the input image. We can categorize them into three types of approaches:
• Single Pixel Voting (SPV) schemes, like the Hough Transform (HT) [1, 7] for circular signs or the Radial Symmetry Transform (RST) [13, 4] for circles and regular polygons [12, 10],
• Contour Fitting (CF), as in [2] for circular signs, • Pair-Wise Pixels Voting (PWPV) schemes, as the
Bilateral Chinese Transform (BCT) for circular and rectangular signs [6] or the Vertex and Bisec-tor Transform (VBT) for triangular signs [5]. On a ground-truth database made of 847 images of size 960 × 1080 taken in complex urban scenes, we evaluate and compare three algorithms, each being rep-resentative of one of the three previously described cat-egories. The test database contains a total of 251 road signs with various shapes: circular, rectangular and tri-angular.
This paper is organized as follows: Sec. 2 summa-rizes the three compared algorithms. Then, in Sec. 3, the ground-truth database is described and experimen-tal results and comparisons are detailed and discussed.
2. Road Sign Detection Algorithms
2.1
Single Pixel Voting (SPV)
This method is decomposed into the three following steps.
Step 1: Two binary maps are built by classifying the image into red/non red and blue/non blue pixels. The red classifier considers a pixel (R, G, B) as red, when the normalized red component dominates, i.e when R >
Figure 1. Examples of CF detections.
αr(G + B). A second condition, R − max(G, B) >
βr[max(G, B) − min(G, B)], is used to check that the
color is far from yellow and magenta [8]. The blue clas-sifier is defined as B > αb(G + R). Coefficients αr, βr
and αbin the two classifiers are determined empirically
from a separate database.
Step 2: The resulting connected components de-fine Regions of Interest (RoI) and are filtered accord-ing to geometric characteristics. The dimensions of the bounding box of each connected component must lie between 16 and 150 pixels. The extent which is de-fined as the ratio between the object area and the area of its bounding box is also used. Threshold values on the extent are deduced from road sign standards. The red color appears only on the border of red road signs. Therefore, only an upper threshold is used on the red extent and is fixed to 0.35 for warning signs and to 0.65 for prohibition signs. The blue color appears densely in blue road signs. As a consequence, a lower threshold, equal to 0.45, is used for both blue categories (circle and square signs). For circular objects, a further se-lection is performed according to their eccentricity. It consists in an upper thresholding empirically set as ex-plained in [11].
Step 3: The remaining RoIs are processed using RST or HT which are Single Pixel Voting SPV al-gorithms, depending of the sign shape. The used RST [13, 4] is a simplified and fast version of the Cir-cular Hough Transform. It is applied on the edges of the image of the normalized blue component to check if the object is circular. The HT detects the straight edges of connected components and the angles between these straight lines are used to check if the processed object can be triangular (on the red map) or rectangular (on the blue map).
2.2
Contour Fitting (CF)
With the second method, a color filter is also used to select RoIs which are further processed by Contour
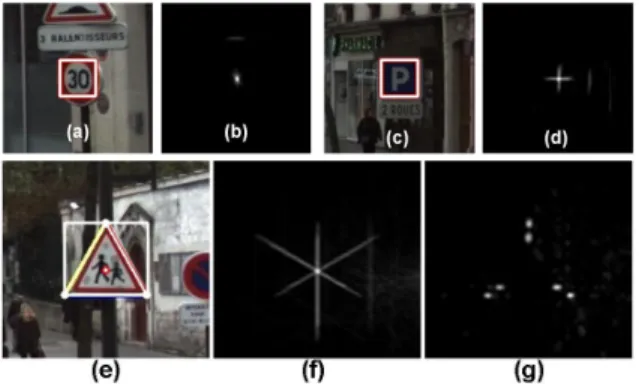
Figure 2. Top: BCT (circles and rectan-gles). Bottom: VBT (trianrectan-gles).
Fitting (CF). A first step builds two maps of the red pixels (selected if R > αB and R > αG) and of the blue pixels (selected if B > αR and B > αG), and provides RoIs in the image. The method proposed in [2] is extended here to detect rectangular and triangu-lar signs. The detection step consists in the RANSAC algorithm [9] applied on edge points of each RoI with three shape models: ellipses, triangles and rectangles under projective transformations. The best shape is then selected using a compatibility criterion that tests the co-herence of the estimated shape with the extracted edges. Fig. 1 shows examples of extracted road signs in an im-age using the CF method.
2.3
Pair-Wise Pixels Voting (PWPV)
The third method does not use any color segmenta-tion but is applied to the sum of the gradient maps ob-tained from the red and blue normalized colors images. It is based on a kind of bivariate HT where votes are built from pairs of edge points with specific relationship between their orientation.
To detect circular and rectangular shapes, we tested the Bilateral Chinese Transform (BCT), see [6], and for triangles, the Vertex and Bisector Transformation (VBT), see [5]. The main idea is that for each pair of edge points with a specific gradient orientation relation-ship, a vote is cast in their middle point for the BCT. For the VBT, a vote is cast to the angle vertex and, in another array, to the set of points belonging to the angle bisector. Fig. 2 shows detection examples with accu-mulators. (a) and (c) display the source image with the traffic signs detected by thresholding their correspond-ing BCT accumulators, (b) and (d) respectively. A trian-gle is detected using the VBT on source image (e) using the two arrays accumulating evidence of angle bisector (f) and angle vertex (g).
3. Experimental Results
3.1
The Stereopolis database
Figure 3. Sizes (min(width, height)) distri-bution of the 251 road signs.
The Stereopolis database is made of 847 im-ages 960×1080 containing 251 road signs. The original images and the ground truth is available at www.itowns.fr/benchmarking.html. The images were acquired in Paris, France, with the IGN moving van, grabbing a picture every 5 m. We divided them into 4 categories according to their size, ranging from 16 pixels when a sign is far from the camera to 150.
The size of each road sign is defined as the minimum between the width and the height of its bounding box. In Fig. 3, we display the variation of appearance of two signs, with their corresponding size, while the van is approaching them. In this figure, the number of road signs observed for each size category is displayed: 30 signs higher than 64 pixels ; 74 higher than 48 ; 173 higher than 32 and a total of 251 signs higher than 16 pixels.
3.2
Performances of the Road Sign Detectors
The three algorithms are tested with the same ground truth database and criterion. A detection is defined as a True Positive under two conditions: the distance be-tween its center and the true center is lower than 20% of the true size, and the relative absolute error on the width and on the height of the bounding box is lower than 45%. The used ROC curves plot, for four sizes of road signs, the Correct Detection Rate CDR versus the False Positive Per Image FPPI [14] which are defined as:CDR = TP
P FPPI = FP Nb Img
where TP is the number of True Positives, FP is the number of False Positives and P is the total number of signs. NbImg is the total number of images, i.e. 847 in our experiment.
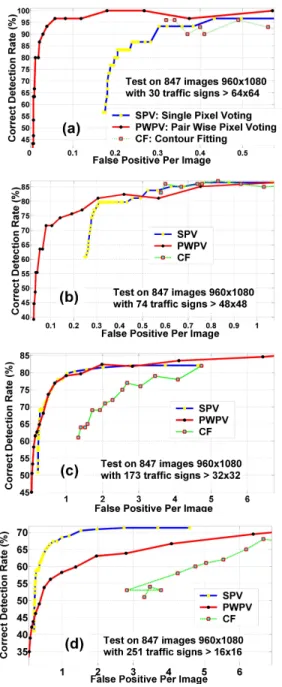
Figure 4. ROC for signs size: (a) ≥ 64, (b)
≥ 48, (c) ≥ 32, (d) ≥ 16.
The ROC curves in Fig. 4 present comparative re-sults for all types of traffic signs: blue and red, trian-gles, circles and rectantrian-gles, for 4 categories of sizes. The ROC curves are built using a variable accumula-tor threshold for the SPV and PWPV methods. For CF method, it is the value α of the color threshold which is used. The obtained ROC curves are not drastically dif-ferent between the three compared algorithms and quite similar for medium size (≥ 48), see left of Fig. 4(b). Nevertheless, for large road signs (≥ 64), the PWPV
Min. Num. CF SPV PWPV Size signs CDR FPPI CDR FPPI CDR FPPI 64 30 97% 0.32 97% 0.43 100% 0.2 48 74 87% 0.83 86% 0.76 92% 22
32 173 82% 4.7 82% 2.8 88% 11
16 251 72% 11.5 71% 2.7 73% 11
Table 1. Maximum reached CDR and asso-ciated FPPI.
prevails against the SPV and CF. This can be explained by the fact that large connected components may be bro-ken into pieces during color segmentation. On the con-trary, when signs are small, the SPV algorithm leads to the best ROC curve.
By comparing ROC curves, we evaluate the intrin-sic detection performances of each algorithm. Keeping in mind that the detection can also be followed by a recognition or a tracking stage able to filter even more false alarms, it is better to compare the maximum CDR each algorithm is able to achieve, with a reasonable amount of false alarms. For the three algorithms, the maximum CDR are shown in Tab. 1 with correspond-ing FPPI rates, for the 4 categories of sizes. It appears that the maximum CDR decreases with decreasing sizes for the three algorithms. This is due to the use of a geo-metric model. Indeed, when signs are smaller, the num-ber of voting pixels is reduced and may be too short to discriminate correctly signs from the background. The maximum CDR obtained with PWPV algorithm is al-ways higher than when using SPV and CF. This is due again to the use of connected components in SPV and CF which are subject to over and under segmentation. Nevertheless, the PWPV algorithm achieves maximum CDR for sizes ≥ 16, ≥ 32 and ≥ 48, at the cost of a much higher FPPI. This indicates that the use of the color seems especially interesting for small signs. In particular, for size ≥ 16, the SPV reaches the same level of correct detections as the PWPV with around 4 times less FPPI. For traffic signs of size ≥ 16 pixels, the maximum CDR is around 70% for the three algo-rithms. Therefore around 30% of signs are not detected. This percentage of miss detection is too large, and it is one of the main drawback observed on the tested al-gorithms. The maximum CDR=100% is achieved only with the PWPV algorithm for the category ≥ 64 with an efficient rate of 0.2 FPPI.
3.3
The Subset of Triangular Traffic Signs
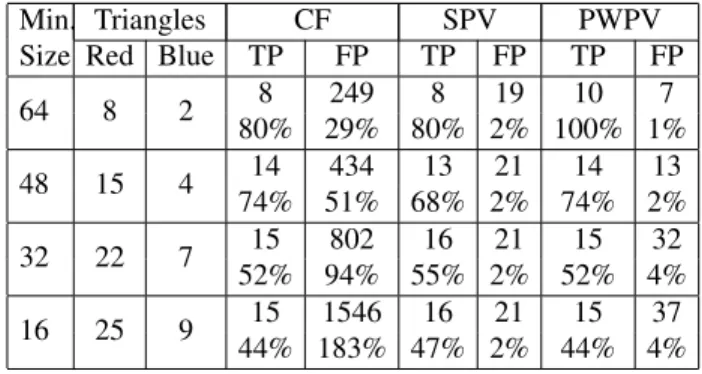
In the three tested algorithms, triangular road signs are detected separately, and it is thus interesting tofo-Min. Size Triangles CF SPV PWPV Red Blue TP FP TP FP TP FP 64 8 2 8 249 8 19 10 7 80% 29% 80% 2% 100% 1% 48 15 4 14 434 13 21 14 13 74% 51% 68% 2% 74% 2% 32 22 7 15 802 16 21 15 32 52% 94% 55% 2% 52% 4% 16 25 9 15 1546 16 21 15 37 44% 183% 47% 2% 44% 4%
Table 2. Triangular signs detection.
cus of this kind of signs. Tab. 2 shows the obtained detection results on triangular signs. Triangular signs are usually red and white (Warning: school, speed bump, pedestrian) but a blue triangle can also be seen in squared signs such as pedestrian crossing. Fig. 3 dis-plays examples of these two kinds of signs. The CF and SPV algorithms only search for ellipse and rectan-gle into blue RoIs, contrary to PWPV algorithm. This explains the differences in performances observed in Tab. 2 which are nearly the same for the CDR, the main difference laying in the FP rate. It thus seems interest-ing to detect pedestrian crossinterest-ing signs in both ways as as rectangular signs and as blue triangular signs.
We can see that the PWPV better performs for size ≥ 48, while the SPV gives less False Positives when the size is ≤ 48. This means that the PWPV requires more voting pixels than the SPV for comparable perfor-mances.
4
Conclusion
We proposed a comparison between three algorithms for road sign detection in images. Contour Fitting (CF) and Single Pixel Voting (SPV) algorithms use red and blue color classifiers, while the Pair-Wise Pixels Voting (PWPV) algorithm is applied to a combination of the red and blue edges. A color filter has the advantage of defining a reduced number of RoIs. This drastically re-duces the computation time. If the color segmentation is efficient to remove false positives when detecting very small signs, its main drawback is to be subject to un-der and over segmentation for larger signs. On the con-trary, the PWPV method, which is not subject to this drawback, may gain performances by using a slightly stronger color selection scheme, particularly in the case of very small road signs.
The average processing time per image are similar with 2.3 seconds for CF, 1.5 seconds for SPV, and 0.8 second for PWPV. Nevertheless, the SPV method is
probably one order of magnitude faster since it is in Matlabr contrary to the two others which are written in C.
The CF et SPV methods obtained relatively similar results in term of maximum Correct Detection Rate. If the associated FPPI are relatively similar for sizes ≥ 32, ≥ 48 and ≥ 64, the difference in FPPI for size ≥ 64 requires a deeper study.
In the CF and SPV methods, the detected road signs are classified into three classes: red triangles, blue rect-angles and red or blue circles. The PWPV distinguishes two kinds of detections: triangles on the one hand, cir-cles and rectangles on the other hands. This allows to detect a squared sign containing a blue triangle in two ways.
When comparing voting schemes, we observed that pair-wise voting becomes more efficient with increas-ing sizes compared to sincreas-ingle votincreas-ing. Therefore, sincreas-ingle voting must be preferred when the object size to detect is small and pair-wise voting must be preferred when it is large.
Depending on the application, a different compro-mise has to be made between false positives and missed targets. For pure detection, a low false positive rate with a high true positive rate is required, which may be obtained by improving the ROC curves of CF, SPV or PWPV algorithms as discussed previously, or by a cooperation between these algorithms. When the de-tection is used before a recognition stage, the algorithm giving the best Correct Detection Rate should be pre-ferred if the number of false positive stays reasonable, these false candidates being discarded by the recogni-tion stage.
Acknowledgments
This work is partly funded by the ANR (French Na-tional Research Agency) within iTowns-MDCO project.
References
[1] S. W. A. Ruta, F. Porikli and Y. Li. In-vehicle camera traffic sign detection and recognition. Machine Vision and Applications, online, December 2009.
[2] A. Arlicot, B. Soheilian, and N. Paparoditis. Circu-lar road sign extraction from street level images us-ing colour, shape and texture database maps. In In-ternational Archives of Photogrammetry, Remote Sens-ing and Spatial Information Sciences, volume 38 (Part 3/W4), pages 205–210, Paris, France, 2009.
[3] C. Bahlmann, Y. Zhu, V. Ramesh, M. Pellkofer, and T. Koehler. A system for traffic sign detection, track-ing, and recognition using color, shape, and motion in-formation. In Proceedings of IEEE Intelligent Vehicles Symposium, pages 255–260, 2005.
[4] N. Barnes and A. Zelinsky. Real-time speed sign detec-tion using the radial symmetry detector. IEEE Transac-tions on Intelligent Transportation Systems, 9(2):322– 332, 2008.
[5] R. Belaroussi and J.-P. Tarel. Angle vertex and bisec-tor geometric model for triangular road sign detection. In IEEE Workshop on Applications of Computer Vision WACV’09, pages 255–260, 2009.
[6] R. Belaroussi and J.-P. Tarel. A real-time road sign de-tection using bilateral chinese transform. In Proceed-ings of International Symposium on Visual Computing ISVC, pages 1161–1170, 2009.
[7] C. Caraffi, , E. Cardarelli, P. Medici, P. P. Porta, G. Ghi-sio, and G. Monchiero. An algorithm for italian de-restriction signs detection. In Proceedings of IEEE In-telligent Vehicles Symposium, pages 834–840, 2005. [8] G. Dutilleux and P. Charbonnier. Biological
metaheuris-tics for road sign detection. In P. Siarry, editor, Opti-misation in signal and image processing, Digital signal Processing, chapter 10, pages 245–266. ISTE-Wiley, June 2009. ISBN 978-1-8482-1044-8.
[9] M. Fischler and R. Bolles. Random sample consensus: A paradigm for model fitting with applications to image analysis and automated cartography. Communications of the ACM, 24(6):381–395, 1981.
[10] P. Foucher, P. Charbonnier, and H. Kebbous. Evaluation of a road sign pre-detection system by image analysis. In Proceedings of International Conference on Com-puter Vision Theory and Applications VISAPP, pages 362–367, 2009.
[11] P. Foucher, P. Charbonnier, and H. Kebbous. Evaluation of a road sign pre-detection system by image analysis. In Proceedings of International Conference on Com-puter Vision theory and Applications (VISAPP 2009), pages 362–367, Lisbonne, Portugal, Feb. 2009. [12] G. Loy and N. Barnes. Fast shape-based road sign
de-tection for a driver assistance system. In Proceedings of Intelligent Robots and Systems IROS, pages 70–75, 2004.
[13] G. Loy and A. Zelinsky. Fast radial symmetry for de-tecting points of interest. IEEE Transactions on Pat-tern Analysis and Machine Intelligence, 25(8):959–973, Aug. 2003.
[14] S. Maji and J. Malik. Object detection using a max-margin hough transform. In Proceedings of Computer Vision and Pattern Recognition CVPR, pages 1038– 1045, 2009.