measured. Results are compared with previous theoretical and experimental works. The major source of energy dissipation is found to be the slipping of the disk on the plane.
DOI: 10.1103/PhysRevE.69.056610 PACS number(s): 05.45.$a, 45.40.$f
I. INTRODUCTION
A common straightforward experiment is the following. A coin spun onto a table rotates with an increasing precession rate and a decreasing inclination angle until it abruptly stops. This complex motion is known as the Euler’s disk problem. Within the classical formalism of mechanics, the disk should spin ad infinitum. Moffatt’s work [1,2] emphasized the necessity of considering energy dissipation in order to avoid such forever persisting motion. Many theoretical and numerical studies [3–6] have been devoted to the finding of the major dissipation process leading to the stop of the disk. However, only few experimental results can be found in the scientific literature [2,7].
For a disk of radius R, mass m, and an inertia momentum I, the total energy reads
E = mgR sin!!" +1 2I#
2sin2!!", !1"
where!is the inclination angle with respect to the horizontal and # is the precession rate. A sketch of the disk is illus-trated in Fig. 1. Parameters!, #, and"are emphasized.
In order to meet observations, one has to consider that the energy E is dissipated with a rate%. And the aim is to find the major mechanism responsible for energy dissipation%.
Considering that the energy is dissipated through a velocity-dependent process, the temporal evolution of!, #, and"can be described in a general way by
!# !t0− t"n!, !2" ##
$
1 t0− t%
n# , !3" and "# !t0− t"n", !4"where n!, n#, and n" are the dynamical exponents to be
determined [6]. Depending on the dissipation process, differ-ent values can be found for these expondiffer-ents. The prefactors of those laws, and hence collapsing times t0, also depend on
the dissipation mechanism. Moreover, it should be noticed that these power laws may be valid only in a limited range of time since the major dissipation mechanism may depend on the dynamical parameters’ values.
Nowadays, no consensus has been found by the physical community. Other experiments are thus required in order to emphasize the major dissipation process leading to the brutal stop of the disk.
In the following section, we present the experimental setup and procedures. In Sec. III, we report the experimental results concerning the temporal evolution of the inclination angle, the precession frequency, and the rotation velocity as well as times to collapse. We discuss the results in Sec. IV. Eventually, a summary of our findings is given in Sec. V.
II. EXPERIMENTAL PROCEDURES
The experiment consists of spinning a disk by hand onto a table and to observe the evolution of the three different dy-namical parameters with the help of a high speed video sys-tem.
We used three different coins: (i) a stainless disk having a diameter D2= 75± 0.01 mm, thickness e2= 10± 0.01 mm, and
FIG. 1. Sketch of the disk and its dynamical parameters: the inclination angle !, the precession speed #, and the angular veloc-ity ".
mass m2= 353.4± 0.1 g; (ii) an aluminum disk with a
diam-eter D1= 75± 0.01 mm, thickness e1= 9.9± 0.01 mm, and
mass m1= 123.9± 0.1 g; (iii) an aluminum torus with an
in-ternal diameter DTi= 63.65± 0.01 mm, external diameter
DTe= 78± 0.01 mm, thickness eT= 10± 0.02 mm and mass
mT= 124.5± 0.1 g. The surfaces were 2 mm thick plates of
aluminum, glass, and rough plastic sheets. All these plates were supported by the same table in order to change only the surface roughness. Starting from the lowest friction coeffi-cient to the largest one, one finds the glass, the aluminum, and the rough plastic surface.
Here, we describe the experimental procedures we used for the data acquisitions. Note that despite the fact that we spun the disks by hand, our results are quite reproducible. This has been also mentioned in Ref. [7].
A. Inclination angle !
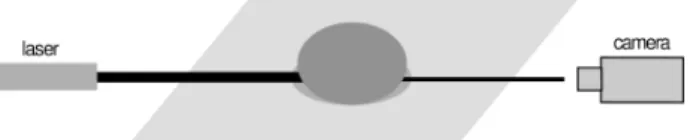
The inclination angle measurement is based on the reflec-tivity of the disks. When a laser beam is directed to a disk with a finite angle&relative to the horizontal plane, one can observe an “ellipse” formed by the laser beam on a screen situated on the opposite side. This ellipse is due to the mo-tion of the disk, which changes the incident angle of the laser beam on the disk. In fact, a circle should be observed on the screen. However, the angle between the laser beam and the horizontal plane induces a deformation of this circle into an ellipse. In order to minimize this effect, the laser beam is placed as vertically as possible (&&80°, in practice); its po-sition being limited by the screen. A sketch of the setup is illustrated in Fig. 2.
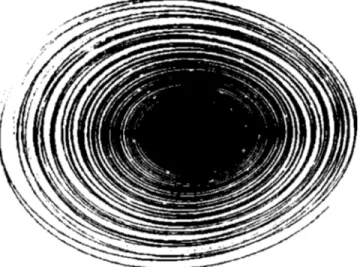
Since the inclination angle! of the disk decreases with time, the size of the ellipse accordingly decreases. Measuring the size of the ellipse gives us the inclination angle!of the disk as a function of time. In Fig. 3, we present the whole path of the laser beam during the last seconds of the disk motion. One can observe a spiral pattern due to the decrease of!with time. The black circle in the center of the picture is an artifact due to the width of the trajectory on the picture. Experimentally, the high speed video camera allows us to distinguish the trajectories until 5 ' 10−4 s before the disk
motion stops. However, direct observations from the side of the disks showed that a recording rate of 500 frames per second (fps) is large enough for an accurate determination of
!.
Geometrical arguments give us the relation between the size of the ellipse and the inclination angle!. The main axis length A of the ellipse and the inclination angle!are corre-lated through
A = 2r sin!2!" sin!&+(" −cos2!&+("
sin!&+("tan2!2!"
, !5"
where( is the angle between the screen and the horizontal plane and r is the distance from the center of the disk to the center of the ellipse. Typically, r = 0.3 m. This relation is in-vertible for determining!from the knowledge of A, but has a rather complicated formulation. The minor axis case is more simple. Calculations lead to the following relation be-tween the vertical axis length B and the inclination angle:
!=1 2arccos
'
1 − 2 cos!2&" + cos
(
2 arcsin$
B 2r%
)
4 sin2!&"*
. !6"The inclination angle has been obtained from both A and B values for each acquisition time. Then, an average over both values of!has been taken.
B. Precession rate "
In order to measure the precession rate #, we have pro-ceeded as follows. A laser beam has been horizontally placed in front of the table in such a way that the beam skims the table (see Fig. 4). During the rotating motion of the disk, the laser beam is intercepted, leading to a fast decrease of the light intensity transmitted on the other side of the table. Such a light extinction occurs twice a rotation of the disk. The transmitted light is observed with a high speed video camera situated at the same height as the laser but on the opposite FIG. 2. Experimental setup for the inclination angle
measure-ment. A laser beam is reflected by the disk and creates an “ellipse” on a screen situated on the other side. A high speed video camera records images of the pattern.
FIG. 3. Path of the laser beam during the disk rotation. The size of the ellipse decreases with time.
created by the laser beam. The images are recorded at a frame rate of 500 fps, allowing a high precision for the spot extinction detection.
Figure 5 presents a typical curve for the temporal evolu-tion of the intensity I of the laser spot in arbitrary units. Each sharp peak corresponds to an interception of the laser beam by the disk. The peaks are alternatively due to the front and to the back of the disk. Peaks are detected by fitting a Gauss-ian curve on each point of the signal. In so doing, times corresponding to successive minima of the intensity are re-corded. This method allows a precision of 0.002 s.
C. Angular velocity #
We have measured the angular velocity"of the disk by recording the motion of two diametrically opposed white marks situated on the top face of the disk. The experimental setup is illustrated in Fig. 6. The angular position and then the angular velocity" are calculated from the displacement of both dots between two consecutive frames. Images have been recorded at a rate of 125 fps. This has been found to be sufficient for detecting the stop of the disk. Top view record-ings also allowed us to measure the motion of the center of mass of the disk.
III. EXPERIMENTAL RESULTS
In this section, we present the results of experiments per-formed with three “disks” on the three different surfaces.
This corresponds to nine different experimental situations. Measurements have been performed a large number of times for each experimental condition.
We will first consider time to collapse t0 and long time
behavior of the dynamical parameters. Then, the last stage of the disk’s motion will be further analyzed.
A. Time to collapse t0
Figure 7 presents two typical evolutions of the precession rate # as a function of time t. Black lines correspond to fits using Eq. (3).
At the beginning of the disk’s motion, a larger dispersion of the measurement is observed due to the way the disk was set into motion. The center of mass of the disk may, for example, own some small linear momentum. However, the motion considered in Sec. I is rapidly reached and we have observed that the early stage of motion has no significant effect on the results presented hereafter. This was also men-tioned in Ref. [7].
One can seen that a power law behavior is consistent with observations over two decades in times. This means that, as close as we can approach the collapse, the major mechanism of energy dissipation remains the same irrespective of its nature.
FIG. 5. Typical curve of the temporal evolution of the intensity I of the laser beam. A fit using a Gaussian curve (dashed curve) is also illustrated.
on the disk. Their motions are recorded with the help of a high speed video camera, from the top.
FIG. 7. Temporal evolution of the precession rate # over an entire run in a log-log scale. Two cases are illustrated, as well as fits using Eq. (3).
The time to collapse t0 is observed to decrease as the
friction between the disk and the surface increases. For the aluminum disk spun with an initial inclination angle !
= 23° ± 0.1° (disk 1) on the glass surface, t0
= 12.389± 0.007 s while t0= 3.393± 0.168 s for the same disk
on the aluminum surface (similar results are obtained for other experimental conditions). Since the geometry of the system is the same in both cases, the energy dissipation may not come from the air drag. Friction seems thus the main source of dissipation.
B. Inclination angle !
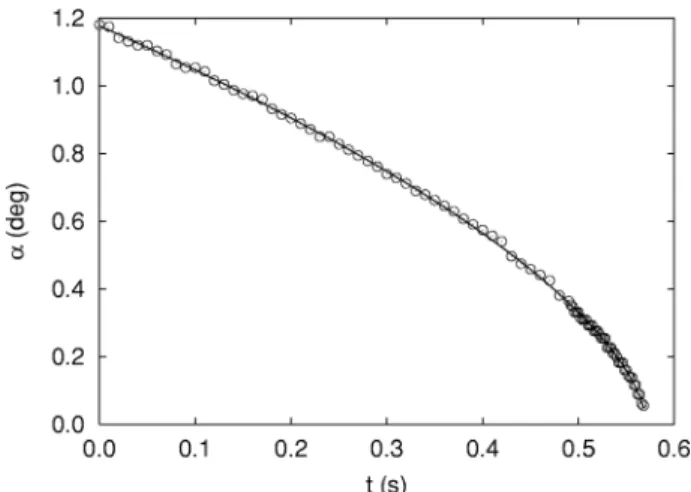
Figure 8 presents a typical curve of the inclination angle!
as a function of time t. The angle is observed to decrease and to vanish quite abruptly at time t0= 0.571 s. A fit using Eq.
(2) emphasizes the power law behavior.
Values of the exponent n! are presented in Table I.
De-spite the error bars, n! seems to increase when the friction
coefficient increases. This tends to show that the friction at the rolling contact point of the disk may play an important role in the dissipation process of the disk energy. One should also note the small differences between the values obtained for the three “disks.” Particularly, the torus behaves in nearly the same way as both disks. This suggests that the air layer under the disk is not a major source for the energy dissipa-tion. Another observation is that n!does not depend on the
mass of the spinning coin, in agreement with the equations of motion derived in Ref. [6].
C. Precession rate "
The precession rate # is observed to diverge after a finite time, as illustrated in Fig. 9. The divergence [Eq. (3)] is
illustrated (continuous curve of Fig. 9). Note that around the black curve, small oscillations of # are observed. They were already reported in other measurements [3].
Adjusting the data with the power law [Eq. (3)], we have found different n# values for different experimental
condi-tions (see Table II). It is observed that the precession rate diverges as rapidly as the static friction increases. Once again, the torus and the disks behave in similar ways, in the sense that the values of n# are not so different for these
different coins. This also suggests that the air drag is not a major source for the energy dissipation.
D. Angular velocity #
We have measured the angular velocity of the different coins and reported the values of n" in Table III. A typical
curve as well as a fit using Eq. (4) are reported in Fig. 10. As observed for both!and #, an increase in the friction between the disk and the surface causes a faster energy dis-sipation. Here, we observe that the different coins give dif-ferent values of the exponent n", contrary to the previous
observations.
IV. DISCUSSION
Assuming the air drag as the main dissipation mechanism leading to the singular behavior, Moffatt concluded that n!
should be 1 / 3 and n#= 1 / 6. Bildsten pointed out a mistake
in the Moffatt’s calculations and found the values n!= 4 / 9
and n#= 2 / 9. These theoretical previsions are much lower
than the experimental results, suggesting that air drag does
TABLE II. Values of the exponent n#of Eq. (3) for the three disks on the three different surfaces.
n# Glass Aluminum Plastic
Disk 1 0.39± 0.03 0.34± 0.01 0.39± 0.03
Disk 2 0.32± 0.01 0.30± 0.01 0.34± 0.01
Torus 0.30± 0.03 0.31± 0.02 0.35± 0.02
FIG. 8. Temporal evolution of the inclination angle ! for the stainless steel disk (disk 1) case on the aluminum surface. A fit using Eq. (2) is also illustrated.
TABLE I. Values of the exponent n! of Eq. (2) for the three “disks” on the different surfaces.
n! Glass Aluminum Plastic
Disk 1 0.51± 0.01 0.60± 0.01 0.56± 0.03
Disk 2 0.49± 0.01 0.49± 0.05 0.59± 0.02
Torus 0.52± 0.02 0.56± 0.03 0.66± 0.03
FIG. 9. Temporal evolution of the precession rate # for the aluminum disk case on the aluminum surface. A fit using Eq. (3) is also illustrated.
effect of viscous drag.
The minor role played by air drag compared to friction in the dissipation process is also revealed by theoretical predic-tions. Considering a viscous dissipation as in Ref. [5], an initial angle!0= 0.4 rad, mass m = 124 g, radius a = 3.75 cm,
and an air kinematic viscosity)= 0.15 cm2s−1, we find that
the aluminum disk should spin for t0&100 s over all the
surfaces. This time is much larger than those observed in the experiments (see Sec. III A) and does not depend on the solid-solid contact. On the contrary, if we consider a dissipa-tion at the point of rolling contact [7], we find t0&6 s for the
aluminum disk on the aluminum surface and t0&20 s for the
same disk on the glass surface. In addition to the fact that these predicted times are of good orders of magnitude, they decrease when the friction increases as in the experiments.
From the values of both exponents n! and n# and from
times to collapse, the rolling friction is shown to play an important role in the energy dissipation mechanism. Indeed, one would expect [7] n#= 1 / 3 and t0#10 s in the case of
rolling without slipping, which is quite close to our values. This result is also supported by plots of the real dissipa-tion rate%of energy during the experiments. From the val-ues of!and # we have calculated the total energy E of the disks [Eq. (1)] and we have deduced the dissipated rate of energy%from the derivative of that energy E.
In Fig. 11, one can find a typical evolution of the dissipa-tion rate% as a function of the inclination angle ! for the stainless disk (disk 2) on both glass and aluminum surfaces.
The disk is observed to dissipate a larger amount of energy by time unit on the surface with the largest friction. On the same figure, we have plotted the curves corresponding to a dissipation rate due to friction [7]
%frict# cos!!"#. !7"
The agreement between experimental and theoretical results emphasize the role played by friction in the energy dissipa-tion.
In condition of rolling without slipping, a proportionality between the precession rate and the angular velocity is ex-pected [1,6]. This is not so obvious here, even though data are quite dispersed (see Tables II and III). Moreover, for a considered surface, the angular velocity exponent n"
de-pends on the disk, and therefore on the static friction. These observations lead us to believe that the disk may slip while it is rotating. The influence of the slipping of the disk was also suggested in Ref. [2], but from a theoretical point of view. This is in contradiction with Ref. [8] where the energy dissipation by slipping is ruled out. However, these preliminary experiments were performed during the early stage of the disk rotation. Indeed, only one experimental con-dition was measured and moreover at a low frame recording rate .
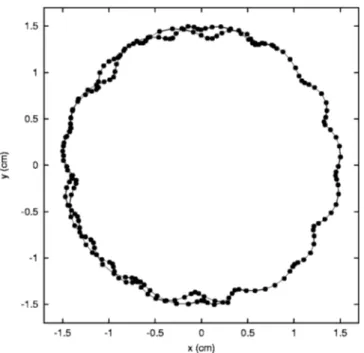
In order to emphasize the slipping of the disk, we have recorded the motion of the center of mass of the disk with a high precision (250 fps, 1024' 1024 pixels images). Figure 12 illustrates the trajectory of the center of mass within one and a half angular revolution. One can see that the center of mass moves along a circular path. As noticed, the center of this circular path has a tendency to move the most at the early stage of the motion than at the end. In the case of the circular ring, this “stabilization” is less important. We sup-pose that the large surface of the disks helps them to get this stabilization. It will be interesting to check whether this mechanism always occurs in vacuum condition, in order to determine the role of air in this phenomenon.
Another important observation is that the center of mass of the disk exhibits small quasiperiodic excursions around the circular trajectory. These oscillations are not exactly pe-FIG. 10. Temporal evolution of the angular velocity " for the
stainless steel disk case on the glass surface. A fit using Eq. (4) is also plotted.
FIG. 11. Dissipation rate of energy % as a function of the incli-nation angle !. Two cases are illustrated.
riodic but are quite frequent, especially during the last angu-lar rotations of the disk.
These small oscillations in the circular trajectory of the center of mass of the disk are due to the slipping of the
contact point of the disk along the surface. The resolution of our setup does not allows us to determine whether there is some kind of “stick slip” of this point on the surface. How-ever, these slips are responsible for the energy dissipation leading to the final stop of the disk. Since the disk dissipates in a rolling and slipping motion and not only by friction, we understand why theoretical times to collapse based on only one dissipation process are larger than the experimental ones.
V. SUMMARY
We have performed experiments for studying the Euler’s disk motion. The divergence of the precession rate as the inclination angle and the angular velocity vanish has been observed after a finite time. All these parameters follow power law behaviors. The time to collapse is observed to decrease with the friction.
Contrary to previous theoretical works, the air is found to be a minor source of energy dissipation. On the contrary, the major energy dissipation process is found to be the rolling and slipping of the disk on the supporting surface.
ACKNOWLEDGMENTS
H.C. is financially supported by the FRIA (Brussels, Bel-gium). S.D. acknowledges the FNRS (Brussels, Belgium) for financial support. This work was also supported through the ARC Contract No. 02/07-293.
[1] H. K. Moffatt, Nature (London) 404, 833 (2000).
[2] G. van der Engh, P. Neslon, and J. Roach, Nature (London) 408, 540 (2000).
[3] A. A. Stanislavsky and K. Weron, Physica D 156, 247 (2001). [4] P. Kessler and O. M. O’Reilly, Regular Chaotic Dyn. 7, 49
(2002).
[5] L. Bildsten, Phys. Rev. E 66, 056309 (2002). [6] K. T. McDonald, e-print physics/0008237.
[7] K. Easwar, F. Rouyer, and N. Menon, Phys. Rev. E 66, 045102(R) (2002).
[8] D. Petrie, J. L. Hunt, and C. G. Gray, Am. J. Phys. 70, 1025 (2002).
FIG. 12. Path of the center of mass of disk 1 on the aluminum surface.