In Pinto, R, Lopez, V., & Simarro C. (Eds). (2012). Computer based learning in science – Conference Proceedings 2012. Learning science in the society of computers. Barcelona, Spain: Centre for Research in Science and Mathematics Education (CRECIM).
EFFECT OF DISCIPLINARY CONTENT OF A SIMULATION
ON OPEN-ENDED PROBLEM-SOLVING STRATEGIES
Marc Couture ABSTRACT
There is a long-standing debate about so-called generic vs. domain- or context-specific problem-solving skills and strategies. To investigate this issue, we developed a pair of structurally and functionally similar computer simulations and used them in an experimental study with undergraduate students from all fields of study. One, described to users as a teaching tool based on current entomology research, featured three species of ants whose tasks could change as a result of encounters with each other. The other, which we call a non-disciplinary simulation, featured three types of abstract moving shapes whose color could change after a collision. Users received no information about the latter, not even that it was a simulation. Both simulations, which students used in succession, allowed users to change the number and types of objects, and to move them freely on the screen. We told students that the problem was to describe and explain what occurred on the screen, and asked them to explain, while they were working with the simulation, what they observed, what they did and why. We conducted a first, quantitative analysis of various “surface” indicators that can be related to patterns or strategies: computer-generated traces of significant events, including user interaction; users’ operations (meaningful sequences of actions); basic characteristics and factual content of students’ verbalizations. We found significant differences between the two simulations for a number of indicators, which are being used as guides in the next part of the study: an in-depth analysis of students’ strategies.
KEYWORDS
Problem solving, simulations, strategies INTRODUCTION
There has been a long-standing debate over the relevance, or even the sheer existence of generic or (domain-independent) problem-solving skills and strategies ever since the notion was introduced in the work of Newell and Simon (1972). Most ensuing studies which didn’t dismiss the notion altogether questioned the possibility that learners acquire general problem-solving competencies which would enable them to apply these skills and strategies in various domains or contexts (Mayer & Wittrock, 1996; 2006; Taconis, Ferguson-Hessler & Broekkamp, 2001). Note that these strategies include not only procedures, which are arguably often discipline- or context-based, but also self-regulation activities related to metacognition and motivation (Adams & Wieman, 2007; O’Neil, 1999), more prone to transfer between disciplines, contexts, or problem types.
While many studies relied upon standard, well defined problems (the game “Tower of Hanoi” being one of the favourites), other used more open-ended situations in which problems may be ill-defined. This was often obtained through computer environments including simulations (Tennyson & Breuer, 2002), microworlds (Rieber, 2004), virtual laboratories (Meisner & Hoffman, 2005), or computer games (de Castell & Jenson, 2007; Sauvé, Renaud, Kaufman & Marquis, 2007). These are the same computer tools as the ones used for research on inquiry (de Jong, 2006; Reid, Zhang & Chen, 2003; van Joolingen, de Jong & Dimitrakopoulos, 2007) and problem-based learning (Lehti, Lehtinen &
Murtonen, 2005; Maxwell, Mergendoller & Bellisimo, 2004; Rendas, Rosado Pinto & Gamboa, 1999; Soderberg & Price, 2003).
Most simulations used in education, whether or not specifically designed as learning tools, depict natural phenomena and, as they generally aim at teaching a subject matter instead of generic problem-solving skills, they are based upon discipline-specific knowledge, namely models, laws, and theories. These simulations are thus not very useful to study or assess generic problem-solving skills; as Adams and Wieman (2007) rightly point out, “student’s content knowledge is inextricably intertwined within these skills”.
Although a handful of studies used so-called “domain-independent” or “content-free” simulations (Anderson, 1982; Kluge, 2008; Moher, Johnson, Cho & Lin, 2001; Szumal, 1999) or other tools (Adams & Wieman, 2007; English, 1992), there has been no systematic approach to the issue of the educational potential of these non-disciplinary learning tools.
To investigate how discipline-based content knowledge (taken here in a very broad meaning, which includes even scientific misconceptions) interfere with the expression or generic skills, especially those involved in planning and conducting effective problem-solving strategies, we designed two structurally similar computer animations and used them in an experimental study with undergraduate students from all domains. These simulations were based in large part upon a set of simulations previously developed in a less controlled research context (Couture & Meyor, 2008).
THE SIMULATIONS
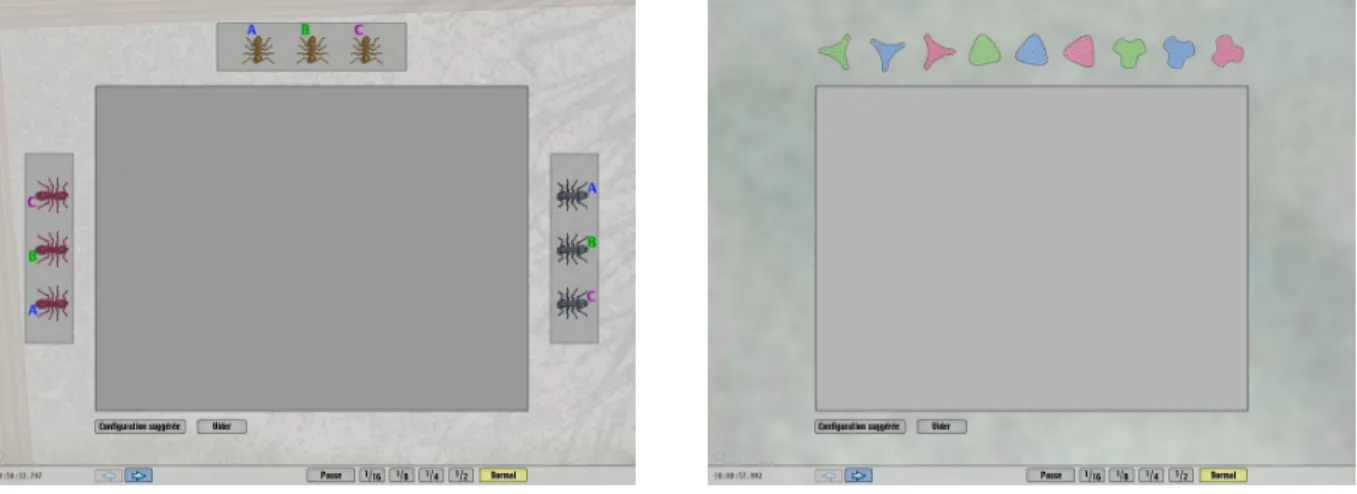
The first simulation, named simAnts, features in its “problem screen” (Figure 1) three species of ants differing by their color and shape and sharing a common territory which extends outside the screen. Although it is not a “real” disciplinary simulation, as it was designed by the author, who has no formal training in entomology, it is based upon actual research results regarding the allocation of tasks between ants. Inside each species, identical-looking ants perform any of three possible tasks, and any may switch to a new task as a result of its encounters with same-species ants; the probability of such a change is related to the number of same-species ants previously encountered that were actually performing this task. The ants’ motion was empirically designed to look like what the author could easily observe in his backyard.
For the sake of the simulation, ants performing a given task are said to be part of the same category. The categories are related to the area covered by moving ants: those of the first one travel far and fast, going constantly out of the screen and back, while the others stay inside, ants of one category criss-crossing all over the screen and the other remaining in a small part of it. To make the observations more tractable, considering the short duration of the experimental session, a letter (A, B or C), following each ant, indicates its category; it flashes for a few seconds when the category changes.
The second simulation (problem screen shown in Figure 2), which will heretofore be called Things, presents three types of abstract moving objects, each in three different color versions. Following an encounter between two same-shape objects, the color of one or both may change. Objects’ shapes and motions are defined by simple mathematical rules, with a single parameter accounting for the different shapes or trajectories. As these three abstract shapes are very difficult to name, we added to each a unique, simple geometrical pattern (dots, lines or squares). Here, the probability of color change is a constant, different for same- and different-color encounters; the new color is also fixed, each color changing to the next in a circular chain. Like before, the category (color) is related to differences in covered area.
Figure 2. The problem screen of the non-disciplinary simulation, showing the three species (distinguished by their shapes/patterns) and three categories (red, green, blue) of entities.
So one can say that the two simulations are structurally similar, as they both feature a 3 × 3 matrix of species and categories, with the category, related to territory covering, changing (or not) as a result of an encounter between same-species entities. In both, entities can be moved freely on the screen, and the configuration (number of entities of each species and category), initially selected in the part of the interface named “configuration screen” (Figure 3), may be modified at any time by going back to that screen, which resets the simulation.
Figure 3. The configuration (start) screen of the two simulations. Users select the configuration they want to study in the problem screen
by dragging into the large rectangle as many entities as they wish of each species and category. The laws governing category change, along with other minor characteristics, were made intentionally different in the two simulations to lessen the possibility that participants, who used both in succession, conclude at the onset of the second session that “shapes are just ants in disguise”, and thus that they have already solved the problem. This design choice proved relevant: while many participants commented upon the similarities of the two simulations, all tried in the second session to solve the “new” problem on its own.
THE METHOD
Thirty-five participants were recruited for the experimental sessions. In order to avoid biases and to make the “sample” as representative as possible of the target population (Quebec’s undergraduates), we advertised the study online and controlled the participants on the basis of gender and domains of study: arts, social sciences, business, science (general) and computer science.
We had to drop the results of five participants: four due to a bug in one of the simulations which we thought could significantly influence the strategies, the other because of difficulties she had in understanding the task. All 30 remaining participants used both simulations in a cross-over design, 15 of them starting with the ants. Each of the two sessions lasted 40 min, with a 10-min pause, but participants could end the session when they thought they “were through”. Only two did so, in the first session only, both after about 30 min.
Before each session, we showed participants the functional characteristics of the simulation, then asked them to do some simple actions, like selecting entities and dragging them on the screen. Before the “ant” session, participants were also invited to read a web page featuring pictures of simulated ants and their real counterparts and describing the simulation as research-based and used in biology courses. By contrast, we restricted the explanation of the non-disciplinary simulation to its functional characteristics, using carefully chosen, neutral words (like “entities”) to avoid any hint as to its nature or purpose. In both sessions, we told students that the problem was “to describe and explain verbally what occurred in the problem screen” We also asked them to explain, while they were working with the simulation, what they observed, what they did and why.
Participants were also offered a pad and pencil in case they “wanted to take notes”, which 20 of them did.
We felt that experimentations and explanations related to category change would constitute the richest part of the study. However, we had observed early in the validation phase that there was a real risk that a participant’s choice of configurations resulted in category changes occurring very late in the session, if at all. Thus we (1) included in the configuration screen a button placing a “suggested configuration” with 15 entities and (2) made sure participants realized during the demonstration that a category not included in the configuration we had selected would appear at some time in the problem screen.
All along the session, participants were recorded on video; the screen content was also captured. Furthermore, the simulations generated a timed record of all category changes and details of relevant user actions: selecting a configuration, dragging entities, slowing/accelerating the simulation. The interviewer stood next to the participants for the entire sessions; he or she asked questions for specific purposes: (1) clarifying the participants’ wording (2) reminding them to explain what they were doing. DATA TREATMENT AND ANALYSIS
The complete utterances were transcribed. As we didn’t ask participants to speak aloud all their thoughts (as in type I verbalization), there was huge differences between participants in the number of words per session: it ranged from 300 to 3500, with a mean/median of about 2000. The difference between the simulations was less than 1 %.
Each session was divided into scenes, corresponding to an observation/experimentation period with the same configuration; a section could comprise a single or many takes, when the participant went from the problem screen to the configuration screen and back with the same configuration. Each take (or single-take scene) was divided into two parts: preparation and experimentation, when the participant works (or talks) in the configuration and problem screens, respectively.
In a first stage of analysis, more prone to statistical treatment, we considered elementary speech and behaviour units. The transcripts were divided into short speech units, each containing the description of a single observation, a statement about a characteristic, or a relation between two or more observations or characteristics. Some longer units contained more complex or general reasoning. The range in unit count was similar to that of the word count: 15 to 225 units; mean 80; difference of less than 1 % between simulations.
Each speech unit was coded as to (1) the subject(s) of the utterance, for instance an element or a characteristic of the simulation, the problem, or the participant himself or herself; and (2) some characteristics deemed relevant for the subsequent analysis of the strategies:
• the unit is a simple factual description of something just happening on the screen; • the unit expresses a judgment or an evaluation;
• the unit includes a model, defined as an explanation referring to something which is not part of the observable phenomena;
• the unit includes a recall, a comparison, or an announcement of future actions; • the wording expresses doubt or uncertainty.
Behaviour units, called actions, were also coded in the same table; some codes, like the detail of the selected configurations, were directly obtained from the simulation-generated records; others, like note taking or the type (or purpose) of entity dragging, were manually coded upon observation of the screen capture and video recording.
After a first joint work on a sample of session transcripts to stabilize the codes, unit coding was done by the author or an assistant, and validated by one of the assistants or the author; a maximum of 10 % of
the codes were modified at the validation stage. We ended up with 25 subject, 8 characteristics and a dozen action codes. Subject coding gave us a further criterion for unit splitting: when more than four subject codes were needed, a unit was split into two shorter ones.
These codes were used to generate a number of indicators. Some were simply the “raw” codes, for instance: the number of entities dragged to force or favour encounters; the number of speech units mentioning or describing a model. Others were defined through simple calculation: for instance: mean number of entities; percentage of speech units tagged with the code for “speed of entity”.
Using Excel’s statistical package and custom formulae, various statistical data were computed for all 100+ indicators: mean, median, mean difference between the simulations or the sessions. Various statistical tests were also run: t-tests (paired and unpaired) and a non-parametric test (Wilcoxon signed-rank) on the means; confidence intervals for the differences in the means. Graphs (scatterplots, boxplots and histograms) were also produced for every indicator.
For all indicators, we carefully reviewed the results of the various statistical tests, using the graphical representations of the data to detect any characteristic or anomaly that could help interpret or validate these results. We were interested in finding indicators (1) which could provide an overall view of the participants’ behaviours or (2) reveal relevant and, ideally, statistically significant differences between the means of the two simulations.
Table 1 shows these results for a few indicators, called action indicators, related to the way participants interacted with the simulations. One observes a tremendous disparity between participants for all these indicators. Some participants worked with one or two entities at a time; others preferred a more crowded screen. Some spent as much as one fourth of the total time in the configuration screen, others less than 2 %. Some participants used a unique configuration in a session, others tested dozens; without surprise, this indicator was well correlated to the previous one, especially for the non-disciplinary simulation (R2 = 0.48). Many participants dragged very few or no entity at all in the problem screen during their two sessions; others dragged several hundred during each. Some participants never paused or changed the rate of the simulation, while others used that feature extensively, mainly to facilitate observation or note taking.
Finally, two of the action indicators revealed a statistically significant difference between simulations over the 20 % threshold we have fixed as worth investigating: number of scenes and number of entities dragged. Due to its peculiar, long-tailed distribution, the latter was log-transformed after elimination of the 5 participants who had not used this feature at all. Note that the original values gave a much larger difference in means, with a p value (obtained from Wilcoxon signed-rank test) of just over 0.05.
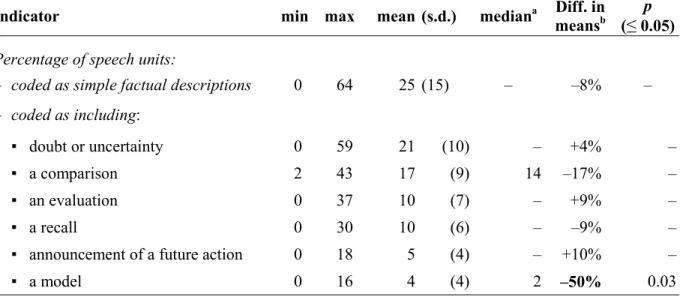
Table 2 gives an overview of the characteristics of participants’ utterances. Again, huge individual differences are observed for many indicators, and significant differences in the means are found in two of them: comparisons and models.
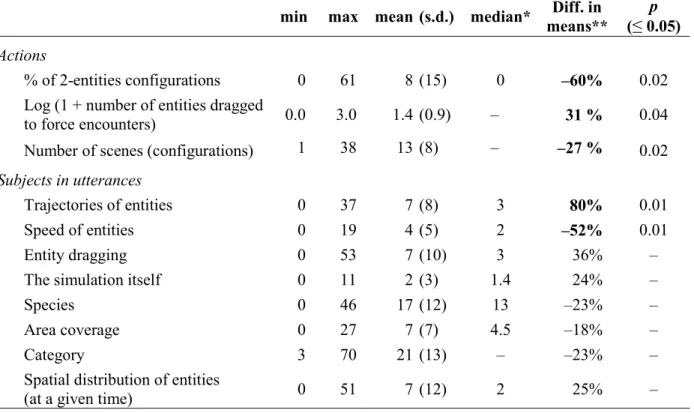
Finally, Table 3 presents all action or speech unit codes (including some already displayed in Table 1) for which a difference of 20 % or more between simulations (statistically significant or not) is observed.
Table 1. Main characteristics of the distribution
and difference in means between simulations for some relevant action indicators. Indicator min max mean (s.d.) mediana Diff. in
meansb (
≤
0.05) pMean number of entities in
participant-selected configurations 1.6 15 6.6 (3.0) – +17 % – Percentage of time devoted to
“preparation” (configuration screen) 1 34 14 (8) – –16 % – Number of scenes (configurations) 1 38 13 (8) – –27 % 0.02 Number of entities dragged to force
encounters 0 985 89 (175) 16 +116 % 0.05
Number of modifications of rate of
simulation 0.0 80 16 (18) 10 –27 % –
Log (1 + number of entities dragged to
force encounters) 0.0 3.0 1.4 (0.9) – 31 % 0.045
a. If more than 10 % different from mean. b. Things minus simAnts.
Table 2. Characteristics of the distribution and difference in means between simulations for all speech unit characteristics indicators.
Indicator min max mean (s.d.) mediana Diff. in
meansb (
≤
0.05) pPercentage of speech units:
– coded as simple factual descriptions 0 64 25 (15) – –8% – – coded as including:
▪ doubt or uncertainty 0 59 21 (10) – +4% –
▪ a comparison 2 43 17 (9) 14 –17% –
▪ an evaluation 0 37 10 (7) – +9% –
▪ a recall 0 30 10 (6) – –9% –
▪ announcement of a future action 0 18 5 (4) – +10% –
▪ a model 0 16 4 (4) 2 –50% 0.03
a. If more than 10 % different from mean. b. Things minus simAnts.
Table 3. Characteristics of the distribution for all indicators with at least 20 % difference in means between simulations.
min max mean (s.d.) median* Diff. in means** (
≤
0.05) pActions
% of 2-entities configurations 0 61 8 (15) 0 –60% 0.02
Log (1 + number of entities dragged
to force encounters) 0.0 3.0 1.4 (0.9) – 31 % 0.04
Number of scenes (configurations) 1 38 13 (8) – –27 % 0.02
Subjects in utterances
Trajectories of entities 0 37 7 (8) 3 80% 0.01
Speed of entities 0 19 4 (5) 2 –52% 0.01
Entity dragging 0 53 7 (10) 3 36% –
The simulation itself 0 11 2 (3) 1.4 24% –
Species 0 46 17 (12) 13 –23% –
Area coverage 0 27 7 (7) 4.5 –18% –
Category 3 70 21 (13) – –23% –
Spatial distribution of entities
(at a given time) 0 51 7 (12) 2 25% –
a. If more than 10 % different from mean. b. Things minus simAnts.
DISCUSSION
Even if all the indicators of our “surface” analysis cover a huge spectrum, a number of them show a significant difference between the two simulations. Some of these indicators can arguably be related to differences in problem-solving strategies: for instance, the number of configurations tested, the number of configurations with two entities, the number of entities dragged to force encounters, the percentage of speech units including a mention of a model. Also, indicators like “trajectories of entities”, “speed of entities”, “area coverage” and “spatial distribution of entities” could be related to prior conceptions about ants. These could make some issues simply not judged worth pursuing (everybody knows how an ant “walks”, so there is nothing to study here), while stressing the importance of others (“territories” are important in many animal species).
However, it is hard to reach any solid conclusion on this sole basis. Notably, one has to make sure that a difference is really due to the disciplinary nature of the simulation, and not to some practical differences in their functioning, as they were not completely identical. For instance, the difference in number of scenes (configurations) could reveal a difference in the way of experimenting, but it could also be due to the fact that it takes more time in one of the simulation, with the same configuration, to observe the number of events required to take the decision to stop observing and try another configuration. An in-depth analysis, not restricted to elementary units, is thus required.
students’ behaviour and utterances reveals significant differences between the two simulations for a number of indicators which can be related to problem-solving skills and strategies.
An in-depth analysis taking these indicators as guides to pinpoint fruitful areas of investigation has been undertaken. At the time of this writing, it is still in its early stages.
ACKNOWLEGDMENTS
The author whises to thank the following assistants who worked on this project: Chiara Cavalli, Fethi Guerdelli, and Sabrina Suffren. This work was funded by the Canadian Social Sciences and Humanities Research Council.
REFERENCES
Adams, W. K., & Wieman, C. E. (2007). Problem solving skill evaluation instrument – Validation
studies. In L. McCullough, L. Hsu, & P. Heron (Eds.), AIP Conference Proceedings, vol. 883 (2006
Physics Education Research Conference) (pp. 18-21).
Anderson, D. E. (1982). Computer simulations in the psychology laboratory. Simulation & Gaming, 13,
13-36.
Couture M., & Meyor, C. (2008). Simulations informatiques adisciplinaires et résolution de problèmes
ouverts : une étude exploratoire auprès d’étudiants en formation des maîtres. Revue internationale des
technologies en pédagogie universitaire / International Journal of Technologies in Higher Education,
5(2), 50-67.
de Castell, S., & Jenson, J. (2007). Digital games for education: When meanings play. Intermedialities, 9,
113-132.
de Jong, T. (2006). Technological advances in inquiry learning. Science, 312(5773), 532-533.
English, L. D. (1992, April). Children’s use of domain-specific knowledge and domain-general
strategies in novel problem solving. Paper presented at the American Educational Research Association
(AERA) annual conference (San Francisco, CA).
Kluge, A. (2008). Performance assessments with microworlds and their difficulty. Applied Psychological
Measurement, 32(2), 156-180.
Lehti, S., Lehtinen, E., & Mari, M. (2005). Computer-supported problem-based learning in the research
methodology domain. Scandinavian Journal of Educational Research, 49(3), 297-323.
Maxwell, N. L., Mergendoller, J. R., & Bellisimo, Y. (2004). Developing a problem-based learning
simulation: An economics unit on trade. Simulation & Gaming, 35(4), 488-498.
Mayer, R. E., & Wittrock, M. C. (1996). Problem-solving transfer. In D. C. Berliner & R. C. Calfee
(Eds.), Handbook of educational psychology (pp. 47-62). New York: Simon & Schuster Macmillan.
Mayer, R. E., & Wittrock, M. (2006). Problem Solving. In P. A. Alexander & P. H. Winne (Ed.),
Handbook of Educational Psychology (2nd ed.) (pp. 287-303). Mahwah, NJ: Lawrence Erlbaum.
Meisner, G., & Hoffman, H. (2005). Virtual interactive laboratories and e-learning. In G. Richards (Ed.),
Proceedings of World Conference on E-Learning in Corporate, Government, Healthcare, and Higher
Education 2005 (pp. 120-127). Chesapeake, VA: AACE.
Moher, T., Johnson, A., Cho, Y., Lin, Y. (2001). First person science inquiry ‘in the field’. In
Proceedings of the Joint Immersive Projection Technology / EUROGRAPHICS Workshop on Virtual
Environments [IPT/EGVE 2001] (pp. 131-140), Stuttgart, Germany: Springer.
Newell, A., & Simon H. A. (1972). Human problem solving. Englewood Cliffs, N.J.: Prentice-Hall.
O’Neil, H. F. Jr. (1999). Perspectives on computer-based performance assessment of problem solving.
Computers in Human Behavior, 15(3-4), 255-268.
Reid, D. J.; Zhang, J.; Chen, Q. (2003). Supporting scientific discovery learning in a simulation
environment. Journal of Computer Assisted Learning, 19(1), 9-20.
Rendas, A., Rosado Pinto, P., & Gamboa, T. (1999). A computer simulation designed for problem-based
learning. Medical Education, 33(1), 47-54.
Rieber, L. P. (2004). Microworlds. In D. H. Jonassen (Ed.), Handbook of research on educational
communications and technology (2nd ed.) (pp. 583-603). Mahwah, NJ: Lawrence Erlbaum.
Sauvé, L., Renaud, L., Kaufman, D., & Marquis, J. S. (2007). Distinguishing between games and
simulations: A systematic review. Educational Technology & Society, 10(3), 247-256.
Soderberg, P, & Price, F. (2003) An examination of problem-based teaching and learning in population
genetics and evolution using EVOLVE, a computer simulation. International Journal of Science
Education, 25(1), 35-55.
Szumal, J. L. (1999), How to use group problem solving simulations to improve teamwork. In M.
Silberman (Ed.), Team and organization development sourcebook. New York: McGraw-Hill.
Taconis, R., Ferguson-Hessler, M. G. M., & Broekkamp H. (2001). Teaching science problem solving:
An overview of experimental work. Journal of Research in Science Teaching, 38(4), 442-468.
Tennyson, R. D., & Breuer, K. (2002). Improving problem solving and creativity through use of
complex-dynamic simulations. Computers in Human Behavior, 18(6), 650(18).
van Joolingen, W. R., de Jong, T., & Dimitrakopoulos, A. (2007). Issues in computer supported inquiry
learning in science. Journal of Computer Assisted Learning, 23, 111-120.
Marc Couture Professor
UER Science et Technologie Télé-université