O
pen
A
rchive
T
OULOUSE
A
rchive
O
uverte (
OATAO
)
OATAO is an open access repository that collects the work of Toulouse researchers and
makes it freely available over the web where possible.
This is an author-deposited version published in :
http://oatao.univ-toulouse.fr/
Eprints ID : 11708
To cite this version : Dutrieux, Eric and Proisy, Christophe and
Fromard, François and Walcker, Romain and Ilman, Muhammad and
Pawlowski, Frédéric and Ferdiansyah, Henry and Ponthieux, Olivier
Mangrove Restoration in the Vicinity of Oil and Gas Facilities:
Lessons Learned From a Large-Scale Project. (2014) In: SPE
International Conference on Health, Safety, and Environment, 17
March 2014 - 19 March 2014 (Long Beach, United States).
Any correspondance concerning this service should be sent to the repository
administrator:
staff-oatao@listes-diff.inp-toulouse.fr
Mangrove Restoration in the Vicinity of Oil and Gas Facilities: Lessons
Learned from a Large Scale Project
Eric Dutrieux, Creocean; Christophe Proisy, IRD (Institut de Recherche pour le Développement); François Fromard & Romain Walcker, Centre National de la Recherche Scientifique; Muhammad ILMAN; Frédéric Pawlowski,
Ecomed; Henry Ferdansiah, Total E&P Indonesie; Olivier Ponthieux, Total
Abstract
Mangroves are critical ecosystems given their key role in conserving biodiversity, protecting coastlines from erosion and supporting coastal resources. They may be impacted by oil and gas activities, either directly or indirectly. Restoring them is therefore of prime importance. In the Mahakam Delta (East Kalimantan, Indonesia), oil and gas exploration and production have been conducted for more than 40 years. This industry has operated in a quasi-pristine area barely affected by human activities until the mid 80’s. Toward the late 1980’s and until 2000, the delta was subject to massive and rapid development of shrimp farming and by 2001, 80% of the delta mangroves were destroyed and most of it replaced by ponds used for aquaculture. During the 2000’s, shrimp production in the delta decreased due to lack of nutrients in ponds, and a drop in shrimp value due to the rise of imports worldwide. Numerous ponds were abandoned in the delta. This economic situation generated social instabilities that could threaten the oil and gas industry in the region. Therefore, in order to better protect mangroves and optimize restoration of damaged areas, Total E&P Indonesie embarked on a mangrove restoration initiative of the Mahakam Delta aimed at understanding and contributing to the restoration processes through both natural recolonization and planting techniques. The general methodology implemented has been to i) describe the land cover using satellite imagery, interpreting aerial photos, conducting field work, and establishing GIS maps, ii) inventory the fauna and flora (including mangroves, birds, mammals, reptiles), iii) monitoring the naturally re-colonized areas, replanted areas and original forest in selected areas. Results show that natural recolonization of a mangrove area can be very quick under certain conditions (subject to availability of seeds and easy access of seeds to the area to be recolonized). But in areas where seeds cannot easily move, or where seed supply is scarce, replanting remains the best option. Social aspects have also to be taken into account given that replanting can promote the local commitment to sustainable environmental conservation. This paper details the methodology, presents scientific results and discusses lessons learned.
Introduction
Mangroves can be defined as an association of trees and shrubs forming the dominant vegetation in tidal, saline wetlands, along equatorial, tropical and subtropical coasts (Tomlinson 1986, Ricklefs and Schluter 1993). Mangroves are important coastal ecosystems. They can protect shorelines, store carbon, facilate the trophic chains and be directly linked to coastal fisheries (Odum and Heald 1975, Lugo et al. 1980, Snedaker et al. 1998, Saenger 2002). Several authors and international organisations have demonstrated their ecological, social, cultural and economical values (Field 1996). Today, the ecological and economic roles of mangrove ecosystems are widely recognized (Primavera 1998; Ewell et al. 1998; Valiela et al 2001; Saenger 2002). For instance, under natural conditions, 1 ha of mangrove forest supports an average sustainable shrimp production about 350 kg ha-1.yr-1 (Hambrey 1996, De Graaf and Xuan 1998).
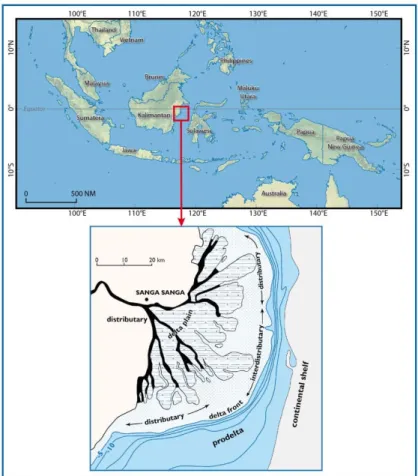
Indonesia is the world's greatest mangrove nation with about 30,000 square kilometres of mangrove forests (Spalding et al. 2010) and one of the highest biodiversities in mangrove trees. As these ecosystems develop best in tropical and equatorial estuaries receiving heavy rainfall evenly distributed throughout the year (e.g., Ganges, Amazon, Orinoco, Niger), the delta of the Mahakam located in Indonesia (Figure 1) (East Kalimantan, Borneo island, 0°21’-1°10’S and 117°15’-117°40’ E) is one of
the most suitable sites for natural mangrove development. Before the early eighties, the Mahakam Delta was practically unaltered by anthropogenic activities (Dutrieux, 1989; Dutrieux et al., 1990; Dutrieux, 1991). The fate of these mangroves suddenly changed during the early nineties with the beginning of the conversion of these wetlands to shrimp farms. By 1999, over half of the mangrove forests of the delta were clear felled or already converted to shrimp ponds. The extremely rapid and chaotic degradation occurred without any governmental control in the Mahakam Delta. Such degradation was also simultaneously recorded in south Sumatra and on other Indonesian islands (Wolanski et al. 2000). By 2001, the total mangrove area destroyed reached 75,000 ha, almost 80% of the total surface of the delta.
Here we present the results of a three year long Research and Development project, the purposes of which were to describe the status of the delta in terms of vegetation cover changes (including natural colonization in shrimp ponds, success/failure of re-plantations, decay processes, natural regeneration on newly formed mud or sand banks), plant species composition, forest structure, and avifaunal composition. During the course of the project we could also assess the natural and human-generated processes conducive to restoration. Knowledge of restoration processes within the Mahakam Delta could likely be applied to habitats facing similar challenges. The basis of the work was an update of an existing biological database (Sulistiyono et al., 1998; Creocean/Sce, 2001) and an interpretation of vegetation changes.
Study site - Previous research
Main factors that shaped the current status of the Mahakam Delta are the geomorphology, hydrology, primary productivity of mangrove forests, and socio-economics. A general account of physico-chemical parameters is given by Allen et al. (1979) and some broad ecological features are reported in Soemodihardjo et al., (1993). Neither bioclimatic factors nor soil conditions limit the luxuriant mangrove development in the Mahakam Delta. Prevailing ecological conditions of the delta are those of moist equatorial climates, with a mean annual rainfall exceeding 2,000 mm. The fan-shaped Mahakam Delta is of the "tide dominated allochthonous" type following the Thom (1982) classification scheme.
The catchment area of the Mahakam River is about 75,000 km2 with a flow approximately 1,500 m3 s-1 (Allen et al., 1979). The total surface of the delta is about 5,000 km² part of which is submerged, including the prodelta (2,700 km²), a delta front, shallow at low tide and devoid of vegetation (1,000 km²), and a delta plain over which the mangrove develops. This floodplain, which encompasses mainly an intertidal area, covers a 1,300 km² area including 300 km² of channels. The mean tidal amplitude is about 2.5 m. The delta can be arbitrarily divided into three major parts. In the southern and the northern parts, distributary channels facilitate the Mahakam River flow, which produces a high renewal rate of its water. In the center of the delta, an inter-distributary zone is crisscrossed by numerous tidal channels which are not directly connected to the main river, but play an essential role in draining huge quantities of brackish water that accumulate in the floodplain. The constant interplay between marine water and freshwater discharge from the main river generates a complex salinity gradient.
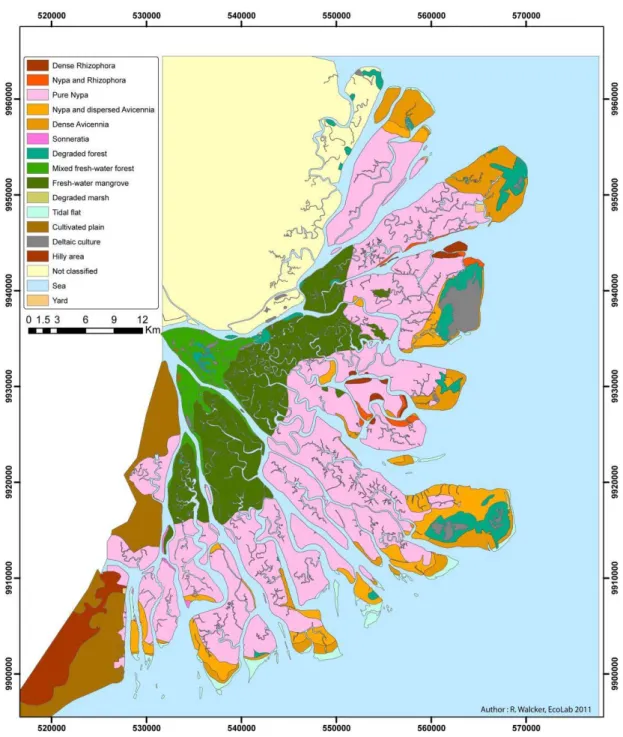
As described in Dutrieux (1991), there are several zones within the delta: a peripheral area, with a rather stable salinity, varying between 20 and 35‰; a central zone, with highly variable salinities (5 to 25 ‰) (salinity measurements in the water column or in sediment pore water ?, where the majority of the marine and fresh water masses merge; and an upstream zone, where salinity usually varies between almost fresh water to about 10 ‰. Further upstream, the marine influence is almost indiscernible. A dense network of natural channels creates numerous islets that constitute the delta plain sensu stricto. Most of them are located in the inter-tidal zone. Prior to 1990, these islets were covered by dense mangroves forests (about 1,000 km²). A vegetation map of the delta published in 1990 (Dutrieux et al. 1990), which was revised a few years later (Dutrieux et al., 1996; Gayte and Dutrieux, 1996), shows that the various vegetation zones and plant communities, distinguishable by their structural properties and floristic composition, match hydrological features (Figure 2). The peripheral zone, located at the mouth of the river, is covered by large stretches of Avicennia spp. communities, either as monogeneric stands, or mixed with other species such as the landward Nypa fruticans palm vegetation. In the interdistributary zone, Rhizophora spp. is scarce, related or unrelated to Avicennia spp., indicating a sufficiently constant salinity in an area hardly affected by the voluminous freshwater discharge. The associated fauna is noticeably rich as exemplified by the 30 species and 17 families of avifauna (Eve and Guigue, 1989). Parts of the two major islands have a slightly higher topography with some areas remaining permanently dry. Coconut trees have been grown in these areas for decades. These areas are also partly covered with salt marshes and degraded mangrove, where the fern Acrostichum aureum is dominant.
The central zone of the delta was occupied by an extended monospecific community of N. fruticans palm vegetation with a 580 km² cover. The extent of this low diversity formation, was probably related to the great amplitude of salinity (5 to 25‰). Here, the avifauna is conspicuously poor (6 species) according to Eve and Guigue (1989). Upstream, Nypa communities were mixed along riverbanks and/or gradually replaced by dicotyledons (Bruguiera sp., Heritiera littoralis, Cerbera manghas) and monocotyledons (i.e. the palm tree Oncosperma tigillarum) less tolerant to elevated salinity. These transitional communities, between mangroves and freshwater swamp forests, were found in areas where salinity ranges between 0 and 5‰. At the apex of the delta, salinity was very low and most of this area was not flooded at high tide. This area hosted the same species as in the transitional communities, along with freshwater species such as the Livingstonia sp. and riparian vegetation in which
Pandanus sp., Hibiscus tiliaceus, Thespesia populnea., Aglaia cucullata,and Gluta renghas were dominant. Some degraded
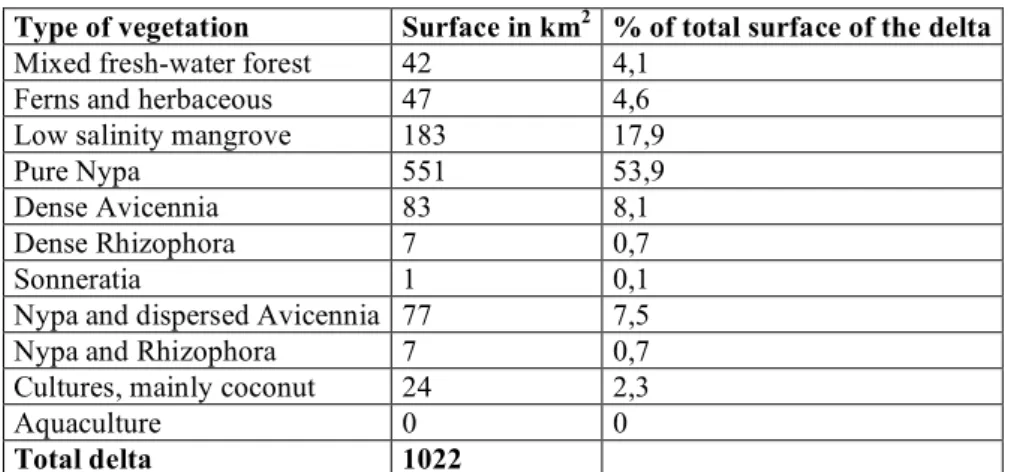
secondary grassy types and some paddy fields also occurred in this area, particularly along channels and water ways. Coverage of each category of vegetation is presented in Table 1.
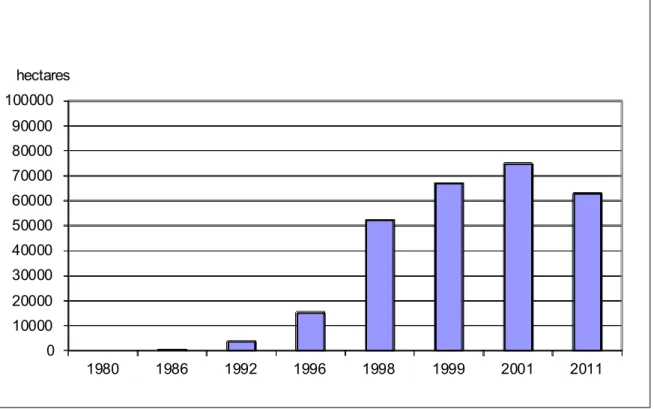
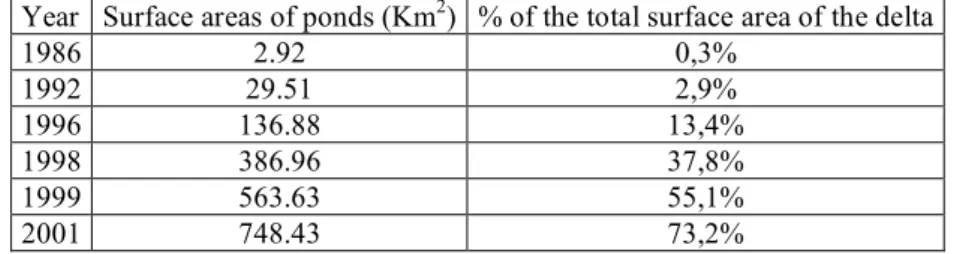
Between 1986 and 2001, aquaculture caused a dramatic increase in the clearing of vegetated areas and damaged vegetation (Dutrieux, 2001). Table 2 presents the amount of clearing as a function of time. The clearing was exponential between 1992 and 1996 and plateaued thereafter. Each category of vegetation was impacted in a different way. Table 3 shows the percentage of deforestation by type of vegetation as a function of time. In 2002, all areas significantly influenced by saline waters were occupied by aquaculture ponds (Creocean, 2002). A 750 km2 area was deforested which corresponded to almost 80% of the total surface of the delta. Areas that were rich with Avicennia and Rhizophora were nearly completely destroyed while the less diversified Nypa zones disappeared. The low salinity mangrove is now partly deforested while the freshwater forest is still preserved from aquaculture development. Maps in figure 3 illustrate the extension of the deforested areas through the years. In parallel with aquaculture development, there was significant oil and gas activity particularly during early 2000 resulting from the installation of a cluster of wells. Some of the installations took place in the water area of the delta and others inside the mangrove area. These clusters are linked together and to remote wells by pipes. A given pipe installed on land causes the clearing of a corridor that is 20 to 30 m wide in the vicinity of a given installation. As part of its commitment to restore these deforested areas, Total E&P Indonesie has implemented a large replantation programme since 2000.
Materials and methods
We assessed changes of land and vegetation cover using cartographic methods based on satellite imagery, terrestrial and aerial surveys, and local environmental knowledge and data. We examined the structure and species composition of the mangrove forest to distinguish pristine areas from locations altered by human activities. The update of the existing biological data base was done by conducting inventories of flora and fauna.
Vegetation cover
The spatial distribution of mangroves over the whole Mahakam delta was investigated using satellite images and validated by site surveys. This allowed comparison with GIS maps produced for Total E&P Indonesie before 2010. Digital mapping required the use recent satellite images. We selected a scene from the AVNIR (Advanced Visible and Near Infrared) instrument acquired in May 2010. This image from the satellite ALOS, covers the entire delta. Clouds are present in the more distal part of the delta and onland leaving the northern part with a quite good cloud-free view. Consequently almost 75% of the delta could be observed. We could extract vegetated and water surface using the green to very near infrared (NeIR) spectral bands , but the medium pixel resolution (10m) proved to be quite restrictive considering the mean dimension of ponds. The AVNIR images were not adapted to adjust and correct the pond and Right of Ways GIS layers and could not be considered as a reference data for ortho-rectification.
With four TerraSAR satellite radar images we could obtain a cloud-free view of the entire Mahakam Delta. The radar instrument of TerraSAR operated in the X-band (9,65 Ghz – 3cm) and had several acquisition modes and related products. We chose the strip-map acquisition mode providing a ground resolution of 1.25m. The dates of acquisition ranged between 22 June and 14 July 2010, close to a month after the AVNIR image was taken. The SAR images were orthorectified using satellite metadata assuming the absence of relief. We also verified the final geometry using the SRTM Digital Elevation Model (90m). The AVNIR images were projected using the SAR image as a geographic reference. We used the UTM50S system with WGS84 datum for final projection of images in the metric system.
Using both optical and radar datasets, we mapped vegetation and mangroves distibution at a 1/10000 scale. This distribution is representative of 2010. The generated maps allowed to plan ground truthing, an important validation step of our interpretation before producing final maps.
A 10-day field survey included onwater, onland, and aerial observations. For each day trip and route several target areas were selected by comparing 1999 and 2010 maps with a focus on specific topics such as replantation/deforestation, shrimp ponds that were abandoned or being developed, and areas undergoing accretion or abrasion. The field effort was concentrated in the downstream areas, the primary areas of interest of this study. We used computer-assisted GPS navigation and recorded survey routes.
For each survey area, we gathered data on the flora, took photographs, and interviewed members of the local community including fishermen, villagers, and fishermen at shrimp ponds. We could answer the questions we raised during the interpretation of satellite images. During the fieldwork, we could also gather data available from Total E&P Indonesie such as geographical data on shrimp ponds.
Mangrove species composition and forest structure
For this project, a first inventory of the mangrove species was focused on the downstream area of the Mahakam Delta to concentrate on main areas of the delta impacted by anthropogenic activities. We identified mangrove species by boat within the middle and lower parts of the delta. Vegetation was assessed using rapid surveys conducted during stops at different places including riverbanks, shrimp ponds, replanted areas, and young to mature mangrove stands. In all, it was assessed nearly 50 sites. Yet due to the complexity of the study area, it is likely that our inventory and analyses of the flora were not comprehensive. Even so we believe to have observed most of the mangrove species and facies characterizing the Mahakam Delta.
Further to assess the physiognomy of mangrove forests, we conducted detailed forest inventories in areas ranging from abandoned shrimp ponds with evidence of natural mangrove (re)colonization to plantations areas and natural forests. All surveyed plantations consisted of Rhizophora spp. which resulted from initiatives by Total E&P Indonesie and/or local authorities. A total of eight sites were monitored from 27 January to 8 February 2013.
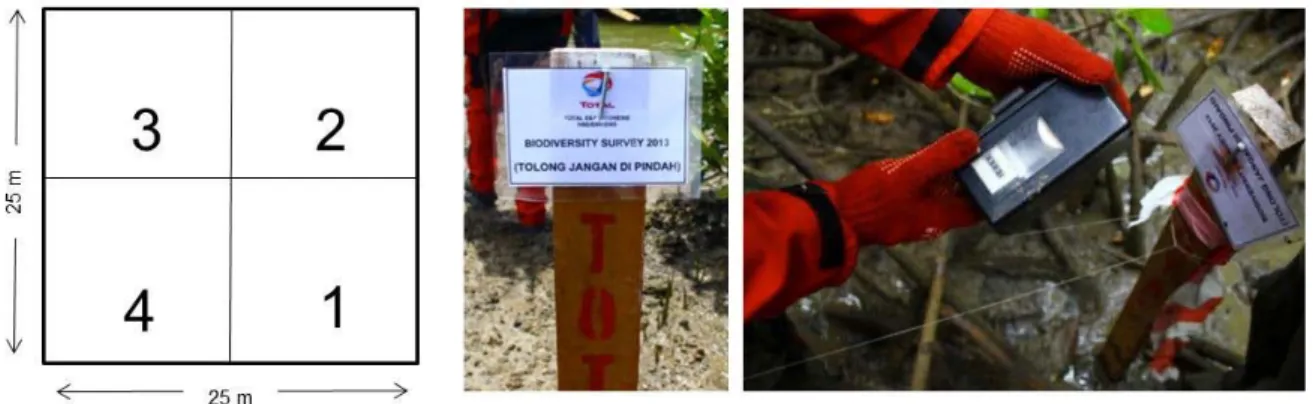
Each forest inventory included species identification, tree counting, measurement of diameter at breast height (noted hereafter DBH) for all living individuals (i.e., 130 cm above the ground or above the aerial roots for Rhizophora species) which are structural parameters of a mangrove forest, and evaluation of the salinity of upper mud layer and water. Observations and assessment of community structure were done using forest plots of 25 x 25 meters delineated using tape, stakes (left onsite for future surveys), and hand-held laser measurements (Figure 4). From DBH measurements, we computed the basal area of each plot as the sum of trunk sections per hectare (in m²/ha). Tree heights were also estimated using a graduated stake for pioneer mangrove individuals or using a hand held lasermeter for adult trees. Salinity was measured using a handheld refractometer. For Nypa formations, we described several palms (after cutting them) by counting number of leaves and measuring the diameter of the main axis at different heights. We also measured width, height, and insertion angles of the largest leaves. This forest dataset cannot be considered as sufficient for a complete overview of all the forest types found across the region. However, they clearly contrast plantations from natural vegetation.
Inventory of fauna
We examined bird population dynamics between 1987 and 2013. A baseline assessment of bird populations (primarily water birds) had been done in 1987 (Eve and Guigue, 1989) before the delta was altered by aquaculture. Birds are the best well-known group of animals of the delta and are arguably the easiest group of animals to use in order to monitor ecological change. Furthermore, there are relatively few bird species when compared with the number of invertebrates or fish. Birds are also more easily observed, monitored and identified than reptiles or mammals. Several inventory techniques can generate an overview of the bird populations in large areas at a low cost and with minimal human investment (e.g., Blondel, 1975; Bibby
et al., 2000; Borchers et al., 2004).
In 2013, observations were made from boat transects. Daily survey tracks and locations where observations were made were recorded using GPS. However, this surveying technique only allowed us to observe birds in flight, living on the banks or in trees along the edge of the river. At the same time, we took opportunities to record ponds and observations of monkeys and reptiles. Most of the time, the edges of the Nypa prevented us from observing birds living in the shrimp ponds. Yet, when we observed birds in these habitats, we could record and georeference the GPS location of the observation point. The team most often disembarked using farmers' pontoons and houses to reach shrimp ponds to observe birds. At each observation point we recorded the abundance of each species, and the age categories and behaviours in a standardised way following state of the art methodologies (Reynolds et al., 1980; Goldsmith, 1994; Braun, 2005). Birds were identified and counted and pictures taken to illustrate reports and help with further identification. When possible, the behaviour data (reproduction, feeding, transit) were noted as well as age categories (juvenile, immature, subadult and adult). Specific areas were targeted to be overflown by helicopter in order to take more pictures and make observations on the evolving mangrove cover. Considering the speed of flight of the helicopter (about 100 km/h) and the altitude (46 m), it was only possible to detect the largest or most easily detectable species (such as the Javan pond-heron).
Understanding the restoration processes – Analysis of scientific results Vegetation cover
Overall, all vegetation categories showed the same trend of increasing in cover with time, with the exception of the mixed freshwater forest which was probably in the process of being deforested. From the vegetation maps we could estimate the various types of land cover. The shrimp ponds were individually identified by digitizing the berms of each pond. In 2011, the total cover of shrimp ponds was 63,000 ha while the total footprint of Total E&P Indonesie within the delta was 2,760 ha representing slightly more than 4% of the total extension of cleared soils.
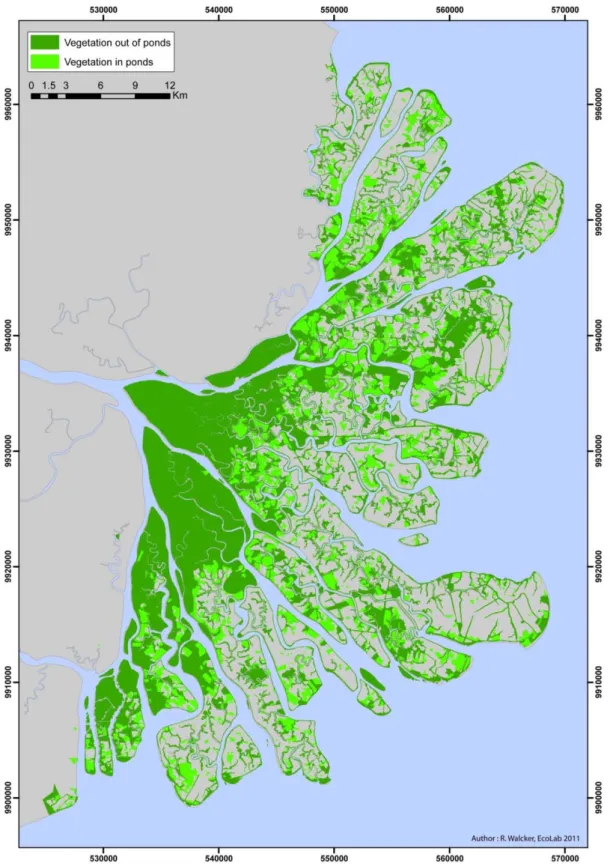
When the GIS layer of deforested areas (cleared soils) based on 2011 data (Figure 5) was overlain with the pre-1990 vegetation cover (see Figure 2), we found that 45,000 ha were occupied in 2011 either by original or secondary vegetation (i.e., re-growth following the initial deforestation). By overlaying the 2001 and pre-1990 data, we found a 27,000 ha vegetation cover. Hence, despite the growth of shrimp pond farming, many ponds were subject to reforestation over time. By superimposing the positions of the ponds on the original vegetation map, we could differentiate the vegetation outside of ponds (mostly original vegetation) from the vegetation inside of ponds (including vegetation not yet cut and secondary vegetation). The vegetation cover inside of ponds was about 18,000 ha including 7,000 ha of original vegetation (not yet deforested) and 11,000 ha of secondary vegetation (new colonized areas). Further by plotting replanted areas and natural secondary vegetation within the Total E&P Indonesie footprint we found that replanted areas were estimated at 620 ha. This was probably an underestimate of the actual total replanted area given the data on the Total E&P Indonesie plantation program (Bengen et al., 2012). The re-vegetation with Rhizophora in some places seems to provide favorable conditions for natural Avicennia to grow. In this case, the Avicennia normally will grow faster than the Rhizophora and create impression from outside that the areas are pure natural re-vegetation. Figure 5 shows the 2011 vegetation cover of the Mahakam Delta, and differentiates the remaining original vegetation from the secondary vegetation. Figure 6 shows how cleared areas evolved with time through 2011.
Plant diversity and forest physiognomy
We found that mangrove forests of the downstream area of the Mahakam Delta comprise 15 true mangrove species that dominate local plant communities, 6 less frequent species, and about 11 associated or introduced species. This inventory (see appendix 1 for the species list) compares favorably with previous surveys in other areas of the Mahakam Delta..
Data on forest structure and species composition collected at eight forest sites (Table 4) highlight some general trends in forest growth. Table 4 presents the growth stage and the vegetation type (natural versus planted). The first inventoried area (Plot #1) was a N. fruticans formation. The Nypa mangroves in the Mahakam Delta occur naturally, are very homogeneous and can cover large areas. Our data show that these palm trees reach 11 m in height with approximately 2,500 individuals per hectare. They are monospecific within the upstream area and occupy substrata of natural tall mangrove trees in the downstream area. We could not include the data obtained for the Nypa formation into the following analysis since DBH measurements were non significant.
We also assessed a juvenile Rhizophora mucronata plantation (Plot #2) which was growing on a site outside a shrimp pond area (we did not observe evidences of pond berms). The area was clearly and directly submerged during high tides. Data collected showed a dominant population of R. mucronata trees (84% of the basal area) but also, several Avicennia officinalis (16%) as natural regeneration. All trees were of about 1 m high. In the future, the evolution of dominance between planted and naturally-occurring trees should be interesting to follow.
Plots in natural forests (plots#3-5) showed various species composition at different growth stages. A. officinalis was found as a pioneer species able to recolonize an abandoned shrimp pond (Plot#3). The Sonneratia caseaolaris-dominated area in the seaward margin (Plot#4) (60% of the basal area number; DBH values > 25 cm) was also composed of Sonneratia alba (30%) and Avicennia alba (10%). Individuals of others species such as Avicennia officinalis, N. fruticans, Bruguiera cylindrica were also found. The beautiful and mature R. apiculata area (Plot#5) was nearly monospecific probably due to the quasi permanent flooding with average trunk diameters (measured above the aerial roots) greater than 30 cm.
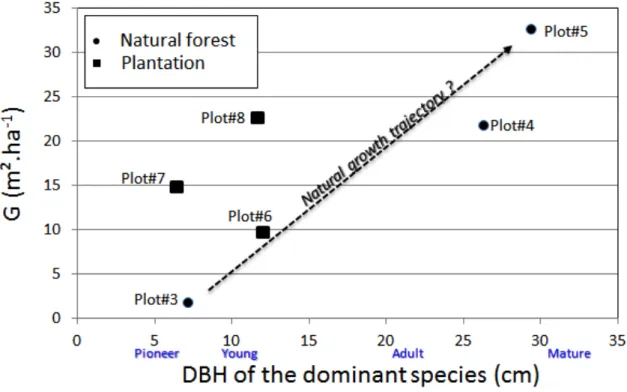
Surveys in plantations pointed out different forest physiognomy and species composition. In the abandoned shrimp pond area of Plot#6, R. apiculata trees had been planted (49% of the basal area). However, the significant presence of A. officinalis (51% of G) indicated that the area was also subject to natural regeneration since, to our knowledge, Avicennia seeds are not used for plantation. The basal area for the plot remained close of the natural growth trajectory highlighted in Figure 9. This area has to be further monitored to see how competition for light between Avicennia and Rhizophora species will modify the species composition. We think that plot#7 was a plantation of both R. apiculata (49% of G) and R. mucronata (35%). We found a significant presence of two others species i.e., A. officinalis (12%) and Xylocarpus granatum (4%), this suggesting that local hydrology allowed natural colonization by other species. The canopy was closed as indicated by the high basal area value of 14.7 m² ha-1. The plot#8 was a R. mucronata plantation that was approximately seven years old. The area was not an abandoned shrimp pond but a mangrove area cut by Total E&P Indonesie for the installation of infrastructure. A very high number of evenaged and evensized small trees (>3200 trees/ha for DBH of 6.5 cm) was noted. The basal area was 22.6 m² ha-1 and other mangrove species did not occur (Figure 9).
Tree mortality may appear soon as a consesquence of a natural self-thinning process resulting from the competition for light and nutrients. As all trees have the same height and same dimensions, the risk of a general collapse could take place. The
renewal of nutrient by way of unconstrained hydro-sedimentary processes will probably largely influence of the long-term sustainability of the plantation.
The impression we get is that the recovery capability of mangroves over cleared areas remains high as supported by previous experiments related to the growth of Avicennia and Sonneratia (Dutrieux et al., 1990; Martin et al., 1990). Consequently, an alternative to 'plantations in every man-made degraded area' may be to facilitate 'flooding everywhere'. Berms of abandoned shrimp ponds can be easily removed by local people and natural recolonization observed (e.g., an educational program). In pipeline corridors or in cleared areas inside large mangrove forests, the need for planting has to be discussed while considering the importance of recovering the initial mud elevation and hydrology. Preservation of substantial mangrove areas is probably necessary to seed the delta.
It is an understatement to say that the Mahakam Delta is a complex mosaic of landscape units presenting various levels of ecosystem degradation, conservation, and human activities. There is a clear need of fine scale mapping (i.e., at a scale of 1/10000 to 1/20000) of those nearly independent units since coastal zone management has to be adapted to each situation. Bird population diversity and trends
The considerable modification of delta habitats resulted in a very substantial increase in populations of some species associated with open wet areas, such as egrets. From some hundreds of individuals counted in 1987, the local populations of egrets currently amount to nearly 15,000 individuals. Likewise, some species of heron have seen their population sizes increase considerably, such as the purple heron or the Javan pond-heron. This also happened for another large species, the lesser adjutant, which saw its numbers rise from about 30 individuals to over 120. Ducks also seem to have used the habitats created by the clearings to considerably increase their populations. The Sunda teal, observed for the first time in Borneo during the 1987 survey (Eve and Guigue, 1989), now has a local population probably nearing 1,000 individuals. The wandering whistling-duck also experienced the same change increasing its numbers from less than 70 individuals in 1987 to nearly 1,000 individuals in 2013.
The populations of these species have benefited of new feeding areas when the shrimp ponds were developed. Indeed, egrets, ducks, and waders use the shrimp ponds in high numbers on cyclical basis when shrimp ponds are emptied for shrimp harvesting. The presence of pristine areas, with large trees or dense copses of smaller species (Nypa) removed from human presence, is also favorable for the reproduction of these species. Here they find quiet conditions for reproduction or gatherings (dormitories). Amongst the species observed in 2013 and those not observed in 1987, eight dwell in an aquatic environment and directly depend on the shrimp ponds: darter, stilts, grey heron, black-crowned night-heron, intermediate egret, western marsh-harrier and the Garganey. In 1987, the delta was not very favourable for these species as there were not many suitable habitats. The opening of shrimp ponds was the obvious factor leading to the growth of all these bird populations.
The growth of populations of proboscis monkey and long-tailed macaque may have also coincided with the habitat changes within the delta. Yet, variations of the sizes of their populations are less well known. We have observed these two species now and then over the past two decades while travelling by boat in the delta (Dutrieux, pers. obs.). Overall we observed more individuals in 2013 than during previous years. Does this reflect a real increase in local populations or the consequence of diminishing habitat and the concentration of individuals among the plant-covered edges of streams?
The presence of five land-based species newly observed in 2013 seems to have been influenced by the increased human presence in the delta: the sooty-headed bulbul; the Javan myna; the paddyfield pipit; the edible-nest swiftlet; and the black-nest swiftlet. The first three species were only observed on low and maintained lawns of Total E&P Indonesie bases where these species came to feed. Another species, the eastern crimson sunbird was observed on a Total base, but seems less linked to human presence, even if this species is known to frequent farming areas (Phillipps and Phillipps, 2011).
Lessons learned - Discussion Human-induced changes
During the early 1970s, two important changes led to marked human population and environmental changes in the Mahakam Delta: the development of the oil and gas activity and the opening of cold storage facilities to preserve and export shrimp (Tarumadevyanto et al., 2006). The development of the oil and gas activity by Total E&P Indonesie, generated significant employement opportunities causing many people to move from Makasar in Sulawesi to work for Total. At the same time, the opening of two cold storage facilities for shrimp opened the international market for products from the Mahakam Delta. The source of the shrimp production changed from fishing to aquaculture as developed by inhabitants oringinating from Sulawesi. In the mid 1980s, there were no shrimp farms within the delta (Dutrieux et al., 1990; Dutrieux, 1991). The first shrimp ponds
appeared in the swamp area of the delta in 1986 (Dutrieux, 2001). Between 1990 and 2000, 75,000 ha of shrimp ponds replaced pristine mangrove cover (Creocean/Sce, 2001; Creocean, 2002). Large areas were cleared without any planning for water circulation, disease management, or production sustainability. As a consequence Cirad (2002) had predicted a total destruction of the natural environment of the delta.
While the shrimp production was at first limited to subsistence fishing, without any need for the addition of food, oxygen or larvae supply, farmers began to face loss of production and income. At the onset, shrimp ponds could produce 100 to 300 kg/ha/year. Yet, after four of five years, production decreased to less than 50 kg/ha/year (Bosma et al., 2012). This forced farmers to abandon many ponds given the lack of financial resources needed to transform their ponds for an efficient and profitable activity.
In the late 1990’s various stakeholders including Total E&P Indonesie pointed out the anarchic development of aquaculture in the delta. Various actions and plans to restore the integrity of the delta were undertaken (Suripno et al., 1998; Madéo, 2001). Most of them consisted in plantation programs. They were conducted by Total E&P Indonesie and local authorities as part of social action. All of the replanting was conducted with the active participation of the local villagers. However, these actions which are still ongoing (Asmaradewi et al., 2012; Bengen et al., 2012), were not coordinated to address the delta as a whole. The replanted areas were concentrated near Total E&P Indonesie facilities or villages participating in the restoration supported by Total E&P Indonesie or on their own initiative. Moreover, the species that were being planted were neither part of the original species assemblage, nor were they the most adapted to the area. The chosen species were mainly Rhizophora spp. which is the least abundant species in the delta but the easiest one to plant. The objective of the replantation was clearly based on a social decision than on science. We noted that the planting of Rhizophora appeared to provide in some places favorable conditions for natural growth of Avicennia. The Avicennia will normally grow faster than the Rhizophora and give the impression from seen from the outside that the areas have recovered naturally.
Trends in vegetation cover and species composition
Here we could assess trends in vegetation cover within the downstream part of the delta. There were few areas that had been recently destroyed (at least 7,000 ha). However, many areas were being recolonized either naturally or through replantation. Some parts of the delta were under erosion (loss of lands) while some were under the process of sedimentation (accretion and gain of new land). Consequently, the Mahakam Delta vegetation was under the influence of destructive and colonization processes. As such, the status and distribution of the vegetation was the result of a complex combination of these two processes. The initial destructive processes of the vegetation were linked with the mangrove deforestation caused by shrimp pond development. However, while such destruction was very common 10 years ago it was rarely observed during this recent study.
Erosion appears to have substantially increased in some areas following the construction of shrimp ponds. Indeed, once a shrimp pond is built behind a green belt, the green belt is quickly degraded followed by the flooding of the shrimp pond. Conversely, erosion is not very active in areas supporting remaining initial vegetation.
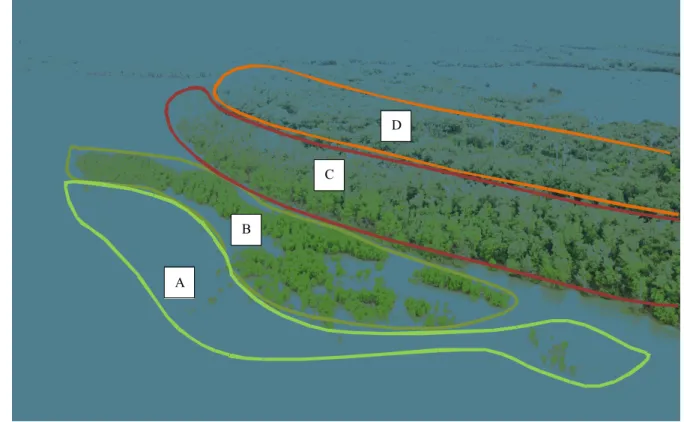
There are three main ways colonization by the vegetation takes place in the delta: colonization of newly created lands during accretion processes; secondary colonization of areas that were cleared (by shrimp pond construction or Oil & Gas developments), and plantations. Within the two distributary areas, the islands show some land progression towards the sea through accretion processes. These areas are concentrated in the southern and northern parts of the delta. The large inputs of sediments carried by the Mahakam River are deposited at the river mouth, where the widening of the channel slows down the current. Once a suitable amount of sediments has accumulated, plants, mainly Sonneratia and in some cases Avicennia colonize the newly formed sand-banks (Figure 7).
Some areas were cleared from their original vegetation and are being secondarily re-colonized, either because humans abandoned the areas, or vegetation is allowed to make a come back. Plantations in the delta are conducted either by local villagers (through local authorities or by individuals), or by Total E&P Indonesie. Villagers replant mangrove in abandoned shrimp ponds or even in active ones supported by Total E&P Indonesie or on their own initiative. There are more and more shrimp ponds where the central part is planted leaving the surrounding area free of vegetation acting as a peripheral channel. Total E&P Indonesie planted vegetation in areas such as pipeline routes where vegetation had been cleared for development, other acquired land and collaborations with the community to replant their land
Figure 8 illustrates what typically occurred throughout the delta from 1988 to 2011 in terms of erosion and accretion. It presents an area found within the lower parts of the delta. The red polygon and the black arrow are geographical references to help the reader orient the photograph. In 1988 the photographed area was subject to naturally-occurring slow accretion (south of the delta). Avicennia grew on the accreted mud-bank. Between the Avicennia band and land, there was a small channel which would eventually become filled with mud and then be rapidly colonized by Sonneratia as seen at the bottom of the
photograph taken in 1988. On the landside, only the shoreline was colonized by large trees with the last Avicennia having colonized the area probably some tens of years before. The land beyond the shoreline was occupied by ferns (A. aureum), grasses, and some scattered trees.
Between 1990 and 2000, most of the shrimp ponds of the delta were developed, leading to the active destruction of the vegetation cover, with the exception of the green belt. However, the green belt was not large enough to be self-protective. The shrimp ponds, once formed, were regularly filled with water and then emptied. This water movement, running perpendicular to the shoreline was a new phenomenon. The combination of this water movement with the tidal action of seawater led to the destruction of the mud berms of shrimp ponds. As a result the green belt vanished and, simultaneously, ponds were filled with the seawater during each tidal cycle. The intruding water also transported sediments, given that this is an area of naturally-occurring accretion. Sediments were deposited both in the ponds and in front of them which was followed by colonization by mangrove. The photograph taken in 2001 shows that the absence of the initial green belt of Avicennia and a new stand of
Sonneratia on a new mud bank.
In 2011 the entire area outlined in the photograph was colonized by mangrove trees. Most of the reference area was covered with trees, probably a mixed formation comprising Sonneratia and Avicennia. Consequently the density was even much higher than it was before. The land was very well protected by these trees. As such sand banks formed in front of the land would be easily recolonized. Here, only the fast growing Sonneratia species colonized the sand bank. The forest was obviously progressing toward the middle of the channel, and at a faster pace than before.
Hence the damages caused by the pond development to the vegetation cover were only temporary. However, the erosion/accretion sequence generated a different habitat. The mixed habitat of ferns and scattered trees was replaced by a dense forest of Sonneratia and Avicennia. It is probable that this community may evolve to become dominated by Avicennia and maybe some Nypa. Consequently the vegetation of the delta has faced substantial structural changes for more than 20 years resulting from human activity. These changes can be summarized having taken place in two main phases:
Phase 1: Between 1990 and 2000, the vegetation clearing was active resulting in a huge loss of vegetation. Almost 80% of the delta vegetation was destroyed. On the downstream of the delta, only a narrow band of vegetation was left along the banks of the rivers or the shoreline, but this green belt was quickly destroyed by water movement.
Phase 2: Between 2000 and 2011, water infiltrated many shrimp ponds located close to the shoreline. As a result, they were no longer used for aquaculture and were recolonized by vegetation following a rapid process. In 2011 through naturally-occurring recolonization, more than 17% of the delta recovered from the initial deforestation. This process will probably continue unless there are no major changes in shrimp pond management.
From 2001 to 2011, vegetation regained a 10,000 ha area (10% of the delta), most of it in abandoned shrimp ponds. Of this total area, only 620 ha are made of replanted trees. We also noted, especially in the northern part of the delta, plantations inside active shrimp ponds indicating that a dedicated management procedure was implemented. However, many abandoned shrimp ponds were recolonized naturally by the vegetation. This recolonization was very fast (a parcel can be covered by vegetation in a few months) and the diversity of the species was quite high. In many cases Avicennia naturally occupied abandoned lands and in some cases with Sonneratia and Rhizophora. The forest development was then quite diversified and the vegetation structure complex (macrorugosity). Interestingly, areas initially supporting Nypa rarely recovered with the same species. The only places where the Nypa could grow back, were areas where stems of the original vegetation had not been destroyed (i.e., clearing limited to cutting of leaves). In most other situations, original Nypa was naturally replaced by other mangrove tree species generating a significantly more diversified environment compared to its original condition (i.e., before any human action) (Denis and Dutrieux, 1993).
The general trend in vegetation cover is toward a reforestation of the delta, provided that external influences remain the same. Yet, the use of shrimp ponds within the delta will probably continue into the future. Badly managed ponds are abandoned and new and better managed ponds are being developed probably involving more investments.
In areas where vegetation recovered naturally, two observations can be made: First the new vegetation (secondary) will not be the same as the initial vegetation. This does not mean, however, that the new vegetation is less “valuable” in terms of
biodiversity or structure. In many places, Nypa will be replaced by Avicennia or other species. Secondly, and as a
consequence, habitat diversity may exceed the original conditions. This situation can lead to an increase or at least a change in biodiversity of the other ecological groups such as birds.
A noteworthy observation is that plantations of mangroves (mainly Rhizophora) within the delta are very efficient and successful in terms of survival rate and growth rate. Plantation of mangrove represents more than 6% of natural regrowth area and requires a substantial effort. Future experimental studies could help answer the question where re-plantations are really
needed or if in some cases naturally-occurring colonization is more efficient. Conclusion
Our observations highlight the fact that as long as the physical environment of the delta is not destroyed, a mangrove can recover rapidly by itself witnessing its resiliency. Every year, hundreds of hectares of cleared areas in the Mahakam Delta are naturally recolonized by diverse and well adapted vegetation. This naturally-occurring recolonization requires, however, that the soil elevation be still adapted and that there is an efficient supply of seeds from preserved areas. Accordingly, human action could be then directed to ensure that these conditions are met in most places. Plantation of mangroves should be focused in areas where these conditions do not exist assuming that soil condition, the right species, and planting density are assessed beforehand. In 2014, the last step of this research project will be devoted to revisiting the recolonizing parcels and producing an updated cartography with the most recent images. This will be conducted to gain greater insight into the processes and dynamics of the recolonization.
Tentatively, vegetation should naturally recolonize abandoned ponds. Yet the significant human-induced changes have altered the dynamics of the local fauna and flora. Increased plant diversity, as well as an increased diversity and abundance of birds contrast with the original (pristine) status of the delta. Economic and ecological value of the Mahakam delta has therefore been modified. . It could be considered that today the delta is reaching a sort of new equilibrium between ecological value and economic development (aquaculture, oil and gas activity). Yet, this situation was reached without any global environmental or development plan. Individual initiatives alone led to this status. Is the end result acceptable in terms of ecological value? Is this end result sustainable? Are current human activities contributing to the long-term environmental quality of the Mahakam Delta?
Surely the lessons learned over the past 20 years could steer all stakeholders toward a science-based approach to ensure the long-term planning of environmental sustainability. Indeed, stakeholders have the opportunity to use these lessons learned to substantiate an integrated environmental management tool such as a coastal management plan acceptable to all parties for the good of the Makaham Delta.
Acknowledgments
Many people have contributed to this project over the years and, whilst the following list is not comprehensive, it is representative of the diversity of these contributions. The authors would therefore wish to thank:
Claude-Henri Chaineau, Jacques Miné and Frédérique Michaud for having the confidence to launch and support this programme.
Leslie Bissey from Creocean, Orig-Setianto Hartoyo, Arif Suprapto, Riana Rahmaningrum, Pratiwi Utamiputri, Didik Widiarso, Basri, Satrian Affan, Dian Safitri, Krishna Ismaputra and Benyamin Argubie from Total E&P Indonesie, Christelle Jennet from Total S.A. for their contribution to the works and their fruitful cooperation.
Ken Deslarzes References
1. Allen, G., Laurier, D. and Thouvenin, J. 1979. Etude sedimentologique du delta de la Mahakam; Edit. TOTAL, Notes et memoires n° 15 :156 pp.
2. Asmaradewi, G., Rusjanto, J., Argubie, B., 2012. Challenges of Oil and Gas E&P Operations in Environmentally & Socially Sensitive Area: Lessons Learned from Mahakam. SPE paper 157271
3. Bengen, D.G., Widiarso D., Ibrahim M., and Suprapto, A. 2012. Mangrove Mahakam Delta. BPMIGAS, TOTAL E&P, P4L.
4. Bibby C.J., Burgess N.D., Hill D.A. & Mustoe S.H. 2000. Bird Census Technique. 2nd edition. Academic Press, London.
5. Bondel, J. 1975. L’analyse des peuplements d’oiseaux, élément d’un diagnostic écologique ; I. La méthode des échantillonnages fréquentiels progressifs (E.F.P.). Terre et Vie 29 : 533-589.
6. Borchers D. L., Buckland S. T. & Zucchini W. 2004. Estimating animal abundance: Closed populations. Springer-Verlag, London, 314 p.
7. Bosma, R.H., Sidik, S.A., Zwieten, P.A.M. van, Aditya, A., and Visser, L. 2012. Challenges of a transition to a sustainably managed shrimp culture agro-ecosystem in the Mahakam delta, East Kalimantan, Indonesia. Wetlands Ecol Manage 20:89–99.
8. Braun C.E. 2005.Techniques for wildlife investigations and management (Sixth edition).The Wildlife Society, Bethesda, Maryland, USA, 355 p.
9. Cirad, 2002. A socio-economic and institutional analysis of Mahakam Delta stakeholders. Final report to TotalFinaElf. Call for Tender N° 263/S5-LK/01
Report Total E&P Indonésie.
11. Creocean, 2002. 2002 Mahakam Delta Environmental Survey TOTAL E&P Indonésie
12. De Graaf, G. J., and Xuan T.T. 1998. Extensive shrimp farming, mangrove clearance and marine fisheries in the southern provinces of Vietnam. Mangroves and salt marshes, (2) 159- 166.
13. Denis, J., et Dutrieux, E. 1993. Vers un système de gestion de l'environnement à l'intention des opérateurs pétroliers. Mappe-Monde N° 93/4. :4-5.
14. Dutrieux, E. 1989. Approche descriptive et expérimentale de l'impact des hydrocarbures sur la mangrove : le cas du delta de la Mahakam (Bornéo, Indonésie). Thèse de Doctorat de l'Université des Sciences et Techniques du Languedoc. Montpellier, 276 p.
15. Dutrieux, E., Denis, J., and Populus, J., 1990. Application of SPOT data to a base-line study of the Mahakam delta mangroves (East Kalimantan, Indonesia) Oceanologica Acta. Vol. 13, N°3, :57-66.
16. Dutrieux, E.1991. Study of the ecological functioning of the Mahakam delta (East Kalimantan, Indonesia). Estuarine, Coastal and Shelf Science Vol. 32, :415-420.
17. Dutrieux, E., Martin, F., and Debry, A. 1990. Growth and mortality of Sonneratia caseolaris planted on an experimentally oil-polluted soil. Marine Pollution Bulletin. Vol. 21, N°2,:62-68
18. Dutrieux, E., Loubié, S., and Pradeau, O. 1996. Creation of a cartographic database for the environmental management of an oil & gas production field. Mahakam delta – Indonesia. Report for IARE for Total.
19. Dutrieux, E. 2001. The Mahakam delta Environment. From the 80’s up to now: A synthesis of 15-year investigation. Dalam Kusumasto, T., Benegn, B. Widigdo & I. Soeseno (Eds): Optimizing Development and Environmental Issues of Coastal Area: Problems and solution for Sustainable of Mahakam Delta. Proceeding of International Workshop, Horison Hotel, Ancol-Jakarta, 4-5 April 2001.
20. Eve, R. & Guigue, A.M.1989. Survey of the Mahakam river delta, East Kalimantan, with special reference to its waterbirds. Asian Wetland Bureau, Kuala Lumpur. Publication n°45, 42 p.
21. Ewell K.C., Ong, J.E., and Twilley R.R., 1998. Different kinds of mangrove swamps provide different goods and services. Global Ecology and Biogeography Letters 7: 83-94.
22. Field, C. (Ed.), 1996. Restoration of Mangrove Ecosystems. The International Society for Mangrove Ecosystems (ISME), Okinawa, Japan. 250p.
23. Gayte, O., and Dutrieux, E. 1996. Creation of GISOIL, a Geographical Information System devoted to the Environmental Management of the Mahakam delta
24. Goldsmith F. B., 1994. Monitoring for conservation and ecology.Chapman and Hall New York, New York, USA. 25. Hambrey, J., 1996.Comparative economics of land use options in mangroves. Aquaculture Asia 1,2: 10-14. 26. Lugo, A. E., Twilley, R. R., Patterson-Zucca, C., 1980. The role of black mangrove forests in the productivity of
coastal ecosystems in south Florida. Report to E.P.A., Corvallis Environmental Research Laboratory, Corvallis-Oregon.
27. Madeo, H. 2001. TOTALFINAELF E&P Indonésie’s Activities in Indonesia : The Socio-Economic Program and its Environmental Actions. Dalam Kusumasto, T., Benegn, B. Widigdo & I. Soeseno (Eds): Optimizing Development and Environmental Issues of Coastal Area: Problems and solution for Sustainable of Mahakam Delta. Proceeding of International Workshop, Horison Hotel, Ancol-Jakarta, 4-5 April 2001.
28. Martin, F., Dutrieux, E., and Debry, A. 1990. Natural recolonization of a chronically oil-polluted mangrove soil after a de-pollution process. Ocean and Shoreline Management Vol. 14, N°3, :173-190.
29. Odum, W. E. and Heald, E. J., 1975. Mangrove forests and aquatic productivity. In an introduction to land water interactions. Ecological studies 10: 129-136.
30. Phillipps, Q. & Phillipps, K. 2011. PHILLIPPS’s field guide to othe Birds of Borneo. Brunei, Sabah, Sarawak and Kalimantan. John Beaufoy Publishing, 370 p.
31. Primavera J. H., 1998. Mangroves as nurseries: shrimp population in mangrove and non mangrove habitats. Estuarine
Coastal Shelf Science 46: 457-464.
32. Reynolds R. T., Scott J. M. & Nussbaum R. A., 1980. A variable circular plot method for estimating bird numbers. Condor, 82 :309-313.
33. Ricklefs, R.E. and Schluter, D. 1993. Species diversity in ecological communities. University of Chicago Press, Chicago.
34. Saenger, P. 2002. Mangrove Ecology, Silviculture and Conservation. Kluwer Academic Publishers.
35. Snedaker, S. C., Dickinson, J. C., Brown, M. S. and Lahmann, E. J., 1998. Ubicacion de piscinas camaroneras y alternativas de manejo en ecosistemas de manglares en Ecuador. PMRC (Proyecto de Manejo de Recursos Costeros), N°2 Serie Estudios, Ministerio de Agricultura y Ganaderia, Guyaquil-Ecuador.
36. Soemodihardjo, S., P. Wiroatmodjo, A. Abdullah, I.G.M. Tantra and Soegiarto A., 1993. Condition,
socio-economicvalue and environmental significance of mangrove areas in Indonesia. In Clough (ed.) The economic and development value of mangrove forests and their present state of conservation in the South East Asia/ Pacific region. ISME, Okinawa, Japan, pp.17-40 (Bl.).
37. Spalding, M., Kaimunam, & Collins, L. 2010 - World Atlas of Mangroves. Earthscan London, 319 pp.
for E&P Environmental management applied to sensitive areas. SPE paper 46717
39. Suripno, Sulistiyono, and Dutrieux, E. 1998. Mangrove Restoration Techniques: The Mahakam Delta. SPE paper 46582
40. Tarumadevyanto H., Sandjatmiko P., Rony A.M., Suyatna I., Sulistioadi Y.B., Tjitradjaja I., Adrianto L. and Bengen D.G. 2006. Mahakam Delta in Space and Time: Ecosystem Resource and Management. (Mc Leish M.J. & Plisson Saune S., Eds). 190 pages Published by BPMIGAS-TOTAL, INRR
41. Thom B.G. 1982. Mangrove ecology: a geomorpological perspective. In Clough B.F.(ed). Mangrove ecosystems in Australia: struture, function and management. Australian National University Press, Canberra, pp.43-62.
42. Tomlinson, P.B. 1986. The botany of mangroves. Cambridge Tropical Biology Series, Cambridge University Press, Cambridge, New York, USA.
43. Valiela, I., J.L. Bowen, and J.K. York, 2001. Mangrove forests: one of the World's most threatened major tropical environments. Bioscience 51 (10):807-816.
44. Wolanski, E., S. Spagnol, S. Thomas, K. Moore, D.M. Alongi, L. Trott and Davidson A. 2000. Modelling and visualizing the fate of shrimp pond effluent in a mangrove-fringed tidal creek. Estuarine, Coastal and Shelf Science. 50:85-97.
!"#$
%&&!
!""#
!""%
Figure 3 : Extent of shrimp ponds (in blue) in the Mahakam Delta between 1986 and 2001. a. Interpretation of SPOT images taken on 14 November 1986 and 21 February 1987 (Dutrieux, 1989); b. Interpretation of SPOT images taken on 25 March 1992 (Dutrieux et al. 1996); c. interpretation of SPOT images taken on 30
March 1998 (Dutrieux, 2001); d. Interpretation of Landsat 7 images taken on 27 February 2011 and ERS radar images taken on 5 September 2001 (Creocean, 2002).
Figure 5 : Mapping of the vegetation cover of the Mahakam Delta in 2011. Dark green represents the remaining original vegetation cover while light green is the secondary vegetation.
0 10000 20000 30000 40000 50000 60000 70000 80000 90000 100000 1980 1986 1992 1996 1998 1999 2001 2011 hectares
A
B
C
D
Figure 7 : Different stages of colonization in the Mahakam Delta. A: very young seedlings of Sonneratia (less than 1 year); B: young Sonneratia (1 to 3 years); C: pure Avicennia (probably 10 years old); D: old
Avicennia mixed with Nypa (more than 20 years).
Figure 8 : Typical succession of erosion and accretion processes in the southern part of the Mahakam Delta
Figure 9 : Variation of the forest plot basal area G in function of the diameter at breast height (DBH) of dominant trees of dominant species (Mahakam Delta).
Type of vegetation Surface in km2 % of total surface of the delta
Mixed fresh-water forest 42 4,1
Ferns and herbaceous 47 4,6
Low salinity mangrove 183 17,9
Pure Nypa 551 53,9
Dense Avicennia 83 8,1
Dense Rhizophora 7 0,7
Sonneratia 1 0,1
Nypa and dispersed Avicennia 77 7,5
Nypa and Rhizophora 7 0,7
Cultures, mainly coconut 24 2,3
Aquaculture 0 0
Total delta 1022
Year Surface areas of ponds (Km2) % of the total surface area of the delta 1986 2.92 0,3% 1992 29.51 2,9% 1996 136.88 13,4% 1998 386.96 37,8% 1999 563.63 55,1% 2001 748.43 73,2%
Vegetation type 1986 1992 1996 1998 1999 2001 Mixed fresh-water forest 100% 100% 100% 100% 100% 90% Low salinity mangrove 100% 100% 100% 97% 76% 59%
Pure Nypa 100% 99% 90% 62% 36% 19%
Nypa and dispersed Avicennia 98% 96% 71% 31% 31% 18% Nypa and Rhizophora 100% 100% 94% 40% 40% 8% Dense Avicennia 99% 91% 72% 34% 34% 16% Dense Rhyzophora 100% 100% 92% 50% 48% 26% Ferns and herbaceous 99% 97% 66% 26% 26% 27% Sonneratia 100% 100% 100% 86% 86% 33% Cultures, mainly coconut 100% 47% 32% 16% 16% 10%
Table 3 : Status of surface areas for each type of vegetation from 1986 to 2001 (Mahakam Delta) (Dutrieux, 2001)
dom. DBH G
(cm) (m_.ha-‐1)
1 -‐0,8281 117,2639 Natural forest Adult N. fructicans
2 -‐0,7478 117,5674 Plantation Juvenile R. mucronata R. mucronata
3 -‐0,7423 117,5552 Pioneer A. officinalis 7,2 1,6
4 -‐0,8882 117,3627 Adult S. caseolaris 26,3 21,7
5 -‐0,5304 117,5499 Mature R. apiculata 29,4 32,5
6 -‐0,7397 117,5691 Pre-‐adult R. apiculata A. officinalis 12,1 9,6
7 -‐0,5245 117,5552 Plantation Young R. apiculata R. apiculata 6,5 14,7
8 -‐0,4701 117,5876 Young R. mucronata R. mucronata 11,6 22,6
Plot Id. Latitude Longitude Forest type Growth stage Planted species
Dominant species
Natural forest
Table 4 : Main characteristics of the forest plots inventoried in the Mahakam Delta. Diameter at breast height (DBH) values correspond to a median value computed over the 10 trees of a given species presenting the highest value of DBH. Latitude and longitude of plot centers are given in decimal degrees.
Appendix 1: Flora from the downstream area of the Mahakam Delta
This appendix presents the results of the first detailed inventory of the mangrove species of the Mahakam Delta. This survey conducted in 2010 yielded:
15 major components, true mangroves dominating the flora communities: Nypa fruticans (Areacaeae family)
4 Avicennia species (Avicenniaceae family) : Avicennia officinalis, A. alba, A. lanata, A. marina 3 Sonneratia species (Sonneratiaceae family) : Sonneratia caseolaris, S. alba and S. ovata 2 Rhizophora species (Rhizophoraceae family) : Rhizophora apiculata and R. mucronata
4 Bruguiera species and 1 Ceriops species (Rhizophoraceae family): Bruguiera gymnorhiza, B. cylindrica, B.
parviflora, B. sexangula and Cerius tagal.
6 minor components including less frequent species: Excoecaria agalocha , Heritiera littoralis, Xylocarpus granatum, Aegiceras corniculatum Acrostichum aureum Scyphophora hydrollycaea
About 11 associated species or introduced ones: Capsicum frutescens (Cabai rawit)
Ipomoea aquatic (Kangkung) Jatropa curcas (Jarak pagar)
Pandanus amaryllifolius (Pandan wangi) Solanum melongena (Terung)
Aglaia cucullata, of Meliaceae Uncaria spp. of Rubiaceae Scirpus litoralis of Cyperaceae Flagellaria indica of Flagellariaceae Hymenachne acutigluma of Poaceae Allophylus cobbe, of Sapindaceae