O
pen
A
rchive
T
OULOUSE
A
rchive
O
uverte (
OATAO
)
OATAO is an open access repository that collects the work of Toulouse researchers and
makes it freely available over the web where possible.
This is an author-deposited version published in :
http://oatao.univ-toulouse.fr/
Eprints ID : 15179
The contribution was presented at ASONAM 2014 :
http://www.asonam2014.org/
To cite this version : Kaytoue, Mehdi and Pitarch, Yoann and Plantevit, Marc
and Robardet, Céline Triggering Patterns of Topology Changes in Dynamic
Graphs. (2014) In: IEEE/ACM International Conference on Advances in Social
Networks Analysis and Mining (ASONAM 2014), 17 August 2014 - 20 August
2014 (Beijing, China).
Any correspondence concerning this service should be sent to the repository
administrator:
[email protected]
Triggering Patterns of Topology Changes
in Dynamic Graphs*
Mehdi Kaytoue INSA-Lyon, CNRS LIRIS UMR5205 F-69621, France [email protected] Yoann Pitarch Universit´e de Toulouse CNRS, IRIT UMR5505 F-31071, France [email protected] Marc PlantevitUniversit´e Claude Bernard Lyon 1 CNRS, LIRIS UMR5205 F-69621, France [email protected] C´eline Robardet INSA-Lyon, CNRS LIRIS UMR5205 F-69621, France [email protected]
Abstract—To describe the dynamics taking place in networks that structurally change over time, we propose an approach to search for attributes whose value changes impact the topology of the graph. In several applications, it appears that the variations of a group of attributes are often followed by some structural changes in the graph that one may assume they generate. We formalize the triggering pattern discovery problem as a method jointly rooted in sequence mining and graph analysis. We apply our approach on three real-world dynamic graphs of different natures – a co-authoring network, an airline network, and a social bookmarking system – assessing the relevancy of the triggering pattern mining approach.
I. INTRODUCTION
In the last years, graph mining has become a critical area of research but also an important tool for uncovering phenomena hidden in social networks. It allows a better understanding of their nature but also of the Human interactions and behaviors on the Web, and provides a support for many tasks such as social recommendations [15], community discovery [11], social influence propagation [12], and link prediction [5]. Indeed, real-world phenomena such as social interactions, are often depicted by graphs where vertices represent entities and edges represent their relationships or interactions. With the rapid development of social media, sensor technologies and bioinformatic assay tools, such kind of graph abstraction has become ubiquitous. Most of these systems are dynamic, with vertices and edges (dis-)appearing in time. Besides, vertex status is often described by attributes whose values also change over time. A timely challenge is the design of effective graph miningmethods to discover actionable insights in such dynamic attributed graphs, to bring new knowledge on the common rules that govern the networks transformations.
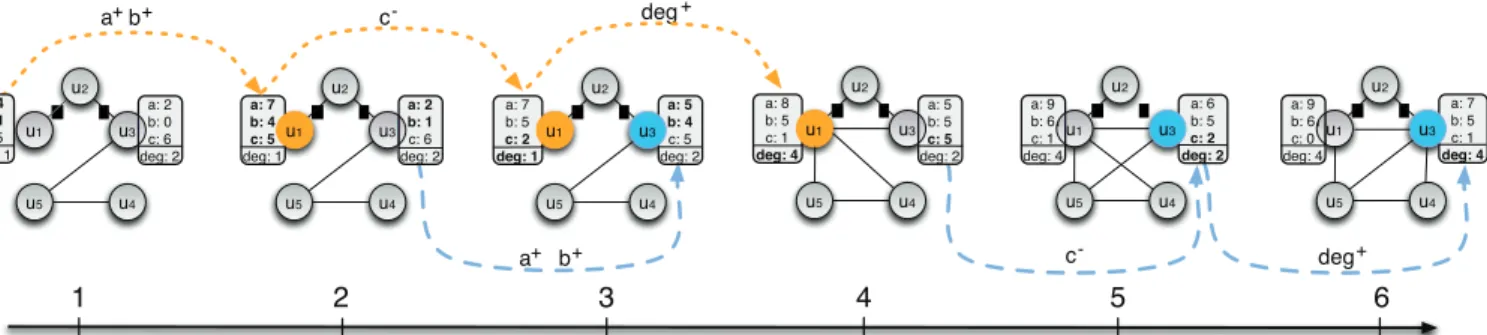
In pattern mining, dynamic graphs have been analyzed from two main research tracks: (a) the study of the properties that describe the topology of the graph [8], [27], or (b) the extraction of specific sub-graphs to describe the graph evolu-tion [2], [24], [30]. However, very few approaches [9] extract patterns that combine information about attribute values and graph topology, but do not identify the temporal relationships that may exist between the changes of these two components. In this paper we seek to elucidate the temporal relationships between the evolution of vertex attribute values and the graph structure. Let us first illustrate this idea. Figure 1 depicts
*This work has been partially supported by the project GRAISearch – EU Marie Curie Actions – FP7-PEOPLE-2013-IAPP.
a social network whose users are linked if they mutually
follow their blogs and evolves over 6 timestamps. Attributes
a, b, and c denote the number of status updates, positive opinions sent to others and negative opinions received from other users. At each timestamp, each vertex is also provided with topological properties giving his role in the current graph (centrality measures, clustering coefficient, etc.). To ease
reading, only vertex degrees deg are represented. From this
dynamic attributed graph, we consider that an attribute (or a topological property) strongly varies for a given vertex if the absolute difference between its current value and the one at the previous timestamp is at least of two. These variations are represented by dotted lines. It allows to represent temporal relationships between the vertex attributes and their topological properties as a triggering pattern: a sequence of variations that is supported by a given proportion of vertices. In the example,
such sequence is denoted as!{a+, b+}, {c−}, {deg+}$ and is
supported by the two verticesu1andu3. It can be interpreted
as updating his status more often while giving positive opinions about others and then receiving less negative opinions from the others is often followed by an increase of user’s popularity.
We define the problem of finding temporal relationships between the vertex attributes and their topological properties as the triggering pattern mining problem. A given dynamic attributed graph (possibly oriented) is broken into sequences of variations of both vertex attributes and topological proper-ties, which makes possible finding subsequences of variations that are discriminant for topological variations. For that we use the notion of emerging patterns in the framework of supervised descriptive rule discovery [10], [20] where class labels are given by topological variations. To be interesting and further analyzed, such subsequence should not only be discriminant for topological variations which is the difficulty of the problem. Indeed, they also arise several questions: How many nodes do support this sub-sequence? Are those nodes highly connected or not and most importantly, do they convey a high diffusion potential? For that, how can an aggregated graph be defined, since nodes can support a subsequence at different time stamps? Are the variations synchronized or spread through time as in Figure 1? To answer these questions, we show that a sequential pattern mining algorithm has to consider not the support (e.g. [28]), but the graph structure during the extraction. Furthermore, we introduce a particular representation of sequential patterns (prefix-closed patterns), that are the best non-redundant and most discriminant patterns highlighting temporal relationships.
a: 2 b: 0 c: 6 deg: 2 u5 u3 u4 u2 a: 7 b: 4 c: 5 deg: 1 a: 2 b: 1 c: 6 deg: 2 u1 u5 u3 u4 u2 a: 7 b: 5 c: 2 deg: 1 a: 5 b: 4 c: 5 deg: 2 u1 u5 u3 u4 u2 a: 8 b: 5 c: 1 deg: 4 a: 5 b: 5 c: 5 deg: 2 u1 u5 u3 u4 u2 a: 9 b: 6 c: 1 deg: 4 a: 6 b: 5 c: 2 deg: 2 u1 u5 u3 u4 u2 a: 9 b: 6 c: 0 deg: 4 a: 7 b: 5 c: 1 deg: 4 u1 u5 u3 u4 u2 1 a+b+ c- deg+ a+ b+ c- deg+ u1 a: 4 b: 1 c: 5 deg: 1 2 3 4 5 6
Figure 1: A dynamic attributed graph on6 timestamps entailing the triggering pattern !{a+, b+}, {c−}, {deg+}$. To ease reading,
only attributes for verticesu1andu3are shown. Colors and bold attribute values indicate strong variations for supporting vertices.
The main contributions of this paper are threefold: (i) The introduction of a novel problem, the discovery of triggering patterns of topology changes, defined as a suitable mathematical notion for the study of dynamic networks; (ii) The design of TRIGAT, an efficient algorithm jointly rooted in sequence mining and graph analysis that benefits from various properties of closed sequential pattern mining; (iii) An extensive empirical study that evaluates the efficiency and the effectiveness of the devised algorithm on three real-world dynamic graphs of different natures: A co-authoring network, an airline network, and a social bookmarking system.
The rest of this paper is organized as follows. Section II states the problem definition and the notations we will use. Section III introduces several properties allowing in Section IV the design of an efficient algorithm to mine triggering patterns. We report our experimental results in Section V before review-ing related work in Section VI and concludreview-ing.
II. PROBLEM DEFINITION AND NOTATIONS
A dynamic attributed graph is realized by a sequence of at-tributed graphs in which each vertex takes a value for different attributes and edges vary in time (addition or deletion).
Definition 1 (Dynamic attributed graph): Let
G = {G1, . . . , Gt} be a sequence of t static attributed
graphs Gi = (V, Ei, F ) with T = {1, . . . , t} the set of
timestamps, V the set of vertices, Ei the set of edges that
connect vertices ofV at time i ∈ T (Ei⊆ V × V ) and F the
set of numerical attributes that map each vertex-time pair to
a real value:∀f ∈ F, f : V × T → R.
Topological measures give important information on the con-nectivity of each vertex within the graph. For instance, the degree describes the close neighborhood of a vertex, and centrality measures depict the role of the vertex in the whole graph [23], that is to say its connectivity with respect to all other vertices. Our goal is to highlight how variations of attribute values of a vertex can later impact on its connectivity.
We define topological measures as a set of attributesM with
∀m ∈ M, m : V × T → R. Let D = F ∪ M the set of descriptors (either attributes or topological measures): we are
looking for temporal dependencies betweenD and M .
Example 1: Figure 1 illustrates a dynamic attributed graph G = {G1, ..., G6}, with t = 6 timestamps. Each graph
Gi = (V, Ei, F ) shares the set of vertices V = {u1, ..., u5}
and the set of attributesF = {a, b, c}. The fact that the vertex
u3takes the value6 for the attribute c at timestamp 2 is written
c(u3, 2) = 6. The topological measure used is the vertex
degree:M = {deg}, D = {a, b, c, deg} and deg(u3, 6) = 4.
To characterize vertex behaviors, an appropriate discretization qualifies the strength of their attribute-value variations at different timestamps. This procedure has to be wisely chosen with respect to the goals and the properties of the dynamic graph. This choice has no impact on our problem definition: to ease reading of this section we consider the naive discretization of Example 2 that turns any attribute value into an element of S = {+, −, ∅} to denote increase, decrease or no variation.
Definition 2 (Discretization function): Letdiscr : V ×D× T → S be a discretization function with S a set of variation
symbols. In the following, we call an element(d, s) from D×S
a descriptor variation, denotedds.
Definition 3 (Vertex descriptive sequence): The set of all
variations for a vertex v at time i is an itemset vars(v, i) =
{ddiscr(v,d,i), ∀d ∈ D}. A vertex v is described by a sequence
δ(v) = !vars(v, 1), . . . , vars(v, t)$. We note ∆ = {δ(v) | v ∈ V } the set of all sequences.
Example 2: Let S = {+, −, ∅}, a simple discretization function defined as:
discr(v, d, i) = + if d(v, i)− d(v, i − 1) ≥ 2 and i >1 − if d(v, i)− d(v, i − 1) ≤ −2 and i > 1 ∅ otherwise
then,δ(u1) = !{a+, b+}, {c−}, {deg+}$ holds in Figure 1.
Definition 4 (triggering pattern): A triggering pattern is a
sequenceP = !L, R$ where L is a sequence of sets of
descrip-tor variations:L = !X1, . . . , Xk$ with ∀j ≤ k, Xj⊆ (D ×S),
andR a single topological variation, R ∈ (M × S).
To be relevant such patterns should verify some properties. Classical constraints on the pattern language can be
de-fined [4], e.g. on the length of sequenceL, on the distribution
of the cardinality of each set of L, or on the support of the
pattern (frequent patterns). We need to introduce a
growth-rate-like measure [10], [20] to keep patterns!R, L$ whose left
partL strongly discriminates the topological variation R.
Definition 5 (Triggering pattern support): We say that
Q1 0 Q2, if there exists !i1, . . . , ik$ a strictly increasing
sequence in N such that Xj ⊆ Yij, ∀j = 1, . . . , k. The
support of a pattern P = !L, R$ is the set of vertices for
which P is a sub-sequence of their descriptive sequence:
SUPP(P, ∆) = {v ∈ V | P 0 δ(v)}.
Example 3: SUPP(P1 = !{a+}, {deg+}$, ∆) = {u1, u3}
and SUPP(P2= !{a+, b+}, {c−}, {deg+}$, ∆) = {u1, u3}.
Definition 6 (Triggering pattern growth rate): Let P =
!L, R$, we denote by ∆R ⊆ ∆ the set of vertex descriptive
sequences that containR. The growth rate of P is given by:
GR(P, ∆R) = |SUPP(L, ∆R)|
|∆R| ×
|∆ \ ∆R|
|SUPP(L, ∆ \ ∆R)|
The support measure is defined by the vertices that satisfy the pattern, while the growth rate gives the discriminating power of the sequence variations to explain a topological change. It however does not take into account vertices im-portance in the graph. To assess how influential are the vertices that support a pattern, we consider the notion of coverage that is defined as the set of vertices connected to the pattern support, i.e. the vertex cover [7] of the pattern. However, triggering patterns appear at different timestamps in their supporting descriptive sequences and the set of connected vertices cannot be defined in the dynamic graph: the coverage of a pattern has to be defined up to an aggregated static graph
Gaggrthat sums-up the connectivity of each vertex along time.
Definition 7 (Coverage of a triggering pattern): Let
Gaggr = (V, Eaggr) be an aggregated graph of the dynamic
graph G. The coverage of a pattern P is defined by:
COV(P, ∆, Gaggr) = SUPP(P, ∆) ∪ {v ∈ V | ∃w ∈
SUPP(P, ∆) s. t. (w, v) ∈ Eaggr}. It naturally follows that
SUPP(P, ∆) ⊆COV(P, ∆).
Example 4: ForP = !{a+, b+}, {c−}, {deg+}$, we have
cov(P, ∆, Gsum) = V using Gaggr = (V, {(u, v)|∃i ∈
T, (u, v) ∈ Ei} denoted Gsum.
The triggering pattern problem. Given a dynamic attributed
graph G, a minimum growth rate threshold minGR and a
minimum coverage threshold minCov, the problem is to find
all triggering patterns P = !L, R$ such that |COV(P, ∆)| ≥
minCov and GR(P, ∆R) ≥ minGR.
The coverage measure is important for two reasons: (1) It conveys per se insights on the possibilities for dissemination of a pattern; (2) It makes possible the definition of interestingness measures to characterize specific kinds of triggering patterns.
For instance, the ratio ρ(P, ∆) = COV(P,∆,Gaggr)
SUPP(P,∆) ∈ [1, |V |]
allows to distinguish the patterns supported by a group of
isolated vertices (values close to 1) to the ones supported by
very connected vertices (much higher values than 1). Finally, given his preferences, the user can query the set of patterns [3]. III. CLOSED COVERAGE-BASED TRIGGERING PATTERNS
In general, closed patterns are preferred to limit redun-dancy: any sequential pattern is closed w.r.t. the support if it does not exist a super-sequence with the same support [28]. Furthermore, the growth-rate is always maximized by those closed patterns [21]. In this section, we show how to define closed triggering patterns w.r.t. to the coverage measure that
maximize the GR measure. As triggering patterns are
partic-ular sequences ending on a topological variation, one cannot trivially apply any closed sequential pattern mining algorithm. Instead, we prove several properties allowing to define closed triggering patterns as prefix-closed patterns, and that the latter can be defined from closed sequential patterns. Interestingly, the coverage measure still follows an anti-monotone behavior. Definition 8 (Prefix-closed pattern): We say that a pattern
P = !LP, R$ is prefix-closed w.r.t. SUPP iff ∄Q = !LQ, R$
such that LP 0 LQ and SUPP(P ) = SUPP(Q): P cannot be
extended on its left partLP without changing its support.
In Example 3,P2 is a closed triggering pattern, i.e. a
prefix-closed sequential pattern, whileP1 is not.
Property 1: Let P = !LP, R$ and Q = !LQ, R$ be
two triggering patterns. If LP 0 LQ and SUPP(LP, ∆R) =
SUPP(LQ, ∆R), then GR(LP, ∆R) ≤ GR(LQ, ∆R).
Proof: We have SUPP(LP, ∆R) = SUPP(LQ, ∆R). As
LP 0 LQ, we obtain that SUPP(LP, ∆) ⊇ SUPP(LQ, ∆)
thanks to the anti-monotonicity of the support. By definition
6, we conclude that GR(LP, ∆R) ≤ GR(LQ, ∆R).
Property 1 makes possible to only focus on prefix-closed patterns as they maximize the growth-rate. To extract closed patterns, we exploit the property asserting that prefix-closed patterns can be retrieved from prefix-closed patterns.
Property 2: For any prefix-closed patternP , there exists a
closed patternQ such that P 0 Q and SUPP(P ) =SUPP(Q).
Proof: Prefix-closed patterns cannot be extended to the left without changing their support. However, they can be extended to the right while preserving their support. Thus, a
closed pattern Q can be seen as a simultaneously prefix and
suffix-closed:Q is included in a closed pattern.
Property 3 states that COV is anti-monotone with respect
to0 (directly from Definition 7). Since by definition we have
that for any patternP , SUPP(P ) ⊆ COV(P ), one can choose
to enumerate the closed triggering patterns based either on support or coverage. This is made precise in the next section. Property 3: The coverage is anti-monotone with respect to
0, i.e., ∀P 0 Q,COV(P, ∆, Gaggr) ⊇COV(Q, ∆, Gaggr).
IV. ALGORITHMTRIGAT
We introduce TRIGAT to mine the complete and cor-rect collection of all coverage-based closed triggering
pat-terns P = !L, R$ such that |COV(P, ∆)| ≥ minCov and
GR(P, ∆R) ≥ minGR. It takes benefits from the properties
given in Section III to efficiently prune the pattern search space while pushing the coverage constraint. Algorithm 1 presents the main steps of TRIGAT, including the necessary pre- and post- processing steps. It first builds each vertex descriptive sequence of the dynamic graph (line 1). Covering 1-item sequences, that are sequences of a single descriptor variation satisfying the coverage constraint, are computed in
one scan on ∆ (line 2) and uncovering items are removed
for any sequence of ∆. Then, TRIGAT_Enum is called. It
achieves a depth-first search on a given prefix sequence using a pattern-growth approach that works on projected databases
all the suffixes ofs in ∆ [28]. TRIGAT_EN U M takes benefits
from pruning techniques based on closed patterns (lines 1 to 3) while pushing the coverage constraint (line 4). We use the early termination by equivalence pruning technique, first
proposed in the CloSpan algorithm [28]1. The coverage is
computed w.r.t. the union of the adjacency lists of vertices
whose projected sequences along the prefix sequence s is not
empty (i.e., s 0 δ(v)). Finally, as prefix sequences can grow
either by adding a single descriptor variation in the last set
of s, or by adding a new set made of this single descriptor
variation at the end of the sequence, these two patterns are recursively considered (lines 5 to 10). TRIGAT_Enum returns
all covering sequences of prefix!s$. Algorithm 1 ends with a
post-processing ofC to retain only closed patterns (line 7). To
avoid expensive tests that aim at comparing each sequence of C with other sequences in C, we adopt the fast subsumption checking algorithm [31] using a hashmap with a sparse key
distribution. Closed triggering patterns are then built from C
(line 8). From lines 9 to 11, prefix-closed sequences ending by a topological variation are built from closed sequences, and the growth-rate is computed (in negligible time, see section V). Algorithm TRIGAT
Require: G = {(V, Ei, F)}, minGr, minCov, Gaggr
Ensure: P the set of closed triggering patterns
1: ∆← {δ(v)|v ∈ V }
2: I← all covering 1-item sequences
3: Filter∆ with only covering 1-item sequences w.r.t. minCov
4: for all s∈ I do
5: C←TRIGAT_enum(s, ∆|s,Gaggr, minCov)
6: end for
7: Eliminate non-closed sequences from C
8: C← prefix closed patterns ,s, Xk- ∈ C, s.t.Xk∈ (M × S)
9: for all P=,s, Xk- ∈ C do 10: Add P toP if GR(,s, Xk-, ∆X k )≥ minGr 11: end for Procedure TRIGAT_EN U M
Require: s=,S1, . . . , Sℓ-, ∆|s,Gaggr, minCov
Ensure: C the set of covering sequences of prefix s
1: if not closed based prunnable(s) then
2: insert s in C
3: end if
4: Scan∆|s, find each minCov-covering item α∈ (D × S) s.t. s
can be extended to,S1, . . . , Sℓ−1,{Sℓ∪ α}- or ,S1, . . . , Sℓ,
α-5: for all valid α do
6: s← ,S1, . . . , Sℓ−1,{Sℓ∪
α}-7: TRIGAT_enum(s, D|s,Gaggr, minCov)
8: s← ,S1, . . . , Sℓ,
α-9: TRIGAT_enum(s, D|s,Gaggr, minCov)
10: end for
Algorithm 1: The TRIGAT algorithm
V. EXPERIMENTS
We provide an empirical evaluation of our methodology. Experiments were performed on 2.5GHz and 16GB of RAM
1This enables to avoid to consider any prefix sequence s′ having an
equivalent projected database than a sequence s discovered before, i.e., ∆|s= ∆|s′. Two cases are possible. Either s′≺ s(backward sub-pattern)
or s ≺ s′ (backward super-pattern). In case of backward sub-pattern, the
exploration of s′and its descendants is stopped. In case of backward
super-pattern, the descendant of s are transplanted to s′ instead of exploring an
already scanned projected database.
machines and TRIGAT is written in C++2. The
topologi-cal measures considered are: degree, closeness, betweenness, eigen vector, network constraint, clustering coefficient, page
rank, hub score, and authority score [17]3.
A. Dynamic attributed graphs:
DBLP The Digital Bibliography & Library Project4 covers
an important part of the computer science bibliography. All references published between 1990 and 2010 by 2,723 authors (recording more than 10 publications) are elected among 43 conferences/journals. Two additional attributes sum the publications resp. in conferences and journals. The dynamic attributed graph, with authors as vertices and edges as co-authoring, entails 9 timestamps of 5 years half-overlapping intervals ([1990-1994],[1992-1996],...,[2006-2010]).
Air traffic The Research and Innovative Technology Ad-ministration (RITA) maintains a public database giving the
U.S. air carrier traffic statistics5. We derive three dynamic
graphs where vertices are the airports, the vertex attributes describe traffic aspects (number of departures/arrivals, number of canceled flights, number of flights diverted at destination, the mean delay of departure/arrival and the ground waiting at time departure/arrival) and the edges represent air lines. They differ by their time scale: in RITA1, attribute values are summed over days of September 2001; in RITA2, the values are accumulated over months from September 2000 to September 2002; and in RITA3, they are aggregated over weeks between 01/08/2005 and 25/09/2005 (Katrina hurricane).
Social bookmarking Del.icio.us6 provides social networking,
bookmarking, and tagging information [6]. In the generated dynamic graph, edges represent mutual fan relationships. Users are described by the numbers of bookmarks they shared for different categories (art, car, student, etc.). Due to the long
tail principle, only categories used at least by 500 are kept.
Timestamps are aggregated by year on a period spanning from 2006 to 2010 for the quantitative experiments.
Before extracting triggering patterns from these dynamic graphs, we need to characterize the strength of the attribute value variations as stated in Definition 2. As we are interested in significant variations of vertex attribute values w.r.t. the proper history of each vertex between consecutive timestamps,
we consider, for each attribute d ∈ D and vertex v ∈ V , the
set {d(v, i) − d(v, i − 1), 1 < i ≤ t} of time derivatives of
d(v). Such a discrete set of values can be characterized by its mean (d(v)), that refers to the central value of the set, and its standard-deviation (std(d(v))) that gives a hint at the homogeneity or heterogeneity of the set. Based on these values,
we built two discretization functionsdiscr1 anddiscr2:
discr1(v, d, i) = ++ if d(v, i)− d(v, i − 1) ≥ d(v) + 3 · std(d(v)) + if d(v, i)− d(v, i − 1) ≥ d(v) + std(d(v)) − if d(v, i)− d(v, i − 1) ≤ d(v) − std(d(v)) −− if d(v, i)− d(v, i − 1) ≤ d(v) − 3 · std(d(v)) ∅ otherwise
2Materials available: http://liris.cnrs.fr/∼mplantev/doku/doku.php?id=trigat 3Measures computed with SNAP http://snap.stanford.edu/
4http://www.informatik.uni-trier.de/ ley/db/ 5http://http://transtats.bts.gov/
discr2(v, d, i) = + if d(v, i)− d(v, i − 1) ≥ d(v) + 3 · std(d(v)) − if d(v, i)− d(v, i − 1) ≤ d(v) − 3 · std(d(v)) ∅ otherwise
discr2is used on RITA1 and RITA2 air traffic networks,
as on these dynamic graphs, we aim at characterizing a locally
high-impact event. discr1 is used on DBLP, RITA3 and
del.icio.us dynamic graphs where the temporal variations of values are more progressive. For the coverage computation, we
use in these experiments the aggregated graph Gsum. Table I
describes the studied dynamic graphs. |V |, |F | and |T | are
resp. the number of vertices, attributes and timestamps.|D| is
the number of descriptor variations, S is the average number
of descriptor variations per vertex, I is the average number
of timestamps having more than a variation. degsum (resp.
densitysum) is the average degree (resp. density) ofGsum.
Finally, observe that a topological variation may appear several times in a vertex descriptive sequence, for example a vertex may experience a large increase in its degree twice over time. We assume that each occurrence of a topological
variation in δ(v) is distinct from the others: adding an index
to those variations is enough to differentiate them and does neither change the problem definition or its resolution.
|V | |F | |T | |D| S I degsum densitysum
DBLP 2723 45 9 360 34.4 6.6 14.7 0.005 RITA1 220 8 30 30 16.3 5.1 15.7 0.07 RITA2 234 8 24 39 4.5 1.8 17 0.07 RITA3 280 6 8 87 28.3 6.5 15.9 0.05 del.icio.us 1867 121 5 400 31 1.6 11 0.003
Table I: Dynamic graph characteristics.
B. Quantitative experiments:
For all quantitative experiments, we setminGR = 1 to be
fair on the reported results, sinceGR is post-computed.
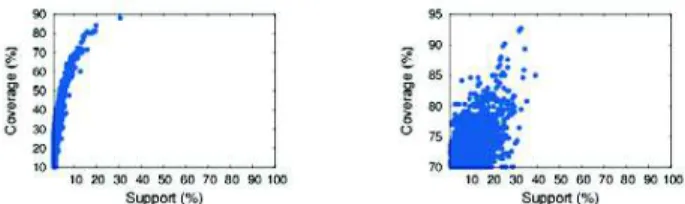
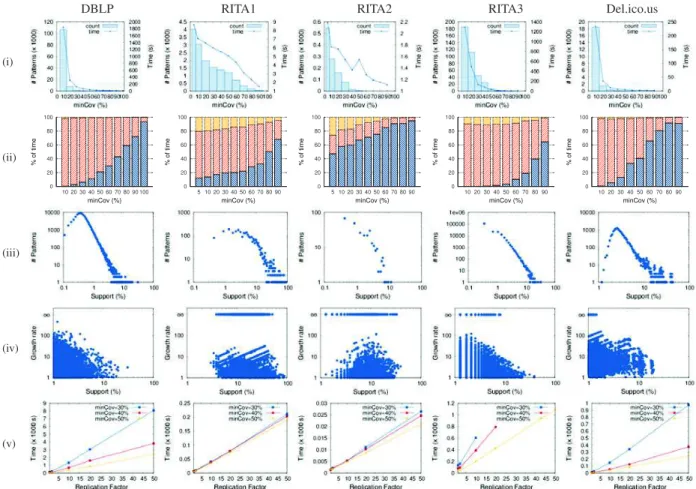
Impact of minCov parameter: We observe on Figure 3 (row
(i)) the impact of the minCov value on the running time
and the number of discovered patterns. The pruning ability
of the minCov parameter is verified. The figures show that
considering low minCov values is difficult, but Figure 2
provides the explanation: it often happens that the support is significantly smaller than the coverage.
Runtime distribution: TRIGAT consists of three main steps: The discretization, the discovery of closed triggering patterns,
Figure 2: Distribution of coverage and support for datasets DBLP (minCov=10%, left) and RITA1 (minCov=70%, right).
and the computation of the growth rate values. Figure 3 (row (ii)) reports, for each dynamic graph, the allocation of the running time among these three steps. We observe that the growth rate computation is negligible whatever the considered
dynamic graph and minCov value. The lower minCov, the
more time is spent to mine patterns. Reversely, for high minCov values, the discovery of closed triggering patterns is very fast. Besides, since the time needed to compute the
evolutions (discretization) is constant regardlessminCov, this
step is predominant for highminCov values.
Distribution of pattern supports: Figure 3 (row (iv)) reports the distribution of the discovered patterns w.r.t. the support.
TheminCov value has been chosen to be the lowest feasible
value for each dynamic graph accordingly to Figure 3 (row (i)). We observe that most of the extracted patterns have a very low support size compared to their coverage one. This point is even more obvious on the DBLP dynamic graph since many patterns have a very low support, i.e., less than 1%. This is particularly interesting since we can mine triggering patterns having a very low support without considering the
traditional minSupp constraint. Furthermore, these covering
patterns are insightful w.r.t. the growth rate. Indeed, we now aim at studying how triggering are the mined patterns by visualizing the triggering patterns within the 2-dimensional
space (Support, Growth rate). Intuitively, the bigger the
growth rate of the pattern!L, R$, the more decisive L for R.
Figure 3 (row (iv)) reports our results. Patterns with an infinite growth rate (∞) are known as jumping patterns, their sequence
L only appears in sequences of ∆R. Such a pattern is of
crucial interest since it means that whenever a vertex supports
the pattern !L$, it also supports the triggering pattern !L, R$.
Interestingly, apart from the DBLP dynamic graph, jumping patterns have been discovered in every dynamic graph, expect in DBLP where the growth-rate can reach a important value
of100. Conversely, triggering patterns, that have a low growth
rate, are of less interest and can be pruned during the final step. TRIGAT can discover patterns simultaneously highly discriminant and covering, either with high or low support. Impact of the number of vertices on the execution time:
We evaluate the robustness of TRIGAT w.r.t.|V |. Each of the
five dynamic graphs have been replicated as follows. Let n
be a replication factor, each graph is copiedn times resulting
in n disconnected graphs at each timestamp: it is guaranteed
that the set of triggering patterns remains identical whatever
the value of n. Figure 3 (row (v)) reports experiment results
with different minCov values. The results are very similar
for all datasets. As expected, the running time is linearly
correlated with the replication factor. The higher theminCov,
the stronger is the slope of the curve: TRIGAT can deal with dynamic graphs having up to 150K vertices.
C. Qualitative interpretation:
We now present some triggering patterns ,L, R-, written
L → R to ease reading, and study their usefulness on the
aforementioned networks.
DBLP: We set the minimal coverage threshold to 20%. One
may argue that this threshold is too high when dealing with real-world data. However, we shown that the support of a pattern can be much smaller than its coverage: In Figure 4, the
DBLP RITA1 RITA2 RITA3 Del.ico.us (i) (ii) 0 20 40 60 80 100 10 20 30 40 50 60 70 80 90 100 % of time minCov (%) 0 20 40 60 80 100 5 10 20 30 40 50 60 70 80 90 % of time minCov (%) 0 20 40 60 80 100 5 10 20 30 40 50 60 70 80 90 % of time minCov (%) 0 20 40 60 80 100 10 20 30 40 50 60 70 80 90 % of time minCov (%) 0 20 40 60 80 100 10 20 30 40 50 60 70 80 90 % of time minCov (%) (iii) (iv) (v)
Figure 3: Reports of the quantitative experiments: (i) Runtimes and number of patterns, (ii) Distribution of the execution times
, (iii) Support distribution, (iv) Growth rate vs support, and (v) Scalability test withn dataset replications.
minCov = 10% threshold induces the extraction of patterns
with a support less than 1% (minGR = 1). The mining task
(including pre/post processing) takes307 seconds and returned
3, 261 patterns. The growth rate distribution for those patterns
ranges from 1 to 87, with a mean value of 4.5 and standard
deviation of 3.6. Table II gives the top-10 patterns with a
growth rate greater than50. Their support is in average around
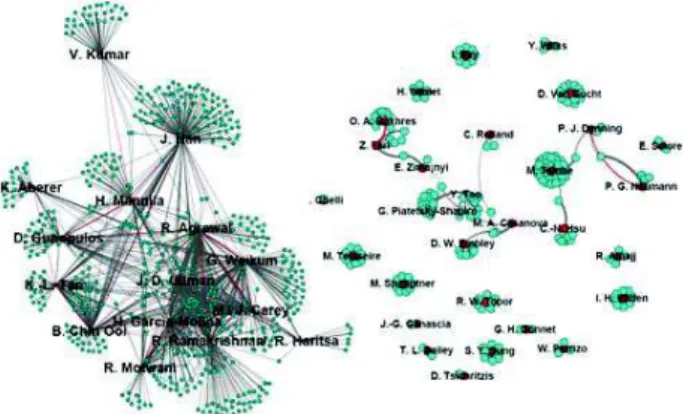
1% and the coverage around 22%, thus a high ρ value. These patterns explicit the conferences or journal venues that strongly impact and/or explain one’s collaborations or authority in the DBLP network. For example, the first pattern tells us about the impact of publishing more in the IEEE Transactions on Knowledge and Data Engineering. The Figure 4 (left) gives the subgraph induced by the support (labeled in red), and the coverage: the high density reveals a community aspect. In
contrast, the graph of pattern8 is much sparser (Figure 4 right)
which may reflect that publishing at VLDB triggers a positive variation of the author degree in the graph, for authors that cover well the graph (high coverage) but do not work together (low density). As such, one can be interested in querying about a specific conference. Let us continue with the example of the VLDB conference: we wonder if publishing in VLDB, and probably presenting there, could be an interesting start for increasing one’s degree, i.e. making collaborations. We query the top-k patterns w.r.t. growth rate that involve VLDB in the
left hand-side and the degree in the right-hand side. All the
patterns returned have a growth rate higher than20. Consider
now the IEEE ICDM conference: the top pattern that involves
it has a growth rate of5 and tells us that publishing at ICDM
may help to be more central in the co-authoring graph. The lower growth rate (5) when comparing with VLDB (20) can be explained by the fact that ICDM is younger than VLDB.
RITA1: With minCov = 10%, TRIGAT extracts 1, 922
jumping patterns (Figure 3 row (iv)). To retrieved the most
in-fluential airports that were disturbed by09/11 event, we
com-pute the ratioρ of coverage divided by support: the higher this
ratio, the more potentially influential. The top extracted pattern is{#Canceled+}{Degree−, Closeness−, N umCliques−,
P agerank−, Betweennes−} → Degree+ which has a support
of5, a coverage of 144, and ρ = 28.8, i.e. in average an airport
of the support is connected to29 airports do not belong to the
support. By considering the sequences of∆ that support this
pattern, we observe that the two first itemsets always appear
on days11 and 12 while the last itemset appears on days 13
or14. This pattern tells us that between September 11 and 12
an increase of canceled flights has been observed, followed the next day by a decrease of several centrality indexes, which
triggered a degree increase one or two day later7 .
7As reported at http://en.wikipedia.org/wiki/Closings and
Rank Pattern Support Coverage Growth rate ρ 1 {closeness− 1}, {IEEET ransKnowlDtEn +}, {numCliques+ 1} → {numCliques−1} 15 578 87.4 38.5 2 {clustering++ 1 , degree ++ 1 }, {Journal ++, eigenvector++ 2 } → {eigenvector ++ 3 } 31 546 71.6 17.6 3 {ICDE+ , numCliques+ 1} → {numCliques−1} 22 606 64.1 27 4 {eigenvector++ 1 , degree ++ 1 }, {V LDB ++ , degree++ 2 } → {degree ++ 3 } 29 580 63.8 20 5 {eigenvector++ 1 , clustering ++ 1 }, {Journal ++ , eigenvector++ 2 } → {eigenvector ++ 3 } 36 619 59.3 17.19
6 {ACM T ransDBSys+}, {numCliques+
1} → {numCliques−1} 20 547 58.3 27.35 7 {eigenvector++ 1 }, {Journal ++, betweennes++ 3 } → {betweennes ++ 4 } 20 587 58.4 29.35 8 {eigenvector++ 1 }, {V LDB ++, degree++ 2 } → {degree ++ 3 } 30 623 56.47 20.7 9 {SIGM OD−}, {numCliques+ 1} → {numCliques−1} 32 754 53.3 23.56 10 {closeness− 1}, {SIGM OD−}, {numCliques + 1} → {numCliques−1} 18 552 52.4 30.6
Table II: Top ten patterns of the DBLP co-authorship network according to the growth rate value.
Figure 4: The patterns ranked 1st (left) and 8th (right) from
the DBLP network w.r.t. growth rate. Labeled vertex (in red) represent the support, while all vertices form the coverage.
RITA2: This dynamic graph is set up to analyze the impact of 09/11 event on the US air traffic with a higher temporal granularity and a larger interval of time surrounding 09/11.
We set the minimum coverage threshold to 10% and
ex-tract 278 patterns and keep the 208 jumping ones. As we
a priori know that 09/11 led to an important number of
canceled flights, we only retain the 25 patterns that contain
this descriptor variation and sort them by support. For the 20 first patterns, it appears that the increase of canceled flights arises at the time of the tragedy. For example, the pattern
{#Canceled+
}{#Canceled−}, {numCliques−, Betweeness+
}
→ numCliques+
with (support=8, coverage=61) means that
8 airports, covering more than 25% (23461) of the network,
underwent an increase of their canceled flights, followed in another month by a decrease of this quantity and next by a topological variation. This lead some months later to an increase of the number of cliques. Now we should pay attention to when those variations happened. The first itemset always happened in September 2001. The second appeared at different months between December 2001 and January 2002 while the last itemset arose the month after the second itemset. In all the cases, the triggered topological variation happened in March 2002, which suggest a back to the normal of the US air traffic,
which is not contradicted by the IATA conclusions8.
RITA3: On this network, TRIGAT extracts185, 486 patterns
with minCov = 10%. To observe the impact of the Katrina
hurricane on the US airport traffic, we filter the patterns with a syntactic constraint enforcing an increase on the number of canceled flights and on the number of diverted flights.
It selects 7, 427 patterns among which 16 have a support
8http://www.iata.org/pressroom/documents/impact-9-11-aviation.pdf
higher than 5. Their coverage varies between 25% and 35%,
with small growth rate, except the following pattern that is
a jump: {Cancelled+
, DelayAtDeparture+}, {#Diverted−,
#Departure−, #Arrival−} → {closeness−
1}. All the
airports supporting this pattern are located in the
US West coast where Katrina raged. The itemset
{#Diverted−, #Departure−, #Arrival−} happened
during the week of Katrina’s highest activity.
del.icio.us: We are here interested to discover topics of
bookmarks (i.e. user tags) that may trigger a topological change. For example, if a user has more bookmarks of a given topic, does it make this user more followed by the
others? We set the minimum coverage to 10% and extract
27, 048 patterns among which 1, 424 ones conclude on a positive variation of a topological attribute. We ranked them
w.r.t their growth rate. The 30 first patterns have a growth
rate higher than 2.5 with a maximum of 12 and an average
of 4.16. Support and coverage cardinalities are roughly the
same with an average of respectively 13 and 198 (out of
1867 users). Each pattern contains at most two attributes that denotes a variation of a topic, and there is no negative variation. Interestingly, most of those topics are either among how-to, tutorial, web design, visualization, which denote probably a “teaching triggering”, or among video and community which are more “social triggering”.
Finally, note that TRIGAT is able to capture synchronous discriminant behaviors: triggering patterns whose itemsets appear at the same timestamps in the supporting sequences
of ∆, as it was observed in the RITA networks. Besides,
TRIGAT is able to discover asynchronous triggering patterns
whose itemsets appear at different timestamps in the sup-porting sequences. This is the case for the DBLP network, since it depicts scientific careers of researchers with different experiences (PhD student, junior scientist, professor, etc.).
VI. RELATEDWORK
Many works dealing with dynamic graphs have been pro-posed for a decade aiming at characterizing either the graph evolution by focusing on some topological properties [27], or the graph evolution by means of patterns/rules. Inokuchi and Washio [14] define frequent induced subgraph subsequence, i.e. subgraph subsequence whose isomorphic occurrences ap-pear frequently in a graph sequence collection. In [22], the authors extract frequent planar sub-graphs in a sequence of planar graphs and propose spatio-temporal patterns extracted from the occurrence graph. [24] proposes an algorithm to extract evolving patterns, i.e. pseudo-cliques which appears in consecutive timestamps with slight evolutions. [1] mines the evolution of conserved relational states, i.e. sequences of time-conserved pattern on consecutive time. Yang et al. devise an
algorithm to identify the most frequently changing component [29]. You and Cook [30] compute graph rewriting rules that describe the evolution between consecutive graphs. These rules are then abstracted into patterns representing the dynamics of graphs. [2] extract patterns based on frequency and derive evolution rules to solve prediction problems [5].
All the above works only focus on the graph structure and its evolution. They do not take into account the existence of attributes related to the vertices. Several approaches have been proposed to discover new insights in static attributed graphs. The pioneering work [18] proposes a method to find dense homogeneous subgraphs (i.e., subgraphs whose vertices share a large set of attributes). Similar to this work, G¨unnemann et al. [13] propose a method based on subspace clustering and dense subgraph mining to extract non redundant subgraphs that are homogeneous with respect to vertex attributes. Silva et al. [26] extract pairs of dense subgraphs and Boolean attribute sets such that the Boolean attributes are strongly associated with the dense subgraphs. Similarly in [19], the authors in-troduce the problem of mining maximal homogeneous clique sets. Another approach is presented in [16] in which the authors propose a probabilistic approach to both construct the neighborhood of a vertex and propagate information into this neighborhood. Following the same motivation, Sese et al. [25] extract (not necessarily dense) subgraph with common itemsets. In [23], the authors propose to mine the graph topology of a large attributed graph by finding regularities among vertex descriptors.
None of work mentioned above attempts to rely the graph structure evolutions to the evolution of vertices’ attribute values. In [9], the authors define a new a pattern that relies on the graph structure and the temporal evolution of the attribute values. It enables to discover set of vertices satisfying a maximum diameter constraint that follow the same trends w.r.t. some attributes, but it does not aim at characterizing local structure changes by sequence of trends.
VII. CONCLUSION
Triggering patterns are sequences of variations of vertex attribute values that may trigger topological changes in a dynamic attributed graph. Our methodology relies on closed sequence mining, where each vertex is encoded by a sequence of its variations. To assess the interest of a pattern, both growth-rate and coverage are studied: the growth-rate gives the discrimination power of a sequence of variations to explain a topological change, while the coverage tells us about the diffusion potential of the attributes changes towards vertices of its neighborhood. We experimented with this original ap-proach, and demonstrate the capability of triggering patterns to explain topological changes by attribute variations in real-world dynamic graphs. These case studies show the capability of TRIGAT to discover sensible patterns in feasible time.
REFERENCES
[1] R. Ahmed and G. Karypis. Algorithms for Mining the Evolution of Conserved Relational States in Dynamic Networks. In ICDM, pages 1–10. IEEE, 2011.
[2] M. Berlingerio, F. Bonchi, B. Bringmann, and A. Gionis. Mining Graph Evolution Rules. In ECML/PKDD, pages 115–130, 2009.
[3] H. Blockeel, T. Calders, ´E. Fromont, B. Goethals, A. Prado, and C. Robardet. An inductive database system based on virtual mining views. Data Min. Knowl. Discov., 24(1):247–287, 2012.
[4] J.-F. Boulicaut, L. D. Raedt, and H. Mannila, editors. Constraint-Based
Mining and Inductive Databases, LNCS (3848). Springer, 2005.
[5] B. Bringmann, M. Berlingerio, F. Bonchi, and A. Gionis. Learning and predicting the evolution of social networks. IEEE Intelligent Systems, 25(4):26–35, 2010.
[6] I. Cantador, P. Brusilovsky, and T. Kuflik. Information heterogeneity and fusion in recommender systems. In RecSys. ACM, 2011. [7] T. H. Cormen, C. E. Leiserson, R. L. Rivest, and C. Stein. Introduction
to Algorithms (3. ed.). MIT Press, 2009.
[8] P. O. V. de Melo, C. Faloutsos, and A. A. F. Loureiro. Human dynamics in large communication networks. In SDM. SIAM, 2011.
[9] E. Desmier, M. Plantevit, C. Robardet, and J.-F. Boulicaut. Trend mining in dynamic attributed graphs. In ECML/PKDD, 2013. [10] G. Dong and J. Li. Efficient mining of emerging patterns: Discovering
trends and differences. In KDD, pages 43–52, 1999.
[11] M. Girvan and M. E. Newman. Community structure in social and biological networks. Proceedings of the National Academy of Sciences, 99(12):7821–7826, 2002.
[12] A. Goyal, F. Bonchi, L. V. S. Lakshmanan, and S. Venkatasubramanian. On minimizing budget and time in influence propagation over social networks. Social Netw. Analys. Mining, 3(2):179–192, 2013. [13] S. G¨unnemann et al. Subspace clustering meets dense subgraph mining:
A synthesis of two paradigms. In ICDM, pages 845–850, 2010. [14] A. Inokuchi and T. Washio. Mining frequent graph sequence patterns
induced by vertices. In SDM, pages 466–477. SIAM, 2010.
[15] M. Jiang, P. Cui, R. Liu, Q. Yang, F. Wang, W. Zhu, and S. Yang. Social contextual recommendation. In CIKM, pages 45–54, 2012. [16] A. Khan, X. Yan, and K.-L. Wu. Towards proximity pattern mining in
large graphs. In SIGMOD, pages 867–878. ACM, 2010.
[17] J. Leskovec, K. J. Lang, A. Dasgupta, and M. W. Mahoney. Statistical properties of community structure in large social and information networks. In WWW, pages 695–704. ACM, 2008.
[18] F. Moser, R. Colak, A. Rafiey, and M. Ester. Mining cohesive patterns from graphs with feature vectors. In SDM, pages 593–604. SIAM, 2009. [19] P.-N. Mougel, C. Rigotti, M. Plantevit, and O. Gandrillon. Finding maximal homogeneous clique sets. Knowledge and Information
Sys-tems, pages 1–30, 2013.
[20] P. K. Novak, N. Lavraˇc, and G. I. Webb. Supervised descriptive rule discovery: A unifying survey of contrast set, emerging pattern and subgroup mining. J. Mach. Learn. Res., 10:377–403, June 2009. [21] M. Plantevit and B. Cr´emilleux. Condensed representation of sequential
patterns according to frequency-based measures. In Adv. in Intelligent
Data Analysis, LNCS (5772), pages 155–166. Springer, 2009.
[22] A. Prado, B. Jeudy, ´E. Fromont, and F. Diot. Mining spatiotemporal patterns in dynamic plane graphs. Intell. Data Anal., 17(1):71–92, 2013. [23] A. Prado, M. Plantevit, C. Robardet, and J.-F. Boulicaut. Mining graph topological patterns: Finding co-variations among vertex descriptors.
IEEE TKDE, 99:1, 2012.
[24] C. Robardet. Constraint-based pattern mining in dynamic graphs. In
ICDM, pages 950–955. IEEE, 2009.
[25] J. Sese, M. Seki, and M. Fukuzaki. Mining networks with shared items. In CIKM, pages 1681–1684. ACM, 2010.
[26] A. Silva, W. Meira, and M. J. Zaki. Mining attribute-structure correlated patterns in large attributed graphs. PVLDB, 5(5):466–477, 2012. [27] H. Tong, S. Papadimitriou, J. Sun, P. S. Yu, and C. Faloutsos. Colibri:
fast mining of large static and dynamic graphs. In KDD, 2008. [28] X. Yan, J. Han, and R. Afshar. Clospan: Mining closed sequential
patterns in large databases. In SDM, pages 166–177. SIAM, 2003. [29] Y. Yang, J. Yu, H. Gao, J. Pei, and J. Li. Mining most frequently
changing component in evolving graphs. WWW, pages 1–26, 2013. [30] C. H. You, L. B. Holder, and D. J. Cook. Learning patterns in the
dynamics of biological networks. In KDD, pages 977–986, 2009. [31] M. J. Zaki and C.-J. Hsiao. Charm: An efficient algorithm for closed