PRODUCTION DE CARBONE ORGANIQUE DISSOUS PAR LE COMPLEXE MACROPHYTES-ÉPIPHYTES : EFFETS DE FACTEURS PHYSICO-CHIMIQUES,
IMPLICATIONS SUR LA PRODUCTIVITÉ DES COMMUNAUTÉS DE MACROPHYTES ET INCIDENCE À L'ÉCHELLE DE L'ÉCOSYSTÈME
THÈSE PRÉSENTÉE
COMME EXIGENCE PARTIELLE DU DOCTORAT EN BIOLOGIE
PAR
MAUD DEMARTY
UNIVERSITÉ DU QUÉBEC À MONTRÉAL Service des bibliothèques
Avertissement
La diffusion de cette thèse se fait dans le respect des droits de son auteur, qui a signé le formulaire Autorisation de reproduire et de diffuser un travail de recherche de cycles
supérieurs (SDU-522 - Rév.01-2üü6). Cette autorisation stipule que «conformément
à
l'article 11 du Règlement no 8 des études de cycles supérieurs, [l'auteur] concèdeà
l'Université du Québecà
Montréal une licence non exclusive d'utilisation et de publication de la totalité ou d'une partie importante de [son] travail de recherche pour des fins pédagogiques et non commerciales. Plus précisément, [l'auteur] autorise l'Université du Québecà
Montréalà
reproduire, diffuser, prêter, distribuer ou vendre des copies de [son] travail de rechercheà
des fins non commerciales sur quelque support que ce soit, y compris l'Internet. Cette licence et cette autorisation n'entraînent pas une renonciation de [la] part [de l'auteur]à
[ses] droits moraux nià
[ses] droits de propriété intellectuelle. Sauf entente contraire, [l'auteur] conserve la liberté de diffuser et de commercialiser ou non ce travail dont [il] possède un exemplaire.»Merci à Renée Gravel, Véronique Gauvin, Catherine Blain et Martine Camiré sans qui l'échantillonnage aurait été irréalisable ... il paraît que c'est dans J'adversité que l'on reconnaît ses amis!
Merci à mes piliers moraux et affectifs: Jean-Jacques, Florence, Marion, Yann, Madelaine & lafamilia pour le côté est de l'Atlantique; Charles et ma grande famille d'adoption qui m'a réchauffé le cœur pas seulement en hiver; mes amis.
TABLE DES MATIÈRES
LISTE DES FIGURES vii
LISTE DES TABLEAUX ix
LISTE DES ABRÉVIATIONS xi
INTRODUCTION GENERALE 1
CHAPITRE 1
IN SITU DOC RELEASE BY SUBMERGED MACROPHYTE-EPIPHYTE COMMUNITIES IN
SOUTHERN QUEBEC LAKES 9
1.1 ABSTRACT (RÉSUMÉ) 9
1.2 INTRODUCTION 1 1
1.3 MATERIAL AND METHODS 13
1.4 RESULTS 19
1.5 DISCUSSION 27
1.6 REFERENCES 33
CHAPITRE II
NUTRIENT AND CO2 EFFECTS ON DOC RELEASE RATES BY SUBMERGED
MACROPHYTES-EPIPHYTES COMPLEX IN SOUTHERN QUEBEC LAKES 39
2.1 ABSTRACT (RÉSUMÉ) 39
2.2 INTRODUCTION .4 1
2.3 MATERIAL AND METHODS .43
2.4 RESULTS 47
2.5 DISCUSSION 59
2.6 REFERENCES 63
CHAPITRE III
ROLE OF PC02 IN IN SITU DOC RELEASE BY THE SUBMERGED MACROPHYTE-EPIPHYTE
COMPLEX IN ICHETUCKNEE RIVER, FLORIDA 67
3.1 ABSTRACT (RÉSUMÉ) 67
3.2 INTRODUCTION 69
3.3 MATERIAL AND METHODS 71
3.4 RESULTS 73
3.6 REFERENCES 81 CHAPITRE IV
LINK BETWEEN DISSOLVED ORGANIC CARBON RELEASE, BICARBONATE UPTAKE AND RESULTING PRODUCTIVITY BY FRESHWATER MACROPHYTE-EPIPHYTE COMPLEX 83
4.1 ABSTRACT (RÉSUMÉ) 83
4.2 INTRODUCTION 85
4.3 MATERIAL AND METHüDS 87
4.4 RESULTS 91
4.5 DISCUSSION 99
4.6 REFERENCES 103
CHAPITRE V
QUANTITATIVE CONTRIBUTION OF DOC RELEASE BY THE MACROPHYTE-EPIPHYTE
COMPLEX IN DIFFERENT ECOSYSTEMS 107
5.1 ABSTRACT (RÉSUMÉ) 107
5.2 INTRODUCTION 109
5.3 MATERIAL AND METHODS III
5.4 RESULTS AND DISCUSSION 113
5.5 REFERENCES 117
LISTE DES FIGURES
Figure Page
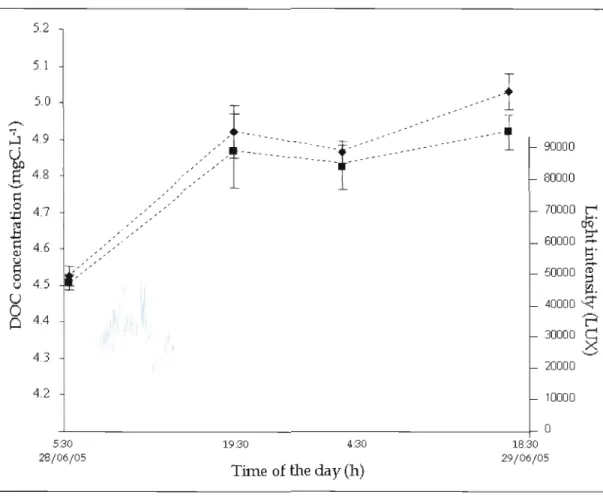
1.1 Trend in DOC concentration (left axis) and light intensity (right axis) during 36 hours in two transparent chambers containing macrophytes (. and
+
respectively) in L. Stukely in 2005. Bars represent standard error (n=4) 21 1.2 Day-time and night-time general mean DOC rates (with data from ail years, inmgC.m-2.h-l) for transparent chambers containing macrophyte, at L. d'Argent, L. Bowker, L. Peasley, L. Stukely, L. Trois lacs (data of 20/06/05 apart, L. Trois lacs*)
and L. Waterloo. Bars represent standard error. 22
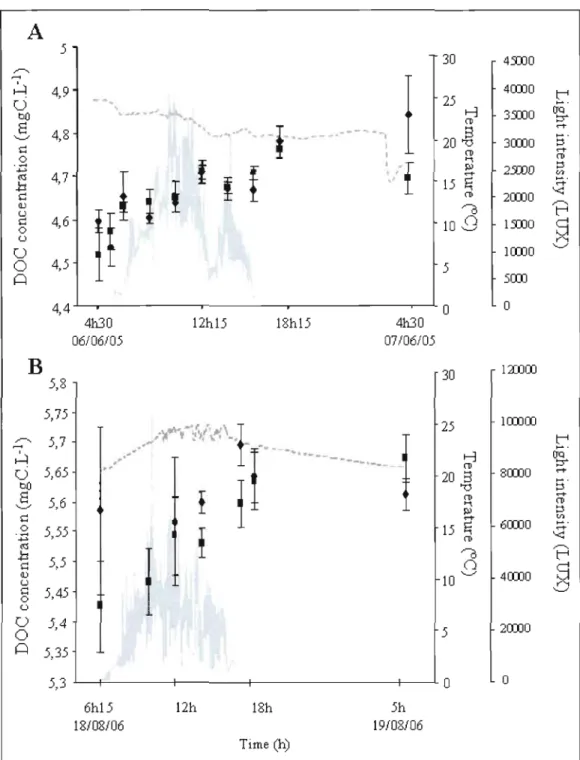
1.3 Trends in DOC concentration (left axis), light intensity and temperature (right axis) for benthic chambers containing macrophytes, during time courses experiment in L. Stukely, in 2005 (A) and 2006 (B). Bars represent standard deviation 26 2.1 Averaged uncorrected DOC release rates by macrophyte-epiphyte complex by
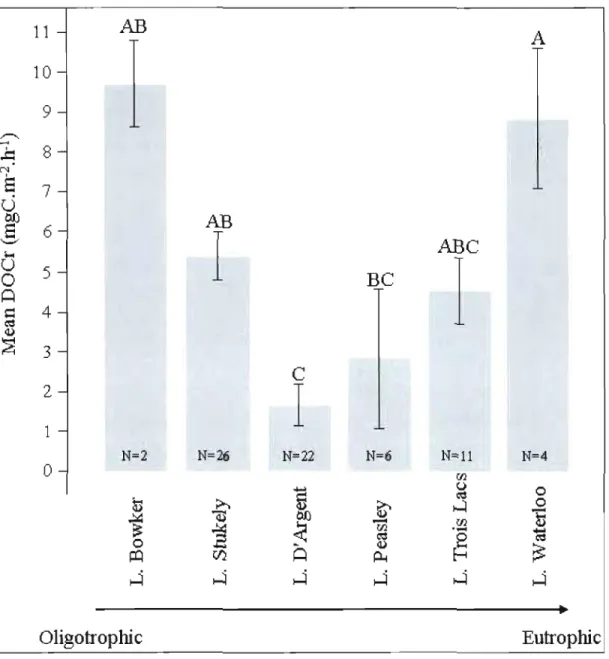
lakes along the traphic status gradient. Bars represent standard error and letters
correspond ta Tukey-Kramer HSD groups 48
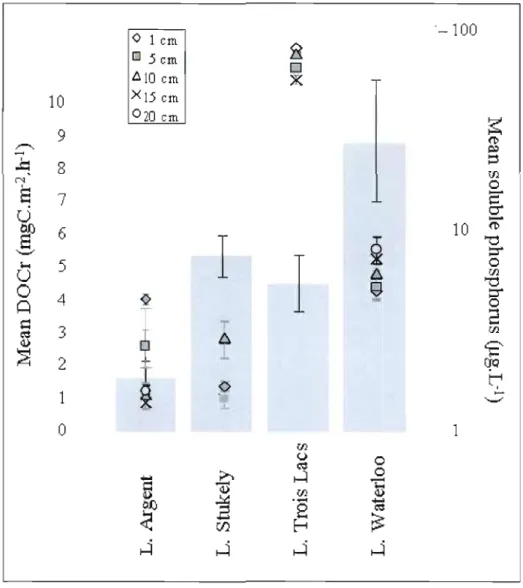
2.2 Mean DOC release rates (left axis, histogram) and mean soluble phosphorus (right axis, +, ., Ji.. , X, and. representing the different sampling depth) for four studied
lakes. Bars represent standard error. 49
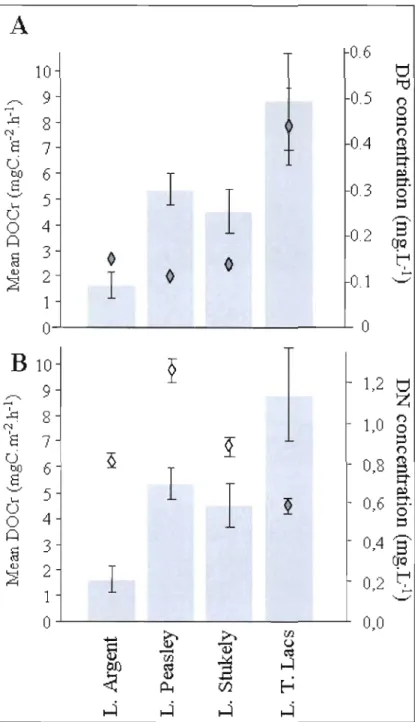
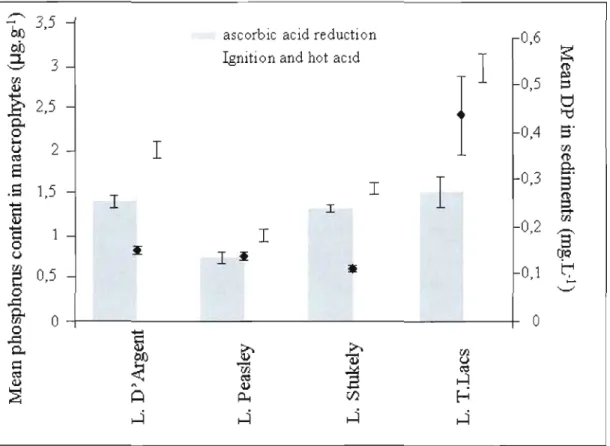
2.3 Mean DOC release rates (Ieft axis and histogram) in comparison with dissolved phosphorus (A, right axis and +) and dissolved nitrogen (B, right axis and +) for four studied lakes. Bars represent standard erraI". 5 1 2.4 Mean phospharus content in macrophytes measured either by ascorbic acid
reductian or by ignition and hat acid method (Ieft axis, histograms) in comparison with mean dissolved phosphorus in sediments (right axis, +) for four studied lakes.
Bars represent standard error. 54
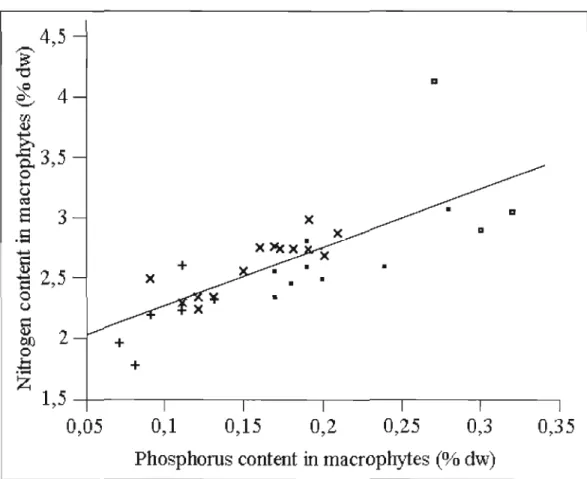
2.5 ~elationship between nitrogen and phosphorus content in macrophytes. • , +, X, and representing samples of L. d'Argent, L. Peasley, L. Stukely, and L. Trois Lacs
respectively 55
2.6 Relationships between DOC release rates (left axis) and pC02 measured at the beginning of the experiment (right axis) with either data from transparent benthic chambers in natural pC02 condition only (TM, fig.6 A), or with data from TM chambers (.) and TM chambers enriched in CO2 (TM+C02, X , fig.6 B ) 56 2.7 Mean pC02 (left axis fig.7 A) and mean DOC release rates (left axis fig.7B) for
chambers enriched in CO2 (TM+C02) for four studied lakes. Bars represent
standard error 57
3.1 Trends in DOC concentration (Ieft axis) and light intensity (right axis) for benthic chambers containing either macrophytes (.) or naked sediments (.), during 24h experiments beginning at sunrise (A) or sunset (B). Bars represent standard
deviation 75
3.2 Relationships between DOC release rates by the entire community (DOCr) or by the macrophyte epiphyte complex (DOCme) and CO2 concentration (~M) measured
at sunrise (A and B respectively) 76
3.3 Comparison of the relationships obtained for Ichetucknee River (solid lines) and Quebec lakes (dashed lines), between DOC release rates by the entire community (DOCr) or DOC release by the macrophyte-epiphyte complex (DOCme) and CO2 concentration (~M) measured at sunrise (A and B respectively) 79 4.1 Daytime and nighttime changes in dissolved inorganic carbon (DIC; in mgC.m·2.h'
') for L. d'Argent, L. Peasley, L. PeasJey, L. Trois Lacs (Quebec) and lchetucknee
R. (Florida) 92
4.2 Relationships between net community productivity (A) or HCO,' uptake (B) and
LISTE DES TABLEAUX
TabJeau Page
J.2 Mean daily and nightly DOC release rates for five studied lakes with corresponding daily temperature and received light inside the benthic chamber. Myrio, P. amp, P. rich, P. rob, are abbreviations for Myriophyllum spicalum, Polamogellon amplifollius, Potamogetton richardsonii and Potamogetton robinsii respectively 20 4.1 Maximum, minimum, means and standard deviation (SD) of net community
productivity (NCP), gross primary productivity (GPP), respiration (R) and net primary productivity of macrophyte-epiphyte complex (NPPme), and percentage of dissolved inorganic carbon (DIC) variation due to variation in either CO2 or HC03'
for Quebec (QC) and Florida (FL) studied systems 93
4.2 Maximum, minimum, means and standard deviation (SD) of daily and nightly HC03- and C02 variations for Quebec (QC) and Florida (FL) studied systems 95 5.1 Relative importance of DOC released by the macrophyte-epiphyte complex relative
to DOC loads from watersheds in Quebec lakes. Estimations for July and August, in 2004 and 2005. MB corresponds to total standing macrophyte biomass density in lakes (in g.m-2), DOCm and DOCin are total DOC released by the macrophyte epiphyte complex at the whole-Iake scaJe (in kg.m-I) and total DOC inflowing from
the watershed (in kg.m-'), respectively. P is the percentage of total DOC Joad
attributable to macrophyte release 115
5.2 Estimations of the DOC load from release by the macrophyte-epiphyte complex versus from the DOC load from the springs in the Ichetuknee River (Fla). Macrophyte biomass and river surface area from Kurz et al. (2004). Spring
COD DIC
DM
DS DOC DOCme DN DP GPP NCP NPPme R TM TS TPCarbone organique dissous
Dissolved inorganic carbon
Dark benthic chamber on macrophytes
Dark benthic chamber on sediments
Dissolved organic carbon
Dissolved organic carbon released by macrophyte-epiphyte complex
Dissolved nitrogen
Dissolved phosphorus
Gross primary production
Net community production
Net primary productivity of the macrophyte-epiphyte complex
Respiration
Transparent benthic chamber on macrophytes
Transparent benthic chamber on sediments
INTRODUCTION GENERALE
De manière classique, la représentation schématique du cycle global de l'eau sur la Terre comprend l'océan, les nuages, la pluie et les rivières et fleuves qui ramènent cette eau vers l'océan. Les lacs en sont exclus et sont de ce fait perçus comme de simples réservoirs d'eau. D'autre part, dans l'imaginaire collectif ce sont des lieux qui ont une forte connotation négative puisque liés à d'innombrables monstres et légendes, et cela sur tous les continents. Or la science est depuis toujours guidée par la fascination, le désir des hommes de
comprendre leur environnement. Etant donné la faible popularité des lacs, on comprend pourquoi leur étude a longtemps été mise de côté par des scientifiques qui avaient tout à découvrir. L'idée est cependant apparue à certains que ces systèmes pouvaient servir à comprendre les phénomènes océaniques à petite échelle. Ainsi en 1892, Forel a consacré une nouvelle science, la limnologie, qu'il a définie comme étant « l'océanographie des lacs» et qui consistait alors plus en des études hydrologiques que biologiques. Cette science a pris son essor au début du 20e siècle avec la fondation en 1922 de la Société Internationale de
Limnologie et est à l'origine d'importantes contributions en écologie théorique (i.e. travaux de Odum et Hutchinson).
Dans le contexte mondial actuel où les ressources en eau et l'excès de CO2 font partie des
débats quotidiens, les limnologistes sont au cœur des préoccupations scientifiques et populaires. En effet, il a non seulement été démontré que les eaux continentales jouent un rôle non négligeable dans la production de gaz à effets de serre (Cole el al., 2007; Duane et Prairie, 2005) mais aussi que jusqu'ici le nombre de petits lacs avait été largement sous estimé (Downing el al., 2006). Finalement il a été possible d'estimer que la contribution globale des lacs à l'échelle planétaire est du même ordre de grandeur que celle des forêts et des océans (Prairie, communication personnelle). La reconnaissance de la limnologie comme science permettant de comprendre des phénomènes d'échelle planétaire appuie la thèse d'une planète-écosystème (Lovelock, 1979) et démontre que le sectarisme en science entraîne la négligence de phénomènes pourtant majeurs. Malgré cette évidence on trouve un
cloisonnement des idées au sein même des disciplines et également en limnologie. En effet il semble que les origines océanographiques de cette discipline aient conduit à une inclination
des études pour la zone pélagique (zone plus profonde) au détriment des études portant sur la zone benthique (zone littorale, définie par la présence d'algues ou plantes aquatiques; Vadeboncoeur, 2002). Par exemple, dans le contexte d'étude des émissions de gaz à effet de serre, des mesures du métabolisme de lacs ont mis en évidence une production de CO2 liée à
une hétérotrophie de la zone pélagique (Del Giorgio, 1993), c'est à dire une consommation de matière organique par le bactérioplancton plus importante que la production par le
phytoplancton. Il a été montré que le régime métabolique des lacs (autotrophe vs.
hétérotrophe) est lié à leur concentration en Carbone Organique Dissous (COD; Prairie et aL. 2002), et que les apports de COD d'origine terrestre participent au régime métabolique des lacs (Tranvik 1992; Pace et aL. 2004; Carpenter et aL. 2005; Kritzberg et al. 2006) ce qui appuie les observations d' hétérotrophie. Cependant ces études ont été faites dans un compartiment spécifique, l'épilirnnion de la zone pélagique, étant la couche chaude de surface. De plus ces études considèrent que tout ce qui n'y est pas produit dans ce
compartiment est d'origine allochtone, terme référant à une provenance extérieure au lac. On ne tient donc pas compte ici de la zone benthique des lacs qui, dans certains systèmes, est pourtant reconnue pour dépasser la productivité de la zone pélagique par la présence de macrophytes (Wetzel et S~mdergaard, 1998).
Les macrophytes, terme regroupant macroalgues, plantes vasculaires (Angiospermes) ou non (Bryophytes, Ptéridophytes), sont réparties selon leur habitat: émergentes, flottantes ou submergées (Kalff, 2002). Les lits de macrophytes, quand ils sont présents, peuvent être les principaux producteurs primaires des zones littorales lacustres et font partie des systèmes les plus productifs de la biosphère, c'est pourquoi certains auteurs proposent même que la zone littorale des lacs soit déterminée par la présence de macrophytes (Canfield et al. 1983). La productivité s'élève par exemple à 5000 à 7000 g poids sec/m2/an pour les espèces émergées Phragmites australis et Typha spp. (milieux tempérés tropicaux). En comparaison la
productivité des forêts équatoriales s'élève à 2200 g poids sec/m2/an (Ramade, 1994). La productivité des macrophytes submergées des eaux douces des zones tempérées est moins importante (de 500 à 1OOOg de poids sec/m2/an) cependant elles ont un fort potentiel de colonisation qui peut être estimé par la profondeur de Secchi et la pente littorale, déterminant
3
respectivement leur profondeur maximale de colonisation (Chambers et Kalff, 1985, Duarte et al., 1986) et la profondeur de la biomasse maximale (Duarte et Kalff, 1986).
Leur présence affecte globalement le fonctionnement des lacs en modifiant leur structure (e.g. zone filtrante), leur métabolisme (e.g. augmentation de la productivité), leur chimie (e.g. concentrations en éléments nutritifs), et leur physique (e.g. turbidité de l'eau) (Jeppensen et al., 1998). Les macrophytes représentent également une source importante de matière organique utilisable à divers niveaux trophiques et ceci à différents stades de leur vie. En effet, plusieurs espèces de macrophytes submergées présentent un développement en cohorte, ce qui se traduit par la présence simultanée de tissus vivants à différents stades de
vieillissement et de tissus en décomposition. La période de sénescence des macrophytes constitue une source de carbone sous deux formes: d'une part du COD provenant de la libération des contenus cellulaires dans le milieu et pouvant s'agréger en palticules (Otsuki et Wetzel, 1974 ; Alber et Valiela, 1994). d'autre part les tissus végétaux constitués de cellulose et de lignine, indigestes pour les invertébrés brouteurs, et dont la dégradation est
essentiellement bactérienne (Mann 1988). Wehr et al. (J 998) ont d'ailleurs montré en mésocosmes que le carbone issu des macrophytes sénescentes entraîne, dans la colonne d'eau, une augmentation de la teneur en chlorophylle a, une augmentation du taux de multiplication des cyanobactéries ainsi qu'une augmentation de l'abondance des
hétérotrophes non flagellés, des rotifères, des Daphnia pulicaria et des copépodes nauplii; cette source de carbone favorise également la production bactérienne (Findlay S. et al. 1986; Findlay et Sinsabaugh, 2002, Wehr et al. 1999).
D'autre part, depuis les années 1960, il est connu que les macrophytes submergées en croissance perdent une partie non négligeable de leur photosynthétat sous forme de COD (37,3% de la production primaire brute de la communauté, Kailov et Burlakova, 1969; Wetzel, 1969), phénomène également mis en évidence chez le phytoplancton (Fogg et al., 1965). Rapidement, des études ont porté sur la nature de ce COD relâché dans le milieu et ont montré qu'il s'agissait de sucres simples et d'acides aminés (Wetzel et Manny, 1972;
Godmaire et Nalewajko, ]
989).
Pour certaines espèces, in vitro, il a été montré que le taux de relargage à la lumière est significativement supérieur à celui observé lors d'incubation àl'obscurité (Sieburth 1969, Sondergaard 1981, Pregnall 1983, Nalewajko et Godmaire 1993). II semble donc que pour ces espèces le relargage de COD soit lié à la photosynthèse.
Cependant d'autres études sur des espèces différentes ont abouti à des conclusions opposées (Hough et Wetzel 1975, Barron et al 2003). Puisqu'il semblait anormal qu'un organisme dépense 1/3 de son énergie à fabriquer des molécules destinées à être relâchées dans le milieu, Sharp en 1977 s'est demandé si ce phénomène n'était pas du à des cellules en mauvais état (<< Do healthy ceUs do it ? »). II s'en est suivi la démonstration du contraire et l'arrivée de l'hypothèse suivante: la production de COD par les cellules vivantes en santé serait un phénomène d'évacuation des photosynthétats excédentaires en conditions limitantes en nutriments et donc inappropriées pour la synthèse de molécules plus complexe et
l'accumulation de biomasse (<< Overflow mechanism », Fogg 1983 ; Jensen 1984). Cette hypothèse suggère donc qu'en conditions limitantes en nutriments: (1) plus il y a de photosynthèse, plus il y de COD relâché dans le milieu; (2) il n'existe pas de rétro-inibition de la photosynthèse dans ces conditions. Suite à ces expériences en laboratoire ayant posé les bases théoriques du phénomène de COD relâché, plusieurs études in situ ont démontré que ces observations n'étaient pas des artéfacts dus à J'expérimentation in vitro et qu'il était possible de mesurer des taux de COD relâché et de les inclure dans les bilans de carbone des écosystèmes (Wetzel et Sondergaard, 1998; Ziegler et Benner, 1999; Barr6n et al., 2003 ; Marai'ion et al., 2004). Cependant ce type d'étude n'ajamais été effectué dans des systèmes dulcicoles, et les mécanismes influençant la production de COD restent très peu documentés (Godmaire et Nalewajko, 1990).
En nous plaçant dans le cadre de l'étude de la contribution des communautés de macrophytes submergées en croissance sur le métabolisme lacustre, nous avons donc non seulement quantifié leur production de COD in situ mais aussi étudié les facteurs influents en se basant sur l'hypothèse d'un lien positif entre photosynthèse et COD relâché (<< Overflow mechanism »). En tant que communauté de macrophytes submergées, nous considérons le complexe macrophytes-épiphytes. En effet, les macrophytes submergées offrent une grande diversité d'habitats pour des espèces épiphytes aussi bien dans l'espace (surface foliaire importante) que dans le temps. Sur la surface de la plante une matrice
5
autotrophes (diatomées, cyanobactéries) et hétérotrophes (bactéries et champignons); il en résulte un biofilm à métabolisme très élevé utilisant le COD relargué (Carpenter et Lodge, 1986) et les nutriments provenant de la plante mais aussi du milieu (Wetzel et Sondergaard, 1998). Pour étudier la physiologie des macrophytes il est nécessaire de s'affranchir de J'effet des épiphytes; par contre pour une étude comme la nôtre qui vise à comprendre le rôle des lits de macrophytes à l'échelle de l'écosystème, on considèrera le complexe épiphytes
macrophyes puisque ces organismes sont étroitement liés.
Notre cheminement a consisté en 5 étapes:
Dans le premier chapitre nous avons comme objectifs de mesurer la production de COD par les macrophytes des lacs du sud -est du Québec; d'étudier une possible différence entre espèces dominantes dans ces lacs; de savoir si des facteurs physiques affectant la
photosynthèse, comme la photopériode, la quantité de lumière reçue et la température
moyenne, ont un effet sur la production de COD. Selon notre hypothèse, nous nous attendons à voir (1) une différence entre espèces de par leurs différentes capacités photosynthétiques, (2) une augmentation du taux de COD relâché avec l'augmentation de la luminosité et de la température ambiantes. Notre dispositif expérimental de chambres benthiques in situ disposées sur les macrophytes nous a effectivement permis de mesurer une augmentation de COD durant le jour mais pas la nuit. Nos résultats montrent cependant que quantité de lumière reçue et température n'influencent pas les taux de COD relâché. De plus, les trois espèces de macrophytes étudiées (Myriophyllum spicatum, Potamogeton amplifolius,
Potamogeton richardsonii, angiospermes dominant dans les lacs étudiés) ne présentent pas de taux de COD relâché différents.
Pour le deuxième chapitre nous avons comme objectif de tester des facteurs chimiques comme la concentration en nutriments ou en CO2 sur les taux de COD relâché. Selon notre hypothèse nous nous attendons à observer une relation négative entre taux de COD relâché et les concentrations en phosphore et/ou azote dans les sédiments (principale source de
nutriments pour les macrophytes), et des relations positives avec le ratio C:N:P dans les plantes qui reflète les conditions de croissance des plantes, et la teneur en CO2 dans l'eau
(PC02). Nos résultats ne montrent aucune influence des nutriments sur les taux de COD
relâché. Par contre il apparaît clairement une relation négative entre teneur en CO2 et taux de
COD relâché. Ces résultats nous permettent de rejeter l' hypothèse de départ et nous
conduisent à une hypothèse alternative selon laquelle ce phénomène de production de COD
serait une réponse physiologique visant à parer une limitation en CO2 en agissant comme un
système de concentrateur de carbone (Carbon Concentrating Mechanism). Cette hypothèse est conservée dans les chapitres III et IV.
Le troisième chapitre vise à démontrer clairement l'effet de la teneur en CO2 dans l'eau
sur la production de COD par les communautés de macrophytes en croissance, en étudiant ce
phénomène le long d'un gradient naturel de CO2 dans une rivière de Floride (Ichetucknee
River). Dans cet écosystème très différent des lacs étudiés au Québec et avec une espèce
spécifique à ce milieu (Sagittaria kurziana ,. United State Department of Agriculture), nous
démontrons à nouveau que les taux de COD relâché dans nos chambres benthiques par les
communautés de macrophytes diminuent avec l'augmentation de la teneur en CO2. Ces
résultats corroborent donc notre hypothèse alternative.
Dans le quatrième chapitre, nous présentons la synthèse des données de productivité
mesurées dans les lacs du Québec et la rivière Ichetucknee (Floride) et nous étudions les
éventuelles relations entre taux de COD relâché et productivité. Nous montrons que la productivité nette des communautés étudiées au Québec est limitée par les concentrations en
CO2 dissous, alors que pour les communautés étudiées en Floride la productivité est soutenue
par la prise de HC03-. Finalement nous trouvons une relation générale entre l'utilisation du
HC03- comme source de carbone et les taux de carbone relâché par les macrophytes, ce qui
corrobore notre hypothèse.
Finalement, dans un cinquième chapitre, nous appliquons les taux de COD relâché calculés aux biomasses totales de macrophytes submergées mesurées dans nos écosystèmes. Nous obtenons une valeur de COD relâché extrapolable à l'échelle mensuelle et ainsi comparable à des données de COD apportées dans les systèmes par le bassin versant (allochtone). Nous montrons que la contribution du COD provenant des macrophytes par
7
rapport au COD allochtone est généralement faible mais peut par contre devenir majeure en cas de faibles précipitations (se traduisant par des apports allochtones réduits). Cet exercice d'extrapolation de nos résultats nous permet d'avoir une vision globale du phénomène étudié à l'échelle de l'écosystème et ainsi d'appréhender son impact pour le métabolisme global.
1.1
IN SITU DOC RELEASE BY SUBMERGED MACROPHYTE-EPIPHYTE COMMUNITIES IN SOUTHERN QUEBEC LAKES
Accepted for publication in Canadian Journal of Fisheries and Aquatic Sciences, May 2009.
Context: Questioning the possible implication of submerged macrophytes in carbon pool of lakes, we focus our research on the role of DOC release by macrophyte-epi phyte
communities and more particularly on the factors influencing DOC release, considering the hypothesis of the « Overflow mechanism ». The objectives of the first chapter are (1) to measure the DOC release by macrophyte-epiphyte complex in south-eastern Quebec lakes; (2) to compare the release by different dominant macrophytes species; (3) to study the effect of factor known to influence photosynthesis on the release.
ABSTRACT (RÉSUMÉ)
We studied the in situ release of dissolved organic carbon (DOC) by growing submerged freshwater macrophytes. Incubations with benthic chambers in five south-eastern Quebec Jakes show a net DOC production for different communities of Myriophyllum spicatum and Potamogeton spp. Daytime DOC release rates range from undetectable ta 9.7 mgc.m'2. h'l.
Although DOC release was restricted ta daylight hours and thus suggestive of a
photosynthesis-related process, we found no strong Iink between DOC release rates and concurrent illumination or temperature. We found no difference in DOC release rates between the 3 main colonizing species of the studied region. The overall mean DOC reJease rate was 4.57mgC.m,2. h'l (SD ± 0.65) or 56 I-lgc.g (dry weightrl.h'l (SD ± 8) which, we
suggest, can be used for extrapolations at the lake scale.
Keywords: macrophytes, lakes, DOC release, photoperiod, Myriophyllum spicatum, Potamogeton spp.
10
Nous avons étudié la production in situ de carbone organique dissous (COD) par des macrophytes d'eau douce en croissance. Des incubations ont été réalisées avec des chambres benthiques dans cinq lacs du sud-est du Québec, ce qui a mis en évidence une nette
production de COD par différentes communautés de Myriophyllum spicatum et de
Potamogeton spp. La production diurne de COD variait entre des valeurs indétectables et des o2
taux de 9.7 mgC.m .h'l. Bien que cette production soit uniquement diurne et de ce fait certainement liée à des processus photosynthétiques, nous n'avons pas pu mettre en évidence de lien entre production et quantité de lumière ou température, Par ailleurs nous n'avons pas trouvé de différence entre les productions de COD des trois principales espèces étudiées dans la région. Le taux moyen global de production de COD est de 4.57mgC.m,2. h" (SD ± 0.65) soit 56 f.lgc.g (poids sec)'l.h'l (SO ± 8), taux que nous pensons pouvoir utiliser pour des extrapolation à l'échelle des lacs.
2005; Kritzberg et al. 2006). The concept of net heterotrophy in lakes whereby ecosystem respiration exceeds gross primary production has considerably changed our view of how lakes support their living biota. This pattern of excess respiration is believed to be found mostly in oligotrophic systems with DOC concentrations> 5-6mg.L'1 (Del Giorgio and Peters 1993 and 1994; Del Giorgio et al. 1997; Prairie et al. 2002, Hanson et al. 2003) and is believed to be largely responsible for the CO2 supersaturation observed in most lakes of the
world (Cole et al. ]994, Sobek et al. 2003; Del Giorgio et al. 1999; Duarte and Prairie, 2005). However, recent studies have also shown that, in sorne lakes at least, pelagie net
heterotrophic metabolism can be observed simultaneously with CO2 undersaturation, i.e. with
a net CO2 influx from the atmosphere (Prairie el al. 2002). Such discrepant properties would
occur if a source of organic carbon metabolized in epilimnetic waters originated from elsewhere within the ecosystem. In such cases, net heterotrophy of the water column would not necessarily refJect the metabolic status of the whole ecosystem. Freshwater systems are among the ecosystems where this situation is most likely to occur because benthic primary production often dominates the overall productivity of the system, particularly in shallow oligotrophic lakes (Vadeboncoeur et al., 2003). Indeed, studies of lake metabolism that do not consider the potential role of the benthic zone are likely to yield a biased assessment of the overall metabolic balance. In particular, if benthic organic matter production is
translocated in sorne way to the water column and respired there, it cou Id lead to a net heterotrophy of the pelagie zone but not necessarily of the whoJe ecosystem. To our
knowledge, this hypothesis has been seldom explored in freshwater systems, largely because of the common rnisconception that benthic zone is not often quantitatively significant
(Vadeboncoeur et al., 2002). Yet, this situation has been described in marine systems by
Gazeau et al. (2005) who argued that benthic community dominated by macrophytes
(Posidonia oceanica) could pmtly balance the net heterotrophy of the planktonic
compartment, an idea supported by other studies as weil (Duarte and Cebrian, 1996; Gattuso
12
Macrophyte beds represent a potential DOC source to the open water both from plant decay (Otsuki et Wetzel, 1974; Mann 1988; Alber et Valiela, 1994) and also from DOC release by living plants. Dissolved organic matter release by macrophytes has been demonstrated several decades ago by Kailov and Burlakova (1969) who worked with five marine species of macroalgae. Further studies confirmed the release of dissolved organic carbon (DOC) both on marine (Brilinsky 1977) and freshwater species (Wetzel and Manny,
1972; Godmaire and Nalewajko, 1989). Reported rates of DOC vary enormously, ranging from 0.006 and 9.1 mgc.g (dry weighty'.h", and this release can represent a non negligible part of aquatic plant production (1.1 % to 67%). Sorne studies described higher level of DOC release in the light than in the dark (Sieburth 1969, Sondergaard 1981, Pregnall 1983, Nalewajko et Godmaire 1993), thus underlying a possible link between the release and the photoperiod. Similarly, DOC release has been described in marine phytoplankton and it was viewed as an overflow mechanism linked to the photosynthesis in nutrient limiting conditions (Jensen, 1984).
In this in situ study, our main objective was to quantify DOC release by the macrophyte epiphyte complex in a series of naturallakes, to explore whether DOC release as an overflow mechanism for photosynthate in nutrient Iimiting conditions. This hypothesis supposes that when CO2 and light are not lirniting factors, photosynthesis will produce carbohydrates even if nutrient lirniting conditions prevent the production of biomass from these simple
molecules. According to this hypothesis, DOC release occurs only during photosynthesis and the rate of DOC release should be related to factors such as light and temperature wh ich are known to influence positively macrophyte photosynthetic rates (Kirk, 1994; Madsen and Brix, 1997). As photosynthetic capacity differs among macrophyte species (Nielsen and Sand-Jensen, 1989), we also tested whether DOC release rates vary consistently among 4 different species (Myriophyllum spicatum, Potamogeton amplifolius, Potamogeton
riclwrdsonii, Potamogeton robinsii). The hypotheses were tested both as rates pel' unit area (in milligrams of carbon pel' square meter pel' hour, mgC.m-2.h-l) and pel' unit plant biomass (in miJJigrams of carbon pel' gram of dry weight pel' hour, mgc.gdw'l h-\ respectively representing responses at the community and the plant leveI. Finally, we examined the temporal variability in DOC release over the growing season.
The measurements were undertaken during the summers of 2004,2005 and 2006 in six lakes of the Eastern township region - lOOk m east of Montréal Québec (Table 1.1). These lakes are of glacial origin and are influenced by the alluvial sedimentary geology of the Saint Lawrence River.
To test our hypothesis we used in situ benthic chambers inserted in the sediments. Chambers were made with a polyvinyl chloride cyJinder (20 cm high, 20 cm diameter) covered hermetically with a polyethy lene transparent plastic bag equipped with a sampling port (Barron et al., 2003). At each study site, we randomly selected monospecific macrophyte
beds coupled with anearby unvegetated sediment location as control (except in shallow L.
Trois Lacs where Potamogeton richardsonii covered the entire benthic surface). The macrophyte species studied are listed in Table 1.2. Depending on the experiment, 2, 3 or 4 replicate transparent benthic chambers were pJaced on macrophytes (TM) and 2 on unvegetated sediments (TS). Testing the effect of light on DOC release first implied a comparison between daily and nightly rates. Therefore, ail in situ incubations lasted 24h or
36h from sunrise orsunset (Ta). Water samples from chambers were taken in duplicates for
DOC at the beginning (TO), then just before sunset (or just afler sunrise; TI) and finally jusl after the following sunrise (or just before sunset; T2) for the 24h incubations; one more sampling was made 12h after (before sunset or just after sunrise; T3) for the 36h incubations made in L. Stukely.
We also tested the effect of mean light and temperature received during the daytime on concurrent DOC release rates. To obtain a wider and more continuous range in Jight and temperature conditions we carried out additional experiments with transparent benthic chambers containing macrophytes covered with one or two neutral screens (noted
TM+screen). Daytime averaged temperature in TM chambers ranged between 17.09 oC and 28.01 oC, and daytime averaged Jight received ranged between 612 LUX and 19523 LUX.
14
Table 1.1
Lakes characteristics. TP: total phosphorus. TN: Total nitrogen. Chia: Chorophylle a. DOC: Dissolved organic carbon. MB: total macrophyte biomass, in grams of dry weight per square meter (gdw.m-2). ND: undetermined. -: unvisited site. *:averaged data from
Prairie and Parkes, 2006
L.h Longitude Latitude Surface (km2) Meand.pth (m) Mean Secchi d.pth(m) TP (~.L-I) SD TN (mg.. L·') SD Ch]., (~.L"') SD DOC (mg ..L-') SD MB 2004 MB 2005 MB 2006 D'Argent n'I8W 45'18 W 096 4.6 2.5 12,4 4,4 0,4 0,1 3,4 1,6 7,7 1,5 24 44 ND Bowker n'12W 45'25 W 2.3 25.9 7.9 4,9 3,0 0,2 0,0 0,9 0,3 2,6 0,3
°
PeMley n'16W 45'16 W 023 10.5 2.9 10,5 6,4 0,3 0,0 3,2 1,5 6,9 1,0 27 Stukely 72'15W 45'21 W 386 13.6 5.4 7,4 6,2 0,3 0,0 1,7 0,6 4,6 0,3 17 o o Trois Lacs 71'53W 45'48 W 2.85 1.26 1.5 30,9 17,4 0,7 0,1 4,4 2,4 9,9 1,8 68 90 ND Waterloo 72'31 W 45'20 W 1.15 2.9 0.9 34,1 14,4 0,6 0,2 16,8 10,4 7,3 1,4 10 15Taking TM+ screen chambers into account, the lowest temperature and the lowest light received became 16.68 oC and 78 LUX respectively.
According to our hypothesis, we should observe the maximum release at the highest photosynthesis, i.e. at maximum light and temperature. To further explore this prediction, we followed DOC concentrations over a 24-hour cycle at a much higher time resolution by
taking samples every one or two hours during the day for 2 TM chambers in L. Stukely. Light
intensity and temperature were measured every 10sec but averaged for every minute, in each transparent benthic chamber with HOBO Pendant Temp/Light® logger, placed at the top of the chambers.
Water samples for DOC measurements were drawn through the sampling ports with
60mL (polyethylene) acid-washed (HCI 10%) syringes, filtered on OASI-tm (filtropur
Starsted®) and kept refrigerated (4°C) in 40 mL acid-washed tubes with silicone-Teflon caps
to prevent gas exchange during analysis. The sampling led to a volume reduction inside the
chambers of around 1%. DOC analysis were made with alOI 0 TIC TOC analyser, 0.1.
Analytical, by high temperature wet oxidation (sodium persulfate; 100g/L) after dissolved inorganic carbon (DIC) elimination by acidification (sulphuric acid 5%) and sparging; analytical triplicate samples were taken in 2004, but only in duplicates in 2005 and 2006 given the high reproducibility observed. Analytical replicates had a coefficient of variation 0.7% and sample replicates had a coefficient of variation of 1%.
At the end of the 24h incubation, the water volume within each benthic chamber was estimated by injecting a IOmL weak fluorescein solution (absorption peak at 552nm) and
drawing two samples after mixing for 5 min. Ca1culated volumes ranged between 4 and 11 L.
At the end of each experiment, macrophyte shoots within the PVC ring were harvested to measure their aboveground biomass after rinsing and drying at 5YC during 24h to 36h.
Macrophyte biomass was also quantified at the whole lake scale. Random quadrat samples were taken the second week of August in 2004 and the first week of August in 2005 and 2006 within the zone confined by the maximum depth for macrophytes colonisation
16
estimated from the Secchi depth (Chambers and Kalff, 1985). For each lake except L. Trois
Lacs where macrophytes colonized the entire benthic surface, we randomly choose sampling points in the colonisation zone from digital bathymetric map; in the field these sampling point were reached with a GPS. We used a 25x25cm quadrat and we estimated the number of replicates needed after Downing and Anderson (1985). Between 10 and 22 replicates were ta ken in each lake. Macrophyte shoots inside the quadrat were harvested to measure their
aboveground biomass after rinsing and drying at 5S'C during 24h to 36h.
DOC release by macrophytes communities
Diurnal and nocturnal DOC variations were calculated as the simple difference in DOC concentrations between sunrise and sunset (photoperiod) and sunset and sunrise respecti vely, in both TM and TS chambers. DOC changes within each chamber were expressed both per unit area (mgC.m-2.h- l) and per unit plant biomass (mgC.gdw·lh·I).
The presence of macrophytes is known to alter their own environments by increasing the
sedimentation rate (Barko and James, 1998; Rooney et al., 2003; Schulz and Kbhler, 2006)
and the nature of the sedimenting material (Duarte et al., 1999; Barron and Duarte, 2006),
and by providing efficient mechanisms for solute transport within the sediment or at the interface (Carpenter and Lodge, 1986). Thus, basic calculations of DOC production or consumption from DOC concentration changes in chambers containing both water and sediments provide estimates of the net effect of the presence of macrophytes on DOC release patterns (termed net bulk DOC release). Indeed, daily and nightly DOC variations measured in transparent chambers containing macrophytes (TM) are the sum of several processes occurring simultaneously. In an attempt to further disentangle these processes, we made additional measurements with benthic chambers on bare sediments near the macrophyte bed, thus providing the closest control in terms of sediments as weil as with the phytoplanktonic and heterotrophic communities of the surrounding water. The production and consumption of DOC can be derived from several potential compartments: macrophyte-epiphyte complex
(me), phytoplankton (\}I), heterotrophic community (h) and the sediments (sed). In transparent
contribution of macrophyte-epiphyte complex. While an imperfect control, these experiments provide valuable clues by estimating, by subtraction, the net DOC release attributable to the macrophyte-epiphyte complex itself (termed DOCme). Equations 1.1 to 1.4 describe the processes occurring in transparent macrophytes (TM) and sediments (TS) chambers:
L'1DOC(TM)day = DOCme(d) + DOC",(d) + DOC,ld) + DOCsed(d) - R (eq.l.l)
L'1DOC(TM)night
=
DOCme(n) + DOC",(n) + DOC,,(n) + DOCsed(n) - R (eq.1.2)L'1DOC(TS)day
=
DOC",(d) + DOC,,(d) + DOCsed(d)-R' (eq.l.3)L'1DOC(TS)night = DOC.I'(n) + DOC,,(n)+DOCsed(n) - R' (eq.IA)
where R is the DOC respired in TM chambers and R' the DOC respired in TS chambers. By successive subtractions we obtained net DOCme:
L'1DOC(TM)day - L'1DOC(TM)night - L'1DOC(TS)day + L'1DOC(TS)night = DOCme(d)
-DOCme(n) (eq.I.S)
and
DOCme(d) - DOCme(n)= DOCme (eq.1.6)
both expressed in mgC.m·2.h· 1 and in mgc.gdw'l.h· l.
Uncertainty estimates for these compound caJculations were derived from classical error propagation formu las.
1.4 RESULTS
Macrophyte biomass data
In the benthic chambers, areal macrophytes biomass varied between 6 to 336gdw.m-2,
with a mean of 95gdw.m-2 (SE ± 3.4, n=246) which is in the same range than other reported macrophyte biomass in south-eastern Quebec lakes (Chambers and Kalff, 1984; Rooney and Kalff, 2000; Duarte and Kalff, 1990). We naturally observed significant increases in mean biomass through the summertime (ANOY A, p<0.05) with average growth rates of 37 gdw.month-I in June-JuJy, and 10 gdw.month- in July-August. Estimated macrophytes ' biomasses at the whole lake scale are given in Table 1.1 for each Jake.
Day-night comparison in DOC release rates
Our macrophyte incubations clearly showed that the DOCrelease is linked to the
photaperiod since it occurred during day but stopped at night (fig. J. 1; table 1.2). This was the case whether experiments were begun in the evening or in the morning showing that the observed DOC release was tied to the photoperiod and not ta the initiation time of the incubations. In ail cases, we observed an increase in DOC concentration during the day but not during the night in benthic chambers containing macrophyte(fig.I.2; one way ANOYA for each lake, p<0.05), except in one of the sampling dates in L. Trois Lacs (20/06/05) where DOC was apparently consumed faster than it was produced. Considering different TM chambers used for each experiment (per date and lake) as replicates we obtained mean daily DOC release rates varying from undetectable to 9.7 mgC.m-2.h- ' (SE ± 1.1; n=2) in L. Waterloo or from undetectable to 157 [lgc.gdw-'.h-I (SE ± 32; n=3) L. Stukely. Nightly variations in DOC were mostly negative, thus representing DOC consumption. They varied from -3.8 mgC.m-2.h-1 (SE ± 1.4; n=3) in L. Trois Lacs to 1.5 (SE ± 0.8; n=3) in L. Stukely or from -63 f.lgc.gdw-1.h-1, (SE ± 23; n=4) to 12 [lgc.gdw-'.h- ', (SE ± 5; n=3) both in L. Stukely. In chambers without macrophyte (TS), we observed no significant DOC changes in ail our
Table 1.2
Mean daily and nightly DOC release rates for five studied lakes with corresponding daily temperature and received light inside the benthic chamber. Myrio, P. amp, P. rich, P. rob, are
abbreviations for Myriophyllum spicatum, Potamogetton amplifollius, Potamogetton
richardsonii and Potamogetton robinsii respective!)'.
DAY NIGHT
Lake Sampling S]'ecies n mean DOCr mean DOCr mean DOCr mean DOCr Temp, SE Light SE
date m.cm~h·' SE ug.gdw"'ho' SE ~m~.h·1 SE ug.gtt..orlh"' ~ ?C LUX
Bowker 01l07l:l004 ',7 1) 92 ,O~ 0,1 ·8 1
D'Argent 2810612004 P. œt:.p 3;l 09 49 12 ·2) 0,5 ·33 10
D'Argent 061U612005 Mynà 0,4 o;l 0,6 0,3 21,11 OfJ5 10613 2351
D'Argent 081U612005 P. a;r:p 0,4 o~ 22 20 ·01 0,3 ·74 51 21fJO OfJ7 3090 51
D'Argent 2710612006 Myrio 3~ Il 50 32 ·3) Ol! ·26 22fJ4 OfJ5 7000 350
D'Argent 2810612006 Myn'o 4~ l~ 36 10 1,5 0,9 10 21,56 0,11 3140 1007
D'Argent 031U812006 P.œt:.p lp 1,4 12 ·I~ 2,2 ·10 19 22,49 OfJ1 1146 263
D'Argent 051U912006 P,{RtI.p ·0,4 1,4 ·6 23 ·0,4 0,2 ·6 18,21 OfJ5 1016 233
Peasley 1110112006 P. aw.p 5~ 2p 41 11 ,O~ 0,2 ·5 24,72 OfJ4 5518 589
Pe.sley 0110812006 P. amp 0) 2p 19 ·o~ 1,2 ·8 15 241!5 OfJ6 9131 ltJ)4
Stukely 221U612005 Myrio 17 O~ 48 11 ·11 0,3 ·63 II 19fJO 0,10 9412 1670
Stukely 281U612005 P.œt:p 8) Ip I l ' ·2) Ol! ·46
l'
21,93 OfJ4 11528 656Stukely 0610112005 Myn'o 3,4 o~ 15 36 ·0) 2fJ 15 41 21,44 OfJl 11322 1146
Stukely 0910812005 P.lRtI.p 5~ 17 15 24 ,O~ 0,6 ·4
Stukely 1210612006 P. œ:p 2~ 1~ 41 23
·2,
op ·42l'
11,16 OfJ1 12312 182StukeJy 2l1U612006 P. amp 9) 09 75 11 0,1 2,1 ·2 18 21,62 OfJ1 2661 311
StukeJy 11101n006 P.m:p 1~ O~ 68 1.5 Ol! 12 27,24 OfJ! 14630 1486
Stukely 201U712006 Myno 6p O~ 79 13 ·2ft 3,4 ·36 41 26,69 OfJ6 19446 17
Stukely 1810812006 P.lRtI.p 3~ 0,4 43 1,5 If> 13 16 22,41 OfJ3 16198 116
Trois Lacs 1910712005 P.nch 5~ 1) 81 32 ·19 1,5 ·33 18 21,16 OfJ6 1191 1598
Trois Lacs 2B/U112005 P. nÛ'1 2~ 0,4 25 ·19 0,5 ·18 24 ,82 0fJ4 5019 1609
Trois Lacs 201U612006 P.ni:h 8) O~ 41 ·3~ 1,4 ·20 22,89 OfJl 2699 213
Trois Lacs 011U612006 P.n·ch 2) O~ 16 11 Of> 1,3 11 24,41 OfJ4 3B9 664
Waterloo 061U7I:l004 Myrio ',7 2~ 112 56 ·o~ II! ·26 32
21
52 5.1 .-...,
,..J 5.0 4.9::f
---1
·
l .•••··.·.·.·.·.·.···•••
··.····1 :::
~
E
4.8 ' - " ç:; 0 :J:I 47 t 70000 ~,..
]
ç:; Q) ~ 0 u U 0 Cl 4.6 4.5 4.4i'"
, " t-t 60000 50000 40000 30000~
...S·
1f
~. ~?
$
4.3 ' - " r 20000 42 t- 10000 - ' - - - t - 0 5:30 1930 4:30 18:30 28/06/05 29/06/05Time of the day(h)
Figure 1.1 Trend in DOC concentration (Ieft axis) and light intensity (right axis) during 36 hours in two transparent chambers containing macrophytes (. and
+
respectively) in L. Stukely in 2005. Bars represent standard error (n=4).l
l
l
l
-s
l
-10 ...., ...., ...., ...., ...., ...., ...., ..<:: ..<:: >, ..<:: ..<:: ..<:: ..<:: ..<::%'
.~%'
.~ C<:l .~%'
.~%'
bO%'
.~%'
.~ "D 1:: "D 1:: "D 1:: "D 1:: "D '2 "D 1:: "D 1:: ~ ~ L..----.J ~ L..----.J ~ ~ if!.*
if!....
U U 0 ~ ~ 0 ~la
~ ..0 ...:l ...:l '3) if!. if!.-
if!..-
1i
...
i
~ 0 .0
~ 0:W
'3)~
i-oi=Q
CI
P-i Cf.l~
E-t
~
Figure 1.2 Day-time and night-time generaJ mean DOC rates (with data from ail years, in
mgC.m-2.h-l) for transparent chambers containing macrophyte, at L. d'Argent, L. Bowker, L. Peasley, L. Stukely, L. Trois lacs (data of 20/06/05 apalt, L. Trois lacs*) and L. Waterloo. Bars represent standard error.
23
experiments (ANOVA, p>O.OS), meanmg that the planktonic community of the benthic zone and naked sediments do not release DOC and that therefore changes in DOC concentration observed in TM chambers are attributable to the presence of macrophyte community.
Estimation of net DOC release rates by the macrophyte-epiphyte communities (DOCme).
As we explained earlier, day-time DOC rates obtained from direct measurements in chambers containing macrophyte take into account not on Iy the effect of the macrophyte epiphyte complex but also the effect of the overall metabolic activity occurring within the chamber, including DOC consumption occurring simultaneously with the release. In sorne cases (e.g. L. Trois Lacs, 20 June OS), this consumption can be strong enough to total 1)' mask the diurnal DOC release. Equation 1.5, developed earlier, allows the estimation of the DOC release rate more c10sely attributable to the macrophyte-epiphyte complex itself, rather than by the entire community found in the benthic chambers. Because there were no significant DOC variations in the chambers devoid of macrophyte (TS), we considered the DOC release by phytoplankton and/or sediments to be quantitatively negligible. As a result, calculation of the net DOC release from macrophyte (DOCme, eq.l.S) can be simplified to:
DOC me = ~DOC(TM)day -~DOC(TM)night (eq.1.7)
From individual DOC release rates we calculated corrected rates of DOC release by macrophyte-epiphyte complex (DOCme) using eq.I.7. Once averaged (per date and lake) obtained rates varying from undetectable to 11.9 mgC.m-2.h-1 (SE ± 1.72; n=3) for L. Trois Lacs and From undetectable to 203 IlgC.gdw- '.h-', (SE ± 50; n=3) in L. Stukely. For the following analysis, we excluded the data obtained on 20 June 05 in L. Trois Lacs, which still pointed to a strong net consumption even after correction (mean DOCme of -8.7mgC.m-2.h
I,SD ± 2.5 or -218IlgC.gdw-I.h"I, SD ± 154). In ail cases, these corrections (from
subtractions) compounded the uncertainty of our measurements and therefore decreased the statistical power of our analysis. Nevertheless, we performed the two sets of calculations to
examine both the robustness of our conclusions and the potential importance of these corrections. We therefore will be able to conclude on the implication of the pelagic and sedimentary community versus macrophyte-epiphyte complex on the DOC release.
Short-term daytime evolution of DOC concentration in macrophytes-epiphytes communities
In 2005 and 2006, we followed diurnal DOC concentrations more intensively in
L.
Stukely on P. amplifolius incubations: DOC measurements were taken at sunrise and then
every 2.5 hours on average. We observed an increase in DOC, from the first hours and
occurring ail day through (fig. 1.3A and 1.3B for 2005 and 2006 respectively). In each replicate benthic chambers, rates of DOC changes were not statistically different between sampling steps (ANCOY A, time*step: p>O.OS, data not shawn). It therefore suggests that DOC release is a continuous process that begins at sunrise but that is not c1early related to the rate of photosynthesis. Taking the two sampling year separately, we found no relationship between the increase in DOC concentration for each step and temperature or amount of Iight received during that same period. Thus, at this short temporal scale, DOC release is
independent of temperature and Iight, pointing to a decoupling between the rates of release and the main factors regulating photosynthesis.
Influence of light and tempe rature and temporal patterns in DOC release rates
Combining ail our measurements (2004, 2005, 2006; TM and TM+screen, n=108), we found no temporal pattern through summertime in the mean daily illumination in the benthic chambers, whereas temperature clearly increased from early June, to the middle of July and then decreased until the end of our experiments in the beginning of September. Similarly, it was clear that DOC release rates were not constant over the growing season (ANOY A, p<O.OS): as for temperature, rates reached a peak in late June-early July and declined to minimal values in Late August. Once the seasonality effect extracted using sampling day as a fixed factor, we found that temperature had a weak positive effect on DOC release rates (with corrected rates, per unit plant biomass) explaining 7% of the
variation, whereas Iight did not (ANCOYA: sampling time * mean daily temperature*
25
temperature had a significant effect on DOC release rates. Seasonality in corrected DOC release rates was less c1ear and tests showed no effect of combined sampling time, mean
daily temperature and mean illumination (ANCOVA, p>0.05). The weak association
between release rates and physical factors does not point to a strong coupling between photosynthesis and release rates.
Variation in release rates among macrophyte species
According to our hypothesis and since photosynthetic capacity differs among macrophyte species, mean DOC release rate should also differs among species. Given the temporal trend noted above, we tested a possible difference among species by using the residuals of the polynomial function. An ANOVA detected no difference in the temporally detrended mean DOC rates (with uncorrected or corrected rates) between species (p>0.05, n=25,). DOC release measurements grouped by genera instead of species also showed no difference in mean DOC release rates (ANOVA p>0.05).
As such, this lack of difference from results presented in Table 2, the overall mean rates
of 4.57mgC.m,z.h'J (SD ± 0.65) or 56 !!gc.gdw'l.h'J (SD ± 8) can be used as a general
A
5l
30 4Y.OO 4COJO 4,9 ~. . . ,J_ 3Y.OO 4,8 3COJOf
2Y.OO 4,7 2COJO 4,6 1Y.OO Cl 1COJOo
4,5 5 ~ 5COJ 4,4 -'---....---.---r---..-~ 0o
41130 12h15 18h15 41130 06/06/05 07106/05B
1aD00!
l
30 5,8 5,75 1COJoo 25 .::' ~ Cl bû 8 '-' c..3
«;l .b c (\) u 5J 7 5,65 5,6 5,55 5,5~.~~.,~;fl
fi ,.", ~-r/ A,~~.
f
!
' - ,-I
l
-..----
- - , _ - 20 15 10 t-:3 (l) S '"0 (l)'"'
l:>l....
E; (l) "'0o
' - ' 8COJO 4COJO 6COJOg
5,45 u Clo
5,4 5 2COJO ~ 5,35 5,3 . L . . - - - t - - - t - - - - t - - - + - - - - ' -0 o 6h15 12h 18h 5h 18108/06 19108/06 Time (h)Figure 1.3 Trends in DOC concentration (Ieft axis), Iight intensity and temperature (right axis) for benthic chambers containing macrophytes, during time courses experiment in L. Stukely, in 2005 (A) and 2006 (B). Bars represent standard deviation.
1.5 DISCUSSION
Relevance of correcting rates
Water coJumn heterotrophic organisms can be efficient al controlling the pool of DOC compounds and therefore may obscure actuaJ rates of DOC reJease by the macrophyte epiphyte complex. The corrections increased/reduced the observed DOC released rates ranging from undetectable to 9.7mgC.m-2.h-1 before corrections, to corrected rates varying from undetectable ta Il.9mgC.m-2.h- ' after corrections. Although the correction rate was 2.55 in average (i.e. con'ected rates are on average 2.55 higher than uncorrected), it was highly variable (SD ± 12.67), suggesting that it was quite important in individual measurements.
These corrections make several assumptions regarding the metabolism of the
heterotrophic community such as the similarity between day-rime and night-time respiration, both in water column and sediments. Il also assumes that the presence of macrophyte does not alter the rates of these background metabolic processes. Naturally, respiration is enhanced by warmer temperature in these compartments (see review in Pace and Prairie, 2005) and can therefore be higher during the day th an at night. Thus, the amount of DOC consumed by the heterotrophic community during the day may be higher than we assumed, leading to
conservative DOCme rates. However, we observed that the corrections did not lead to changes in relationships between reJease rate and Jight or temperature. As weil, the global release rates proposed to upscale our result at the lake scale were not statistically different with or without correction. Finally, this exercise allowed us to underline the dominant role of macrophyte-epiphyte complex in DOC release, and the fact that variations in environ mental factors do not induce a shift from DOC production by macrophyte-epiphyte complex to production by the rest of the community (planktonic and/or heterotrophic communities or sediments).
Patterns in DOC release by macrophyte-epiphyte complex
To our knowledge, this study is the first to provide in situ evidence af a substantial DOC release by living freshwater macrophyte (together with their epiphyte). DOC release has been reported for macrophyte and epiphyte separately in laboratory experiments (e.g. Penhale and Smith, 1977). However, because we were more interested in quantifying this release in natural conditions, we cou Id not separate these two components and therefore attribute the release to the macrophyte-epiphyte complex. As previously shown in laboratory experiments for macrophytes (Nalewajko and Godmaire, 1993) and for marine phytoplankton (Maranon et al. 2004), DOC release occurred during the day-time only and is thus closely associated to the photosynthetic process. As the same patterns were observed for incubations beginning at sunset or at sunrise, it rules out the possibility that the release was due la the initial
experimental stress associated with plant manipulation.
The DOC release rates we measured (from undetectable to 9.7 mge.m-2.h-1 or from undetectable to 157 ~gc.gdw-'.h-I, for macrophyte biomass varying between 6 to 336 gdw.m
2) are lower to those of Barron et al. (2003) for marine macrophyte communities. This is likely attributable to the much higher macrophyte biomass in their systems (0.14gC.m-2.d-1 to 0.6 gC.m-2 d-1 for macrophyte biomass varying between 242 to 4841gdw.m-\ Ziegler and Benner (1999) also found net daily DOC flux from seagrass higher than our DOC release rates. Qualitatively, these comparisons show that freshwater macrophyte communities act as their marine equivalent and that the release is Iikely not associated to osmotic stresses induced by the environ ment. However, to allow future comparisons of DOC release rates from various ecosystems and species, we c1early see the importance of expressing DOC release rate not only as a function of the colonized surface (per m2 , reflecting the
phenomenon at the community scale), but also per unit of macrophyte biomass (per gdw, reflecting the role of the organism itself).
To examine the relative importance of macrophyte DOC release to ather internaI DOC sources to the ecosystem, we compared our rates with those obtained for phytoplankton DOC release. Because phytoplankton and macrophyte processes operate in different dimensional
29
setting, we integrated our observed areal rates over the water column above the macrophyte to yield commensurable volumetrie rates. For marine phytoplankton, Maraîion et aL. (2005) obtained DOC production rates varying between 1 and 3mg.m-3.d-1 in an oligotrophic
environ ment. From rates obtained in our benthic chambers and the water column depth at the sampling site, we calculated volumetrie DOC production rates by macrophytes ranging between 0.4 and 98mgC.m-3.d-1 in the oligotrophic L. Stukely. Thus, living macrophytes can constitute a major internai source of organic carbon, even in oligotrophic systems. Therefore,
we can hypothesize that the proportion of DOC contributed by macrophytes in relation to that released by phytoplankton should vary, along a trophic gradient, simply as a function of the predictable switch of major source ofprimary production, from the benthic to the pelagie zone (Vadeboncoeur et aL., 2003).
Light and temperature effects: do they confirm our hypothesis?
Because both light and tempe rature are known to affect photosynthetic rates, we expected that, if DOC release can be viewed as an overflow mechanism when an important element is Iimiting (such as nutrients), DOC release rates should increase with both light intensity and temperature. We conducted two follow-up types to test the effects of light and temperature on DOC release rates, one at short-time scale in one chosen lake (L. Stukely) with samples taken every 2.5 hours and the other at summertime scale in the six studied lakes, using rates
calculated on a daily basis. Neither of them showed strong relationship between mean light received and concurrent DOC release rates. This leads to reject the link between DOC release and photosynthesis since, if it was the case, release rates would increase with increasing light. Moreover we observed that DOC release began with sunrise which means, according to the overflow mechanism hypothesis, that even at low light nutrients are limiting to biomass production. This observation therefore support the critic of this hypothesis since it would not be evolutionary advantaging for macrophytes to maintain high photosynthetic capacity in environment that cannot lead to maximum growth efficiency (the DOC release being a loss for macrophytes).
About temperature effect, even if the short time scale study concludes that there was no relationship between temperature and DOC release, the large scale study showed a general weak positive effect of temperature, stronger at lake scale particularly for 1. Stukely. Two explanations can be proposed for this relationship: firstly and according to the hypothesis of an overf]ow mechanism, higher temperature could induce a higher DOC reJease because of a higher photosynthesis efficacy (light being constant, Madsen and Brix, 1997) leading to higher accumulation of photosynthates considering that middle could be nutrient lirniting. This explanation is acceptable but we do not support it since our study of light effect just rejected the hypothesis of an overf]ow mechanism. The second explanation is suggested by the work of Madsen and Brix (1997), who observed that in inorganic carbon lirniting conditions E. canadensis and R. aquatilis increased their carboxylation efficiency when temperature increased (higher QIO than waited if CO2diffusion rate was the only implicated factor). And to increase this carboxylation efficiency enzymatic, morphologie or anatomie changes could be implied. Therefore we can suggest that DOC release could be partly implied in increasing carboxylation efficiency of macrophytes in response to increased temperature in inorganic carbon 1imiting conditions, as wou1d do an increase in extra-cellular carbonic anhydrase. This hypothesis therefore implies that in non-limiting inorganic carbon condition, DOC release rates would be lower. This proposition has to be tested as weil as the Iink between nutrients availabi1ity and DOC release to surely reject the hypothesis viewing the DOC release as an overf]ow mechanism.
Implication to the whole ecosystem
To our knowledge, our study is the first one comparing in situ DOC release rates, and we found no difference between species or among Jakes. Perhaps such differences exist but are too weak to be measurable with our technique. However, until these estimates can be further refined, we suggest that the use of our overall average DOC release rate (4.57mgC.m-2.h-1 (SD ± 0.65) or 56 !Jgc.gdw-I.h-I (SD ± 8)) constitute the best approximation to estimate the ecosystem implication of submerged macrophyte in Jake DOC dynarnics. Estimation of the potential contribution of macrophytes to the DOC budget of the whole ecosystem can be
31
calculated as the simple product of the average release rate with average macrophyte biomass in the colonisable zone of lakes (fifth chapter).
In conclusion, we demonstrated the occurrence of day time DOC release by
macrophyte-epiphyte complex in South-eastern Quebec lakes. We reject the
hypothesis presenting DOC release as an overflow mechanism for recent
photosynthates produced in limited environments since we demonstrated no link
between physical factors influencing photosynthesis and DOC release rates. Finally,
since we observed no difference in averaged DOC release rates between the 3 main
coJonizing macrophytes
of our Jakes, we proposed a mean DOC release rate usefulfor quantitative extrapolation of the process at the whole Jake scale.
Barko J .W. and James W.F. 1998. «Effects of submerged aquatic macrophytes on nutrient
dynamics, sedimantation, and resuspension». In The structuring role of aquatic
macrophytes in lakes Erik Jeppensen, Martin Sondergaard, Morten Sondergaard, Kristen Christoffersen (eds.), p197-217. Springer NY.
Barran,
c.,
Marba, N., Duarte, C.M., Pedersen, M.F., Lindblad, C., Kersting, K., Moy, F.,and Bokn, T. 2003. «High organic carbon expol1 precludes eutrophication responses in
experimental rocky shore communities». Ecosystems, vol. 6, p. 144-153.
Barr6n,
c.,
Middelburg, J.1. and Duarte, C.M. 2006. «Phytoplankton trapped within seagrass(Posidonia oceanica) sediments are a nitrogen source: an in situ isotope labeling
experiment». Limnol. Oceanogr., vol. 51, p. 1648-1653.
Brilinsky, M. 1977. «Release of dissolved organic matter by sorne marine macrophytes».
Mar. Biol., vol. 39p. 213-220.
Carpenter, S.R. and Lodge D.M. 1986._«Effects of submersed macrophytes on ecosystem processes». Aquat. Bot., vol. 26, p.341-370.
Carpenter, S.R., Cole, J.J., Pace, ML, Van De Bogel1, M., Bade, D.L., Bastviken, D., Gille, C.M., Hodgson, J.R., Kitchell, J.F., and Kritzberg, E.S. 2005. «Ecosystem Subsidies:
Terrestrial support of aquatic food webs from C-13 addition to contrasting lakes». Ecology,
vol. 86p. 2737-2750.
Chambers, P.A. and Kalff, J. 1985. «Depth distribution and biomass of submerged aquatic macrophyte community in relation to Secchi depth». Cano 1. Fish. Aquat. Sei., vol. 42p. 701-709.
Cole, U., Caraco, N.F., Kling, G.W., and Kratz, T.K. 1994. «Carbon dioxide supersaturation in the surface waters of lakes». Science, vol. 265, p. 1568-1570.
Del Giorgio, P.A., Cole, J.1., Caraco, N.F., and Peters, R.H. 1999. «Linking planktonic biomass and metabolism to net gas fluxes in northern temperate lakes». Ecology, vol. 80, p. 1422-1431.
Del Giorgio, P.A., and Peters, R.H. 1993. «Balance between phytoplankton production and plankton respiration in lakes». Cano J. Fish. Aquat. Sei., vol. 50, p. 282-289.