ÉCOLE DE TECHNOLOGIE SUPÉRIEURE UNIVERSITÉ DU QUÉBEC
THESIS PRESENTED TO
ÉCOLE DE TECHNOLOGIE SUPÉRIEURE
IN PARTIAL FULFILLEMENT OF THE REQUIREMENTS FOR THE DEGREE OF DOCTOR OF PHILOSOPHY
Ph. D.
BY
Edward Arne HILL
AN EVIDENCE-BASED TOOLSET TO CAPTURE, MEASURE, ANALYZE & ASSESS EMOTIONAL HEALTH
MONTREAL, APRIL 3, 2014
© Copyright reserved
It is forbidden to reproduce, save or share the content of this document either in whole or in parts. The reader who wishes to print or save this document on any media must first get the permission of the author.
THIS THESIS HAS BEEN EVALUATED BY THE FOLLOWING BOARD OF EXAMINERS
M. Pierre Dumouchel, Thesis Supervisor Directeur général
École de technologie supérieure
M. Jérémie Voix, President of the Board of Examiners Département de génie logiciel et des TI
École de technologie supérieure
M. Francois Coallier, Member of Jury Département de génie logiciel et des TI École de technologie supérieure
M. Pierrich Plusquellec, Member of Jury
Co-director Centre for Studies on Human Stress Associate professor, École de Psychoéducation Université de Montréal
M. Charles Moehs, External Evaluator Occupational Medicine Associates, Watertown, NY
THIS THESIS WAS PRESENTED AND DEFENDED
IN THE PRESENCE OF A BOARD OF EXAMINERS AND PUBLIC
JANUARY 10, 2014
ACKNOWLEDGMENT
This thesis was made possible by guidance from people I am privileged to know. I am most grateful to all of them.
Automatic emotion detection and speech processing guidance was provided by Dr. Pierre Dumouchel, and Dr. Najim Dehak.
Emotion Health and addiction therapy guidance was provided by:
Dr. Charles Moehs, M.D. MPH Occupational Medicine Associates, Watertown, NY Rabbi Benyamin Bresinger Director, Chabad LifeLine;
Mrs. Keren Bresinger MSW, Clinical Director and Family counselor, Chabad LifeLine;
Ruth Weinberger ICADC International Certified Alcohol and Drug Counselor and certified Family Life Educator Chabad LifeLine;
Shaun Sullivan, Behavioral specialist, Verdun Elementary school;
Dr. Janice Goldfarb, M.D. M.Sc. Medical Director, Methadone Maintenance Clinic, Montreal Jewish General Hospital;
… and members of Alcoholics Anonymous.
Training and assistance in statistical analysis over 2011 and 2012 was provided by
Dr. Sonia Lupien, Scientific Director, Institut universitaire en santé mentale de Montréal;
Heather Krause, Principal, Datassist;
Dr. Georges Monette, Department of Mathematics and Statistics, York University; Dr. John Fox, Department of Sociology, McMaster University.
AN EVIDENCE-BASED TOOLSET TO CAPTURE, MEASURE, ANALYZE & ASSESS EMOTIONAL HEALTH
Edward Arne HILL ABSTRACT
This thesis describes the development and validation of an evidence-based toolkit that captures a patient’s emotional state, expressiveness/affect, self-awareness, and empathy during a fifteen second telephone call, and then accurately measures and analyzes these indicators of Emotional Health based on emotion detection in speech and multilevel regression analysis.
An emotion corpus of eight thousand three hundred and seventy-six (8,376) momentary emotional states was collected from one hundred and thirteen (113) participants including three groups: Opioid Addicts undergoing Suboxone® treatment, the General Population, and members of Alcohol Anonymous. Each collected emotional state includes an emotional recording in response to “How are you feeling?” a self-assessment of emotional state, and an assessment of an emotionally-charged recording. Each recording is labeled with the emotional truth. A method for unsupervised emotional truth corpus labeling through automatic audio chunking and unsupervised automatic emotional truth labeling is proposed and experimented.
In order to monitor and analyze the emotional health of a patient, algorithms are developed to accurately measure the emotional state of a patient in their natural environment. Real-time emotion detection in speech provides instantaneous classification of the emotional truth of a speech recording. A pseudo real-time method improves emotional truth accuracy as more data becomes available. A new measure of emotional truth accuracy, the certainty score, is introduced. Measures of self-awareness, empathy, and expressiveness are derived from the collected emotional state.
Are there differences in emotional truth, self-assessment, self-awareness, and empathy across groups? Does gender have an effect? Does language have an effect? Does length of the response, as an indication of emotional expressiveness, vary with emotion or group? Does confidence of the emotional label, as an indication of affect, vary with emotion or group? Are there differences in call completion rates? Which group would be more likely to continue in data collections? Significant results to these questions will provide evidence that capturing and measuring Emotional Health in speech can:
Assist therapists and patients in Cognitive Behavioural Therapy to become aware of symptoms and make it easier to change thoughts and behaviours;
Provide evidence of psychotropic medication and psychotherapy effectiveness in mental health and substance abuse treatment programs;
Accelerate the interview process during monthly assessments by physicians, psychiatrists, and therapists by providing empirical insight into emotional health of patients in their natural environment.
Trigger crisis intervention on conditions including the detection of isolation from unanswered calls, or consecutive days of negative emotions.
BOÎTE À OUTILS BASÉE SUR DES ÉVIDENCES POUR CAPTURER, MESURER, ANALYSER ET ÉVALUER LA SANTÉ MENTALE
Edward Arne HILL RÉSUMÉ
Cette thèse décrit le développement et la validation d'une boîte à outils fondée sur des preuves qui capture l'état émotionnel, l'expressivité / affect, la conscience de soi et l'empathie d'un patient au cours d'un appel téléphonique de quinze secondes, puis mesure et analyse avec précision ces indicateurs de la santé émotionnelle basée sur la détection des émotions à partir de la voix et son analyse par régression multi-niveaux.
Un corpus d’échantillons de parole de téléphonique de 8376 (8,376) états émotionnels momentanées ont été recueillis. Cent treize (113) individus issus trois groupes ont participé à cette collecte: les toxicomanes traités avec le médicament Suboxone ®, la population en général, et les membres des alcooliques anonymes. Chaque état émotionnel recueilli comprend un enregistrement sonore de la réponse à la question "Comment allez-vous aujourd’hui?" Une auto-évaluation de son propre état émotionnel et de sa réaction à des échantillons émotionnels provenant de tierces personnes sont enregistrées. De plus, une approche non supervisée d’étiquetage automatique du véritable état émotionnel est proposée et expérimentée.
Afin de surveiller et d'analyser la santé émotionnelle d'un patient, les algorithmes sont développés pour mesurer avec précision l'état émotionnel d'un patient dans leur environnement naturel. La détection des émotions en temps réel d’un signal de parole permet la classification instantanée de la vérité émotionnelle d'un enregistrement de la parole. Une méthode en pseudo temps réel améliore la précision de la vérité émotionnelle au fur et à mesure que de nouvelles données audio deviennent disponibles. De plus, une nouvelle mesure de la précision de la vérité émotionnelle, le score de certitude, est proposée. Les mesures de la conscience de soi, d'empathie et d'expressivité sont tirées de l'état émotionnel recueilli.
Y at-il des différences dans la vérité émotionnelle, l’auto-évaluation, la conscience de soi et l'empathie entre les groupes? Est-ce que le sexe du participant influence l’étiquetage? Est-ce que la langue a un effet? Est-ce que la longueur de la réponse, comme une indication de l'expressivité émotionnelle, varie avec l’émotion ou avec le groupe auquel appartient le participant? Est-ce que la confiance de l'étiquetage émotionnel, comme une indication de l'affect, varient en fonction de l’émotion ou du groupe? Y at-il des différences dans les taux de réussite des appels? Quel groupe serait le plus susceptible à persévérer dans ce type d’analyse? Des résultats significatifs à ces questions fourniront la preuve que la capture et la mesure de la santé émotionnelle dans le discours permettent:
D’aider les thérapeutes et les patients en thérapie cognitivo-comportementale à prendre conscience des symptômes et de faciliter les changements de pensée et de comportement;
De fournir des preuves de l’efficacité du traitement avec des médicaments psychotropes de même que de l’efficacité des sessions de psychothérapie dans les programmes de traitement de la toxicomanie et de la santé mentale;
D’accélérer le processus d'entrevue lors des évaluations mensuelles des médecins, des psychiatres et des thérapeutes en donnant un aperçu empirique sur la santé émotionnelle des patients dans leur environnement naturel.
De détecter des situations de crise suite à des séquences prolongées sur plusieurs jours de non-enregistrement d’échantillons (situation de crise d’isolement) ou d’une situation de déprime exprimée par une séquence consécutives d’états négatifs.
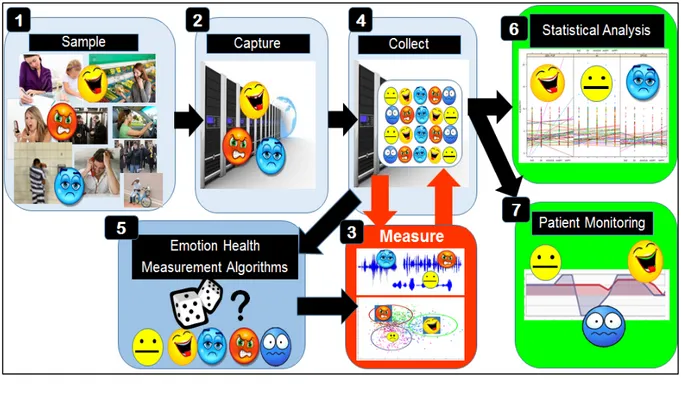
TABLE OF CONTENTS Page INTRODUCTION ... 1 METHODOLOGY ... 25 CHAPTER 1 1.1 Overview ... 25
1.1.1 Step 5: Emotional Health Algorithm Development ... 26
1.1.2 Step 6: Statistical Analysis... 27
1.1.3 Step 7: Patient Monitoring ... 28
1.2 Subjects ... 29
1.3 Step 1 and 2: Emotional State Sample and Capture ... 30
1.3.1 Call Processing... 31
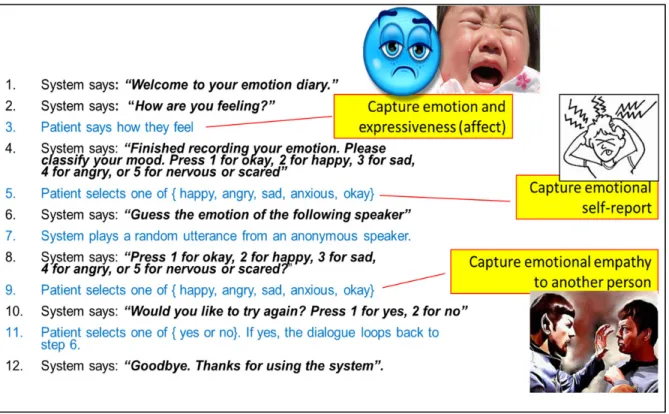
1.3.2 VoiceXML Dialogue ... 32
1.3.3 Emotional Experience Capture ... 33
1.4 Step 3: Emotional Health Measurement ... 36
1.4.1 Emotional Truth ... 36
1.4.2 Self-Awareness Emotional Concordance ... 37
1.4.3 Empathy Concordance ... 38
1.4.4 Emotional Expressiveness ... 39
1.4.5 Emotional Experience Sample ... 39
1.5 Step 4: Emotional Health Data Collection ... 41
1.5.1 Data Warehousing ... 42
1.5.2 Unsupervised Crowd-Sourced Corpus Labeling ... 43
1.5.3 Post-Trial Survey ... 43
1.6 Step 5: Emotional Health Measurement Algorithms ... 46
1.6.1 Emotional Truth Calculation ... 47
1.7 Step 6: Emotional Health Statistical Analysis ... 47
1.7.1 Statistical Regression Analysis ... 48
1.7.2 P-values – Measuring Statistical Significance ... 49
1.7.3 Confidence Intervals ... 49
1.7.4 Pooled Ordinary Least Squares Regression Analysis ... 50
1.7.5 Multilevel Analysis ... 51
1.7.6 Comparison of HLM, OLS, and Average to Calculate the Population Mean .... 52
1.7.7 More on Hierarchical Linear Models ... 56
1.7.8 Assumptions of the Hierarchical Linear Model ... 59
1.7.9 Homoscedasticity and Heteroscedasticity ... 59
1.7.10 Normality ... 61
1.7.11 Distribution Description – Skewness and Kurtosis ... 62
1.7.12 Distribution of Emotional Health Dependent Variables ... 64
1.7.13 Generalized Linear Mixed Models in R ... 66
1.7.14 Glmer example ... 66
1.7.15 Confidence Intervals of Generalized Linear Mixed Models ... 69
1.7.17 Explained Variance ... 72
1.7.18 Intraclass Correlation ... 74
1.7.19 Goodness of Fit ... 74
1.7.20 Glmer() Discrete-Choice Outcome Variable Analysis Example ... 75
1.7.21 Kaplan-Meier Survival Estimate ... 81
1.8 Step 7: Monitoring Patients’ Emotional Health ... 83
UNSUPERVISED CROWD-SOURCED CORPUS LABELING ... 89
CHAPTER 2 2.1 Automatic Chunking ... 90
2.2 Accuracy of FAU Aibo Emotion corpus emotion labels ... 91
2.3 ReCAPTCHA Crowd-Sourced Automatic Corpus labeling ... 92
2.3.1 ReCAPTCHA Accuracy ... 92
2.4 Majority Vote Classifier ... 93
2.4.1 Confidence Score ... 94
2.4.2 Certainty Score ... 95
2.5 Crowd-Sourced Automatic Corpus Labels Collected ... 97
2.6 Corpus Label Frequencies... 99
2.7 Fusing MV Classifiers to Establish Emotional Ground Truth ... 100
2.8 Fused Classifier for Automatic Emotion Detection Algorithm Training ... 100
2.8.1 Emotional Truth Example ... 101
2.8.2 Fused MV Classifier Weights calculation ... 102
2.9 Fused Classifier for Statistical Analysis ... 107
2.10Unsupervised Anonymous MV Classifier Accuracy ... 108
2.11Conclusion ... 109
AUTOMATIC EMOTION DETECTION IN SPEECH ... 111
CHAPTER 3 3.1 Automatic Emotion Detection to Approximate Emotional Truth ... 112
3.2 State-of-the-art in emotion detection ... 114
3.3 Speech Activity Detection ... 115
3.4 Feature Extraction ... 116
3.5 Emotion Detection Algorithm ... 117
3.6 GMM Model Training ... 121
3.6.1 HTK GMM Training... 122
3.6.2 Parallel Processing ... 122
3.7 GMM Emotion Detection ... 122
3.8 Experimentation and Accuracy of edetect(X) ... 123
3.9 Conclusion ... 130
PSEUDO REAL-TIME EMOTIONAL TRUTH MEASUREMENT ... 131
CHAPTER 4 4.1 Accuracy-Optimized Pseudo Real-Time Emotion Classifier ... 133
4.2 Determining the Weights for the Real-Time Emotion Classifier ... 133
4.3 Pseudo Real-Time Emotion Classifier Example ... 134
4.4 Conclusion ... 137
STATISTICAL ANALYSIS OF TRIAL DATA ... 139
CHAPTER 5 5.1 Transformation of Variables into R ... 141
5.3 R Outcome Variables ... 142
5.4 R Data types ... 144
5.5 Data summary ... 145
5.6 Emotional Health Means ... 147
5.7 Statistical Analysis for Emotional Health Effects ... 150
5.8 Happiness Effects ... 151
5.9 Sadness Effects ... 153
5.10Anxiety Effects ... 157
5.11Anger Effects ... 161
5.12Neutral (Okay) Effects ... 162
5.13Expressiveness and Affect ... 165
5.13.1 Length of Speech Effects ... 165
5.13.2 Confusability Effects ... 167
5.14Call rate Analysis ... 171
5.14.1 Emotional Health Trial Survival Analysis ... 173
5.15Discussion ... 178
5.16Conclusion ... 179
MULTINOMIAL MULTILEVEL ANALYSIS ... 181
CHAPTER 6 6.1 Conclusion ... 185
GENERAL CONCLUSION ... 187
RECOMMENDATIONS ... 193
PUBLICATIONS ... 195
APPENDIX A MORE ON STEP 3: EMOTIONAL HEALTH ESM ... 197
APPENDIX B SYSTEM DESIGN ... 209
APPENDIX C USER INTERFACE DESIGN ... 227
APPENDIX D HAPPINESS REGRESSION ANALYSIS ... 239
APPENDIX E SADNESS REGRESSION ANALYSIS ... 251
APPENDIX F ANXIETY REGRESSION ANALYSIS ... 261
APPENDIX G ANGER REGRESSION ANALYSIS ... 273
APPENDIX H NEUTRAL REGRESSION ANALYSIS ... 283
APPENDIX I EXPRESSIVENESS ANALYSIS THROUGH LENGTH OF SPEECH ... 297
APPENDIX J EXPRESSIVENESS ANALYSIS THROUGH CONFUSABILITY... 307
APPENDIX K ETHICS APPROVAL ... 317
LIST OF TABLES
Page
Table 1 Comparison of four lead authors’ theoretical emotion models ... 14
Table 2 Emotional Health Toolkit Process Steps ... 26
Table 3 Emotional Health Algorithm Development Process Steps... 27
Table 4 Emotional Health Analysis Process Steps ... 28
Table 5 Gender and Language of the Research Participants ... 30
Table 6 Experience Sample parameters ... 34
Table 7 Utterances for 2 3 ... 35
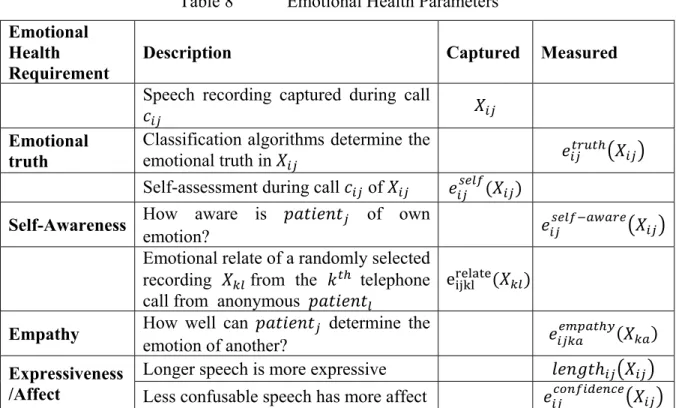
Table 8 Emotional Health Parameters ... 40
Table 9 Glmer Results Description ... 68
Table 10 Dummy Regressors ... 77
Table 11 Crowd-Sourced Vote Collection Example 1 ... 94
Table 12 Approximation of the certainty_factor ... 96
Table 13 Crowd-Sourced Vote Collection Example 2 ... 97
Table 14 Crowd-Sourced Emotion Label Frequencies ... 99
Table 15 Crowd-Sourced Vote Collection Example 3 ... 101
Table 16 ESM Certainty: 40-40-20 versus 27-56-17 Weights ... 104
Table 17 Majority Vote Concordance: 40-40-20 versus 27-56-17 Weights ... 106
Table 18 Accuracy of the Anonymous MV Classifier ... 108
Table 19 Emotional State Algorithm Development Process Steps ... 111
Table 20 Pr(e) Calculation ... 119
Table 21 Confusion Matrix Definition ... 123
Table 22 Confusion Matrix Results Interpretation ... 123
Table 23 MAP-UBM: 27-56-17 Classifier Precision and Accuracy ... 124
Table 24 MLLR-UBM: 27-56-17 Classifier Precision and Accuracy ... 125
Table 25 MAP-UBM: 40-40-20 Classifier Precision and Accuracy ... 126
Table 26 MLLR-UBM: 40-40-20 Classifier Precision and Accuracy ... 127
Table 28 Accuracy of Emotion Detection Algorithms and Self-Assessment ... 129
Table 29 Proportion of emotional speech samples collected ... 129
Table 30 Real-Time Vote Collection ... 135
Table 31 Vote Collection + 1 day ... 136
Table 32 Vote Collection + 3 days ... 136
Table 33 R grouping variables (factors) ... 142
Table 34 R Outcome Variables ... 143
Table 35 R Data Types ... 144
Table 36 R Binomials Derived from the Emotion Set ... 144
Table 37 Emotional Truth Means ... 148
Table 38 Self-Awareness Means ... 149
Table 39 Empathy Means ... 150
Table 40 Happiness Effects (p<0.05) and Trends (p<0.1) ... 151
Table 41 Sad Effects (p<0.05) and Trends (p<0.1) ... 154
Table 42 Anxious Effects (p<0.05) and Trends (p<0.1) ... 157
Table 43 Anger Effects (p<0.05) and Trends (p<0.1) ... 161
Table 44 Neutral Effects (p<0.05) and Trends (p<0.1) ... 163
Table 45 Length-of-Speech Effects (p<0.05) and Trends (p<0.1) ... 165
Table 46 Confidence Score Effects (p<0.05) and Trends (p<0.1) ... 168
Table 47 Call Completion Effects ... 171
Table 48 Trial Dates and 60-Day Normalization Factor ... 173
Table 49 Normalization of Trial Data ... 174
Table 50 MCMCglmm Categorical Means versus Glmer Binomial Means ... 184
Table 51 Pen-and-Pencil ESM Capabilities ... 198
Table 52 Pen-and-Pencil ESM for Emotional Health ... 199
Table 53 Mobile Device ESM Capabilities ... 201
Table 54 Mobile ESM for Emotional Health ... 202
Table 55 IVR Questionnaire ESM Capabilities ... 203
Table 56 IVR Questionnaire ESM for Emotional Health ... 204
Table 58 IVR Acoustic ESM for Emotional Health ... 206
Table 59 Comparison of ESM Capabilities across ESM ... 207
Table 60 Comparison of Emotional Health Measurement Suitability ... 208
Table 61 Happiness Frequencies ... 239
Table 62 Happiness Self-report Frequencies across Groups ... 242
Table 63 Happiness Self-Awareness Frequency across Groups ... 244
Table 64 Frequency of Happiness Empathy (happyEMPATHY) across Groups 246 Table 65 Frequency of Sadness (sadCROWD) across Groups ... 251
Table 66 Frequency of Sadness Self-Awareness across Groups ... 255
Table 67 Frequency of Sadness Empathy (sadEMPATHY) across Groups ... 259
Table 68 Frequency of Anxiety (anxCROWD) across Groups ... 261
Table 69 Frequency of Anxiety Self-Awareness across Groups ... 265
Table 70 Frequency of Empathy to Anxiety (anxEMPATHY) across Groups .... 269
Table 71 Frequency of Anger (angryCROWD) across groups ... 273
Table 72 Frequency of Anger Self-Awareness across Groups ... 276
Table 73 Frequency of Anger Empathy (angryEMPATHY) across groups ... 278
Table 74 Frequency of Neutral (okCROWD) across Groups ... 283
Table 75 Frequency of Neutral Self-Awareness across Groups ... 288
LIST OF FIGURES
Page
Figure 1 Activation-Evaluation Emotional Space. ... 2
Figure 2 Monitoring patients in their natural environment... 3
Figure 3 Sample, Capture, and Collect ... 3
Figure 4 Unsupervised labeling ... 3
Figure 5 Measure emotional health over time ... 4
Figure 6 Iteratively improve emotional health measurements ... 4
Figure 7 Psychotherapy ... 5
Figure 8 Medication ... 5
Figure 9 Triggering crisis intervention ... 5
Figure 10 Mood Disorders ... 6
Figure 11 Affect, Self-Awareness, and Empathy ... 9
Figure 12 Components of Emotional Health ... 12
Figure 13 Emotion Set ... 13
Figure 14 Five Emotions Mapped to CBT ... 14
Figure 15 Emotion Cluster Mapping ... 15
Figure 16 Emotional Health Sampling over the Telephone ... 17
Figure 17 Analyze, Monitor, and Intervene ... 18
Figure 18 Monitor Patients’ Emotional Health over Time ... 19
Figure 19 Detect Anomalies and Notify Professionals for Intervention ... 19
Figure 20 Monitor Emotional Health Effects of Medication ... 20
Figure 21 CBT Application Domains ... 21
Figure 22 Emotional Health Measurement in CBT ... 21
Figure 23 Hierarchical Study ... 22
Figure 24 Psychotherapy ... 23
Figure 25 Emotional Health Toolkit Process Flow ... 25
Figure 26 Emotion Health Algorithm Development Process Flow ... 26
Figure 28 Emotional Health Patient Monitoring Process Flow ... 29
Figure 29 Step 2: Emotional Health Sample and Capture ... 30
Figure 30 IVR Network Architecture ... 31
Figure 31 Emotional State ( ) Capture Telephone Dialogue ... 32
Figure 32 Step 3: Emotional Health Measurement ... 36
Figure 33 Classified Emotional Truth ... 36
Figure 34 Self-Awareness ... 37
Figure 35 Concordance of Self-Assessment and Empathy Assessments ... 37
Figure 36 Empathy for another Human Being... 38
Figure 37 Expressiveness/Affect ... 39
Figure 38 Step 4: Emotional Health Data Collection ... 41
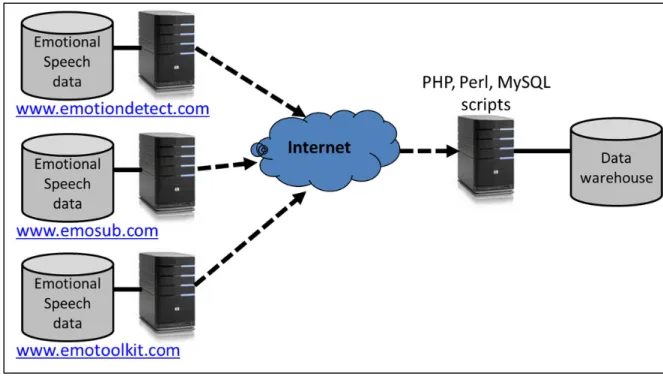
Figure 39 Extract, Transform and Load the Data Warehouse ... 43
Figure 40 Step 5: Emotional Truth Algorithm Development and Training ... 46
Figure 41 Step 6: Emotional Health Statistical Analysis ... 47
Figure 42 95% Confidence Interval ... 50
Figure 43 Illustration of Causal Heterogeneity... 51
Figure 44 Mean of Unbalanced Multilevel Data ... 53
Figure 45 Level 1 Unbalanced Observation Clusters ... 54
Figure 46 Overall Level 2 Mean Calculated from Cluster B's ... 55
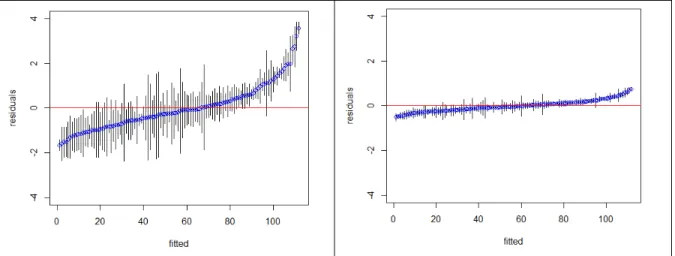
Figure 47 Heteroscedastic Residuals ... 60
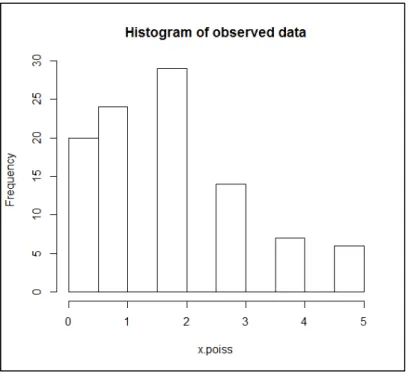
Figure 48 Residuals of Length-of-Speech and Log-Normalized Length-of-Speech 61 Figure 49 Histogram of Poisson distribution ... 63
Figure 50 Cullen and Frey Plot of a Poisson distribution ... 64
Figure 51 Box Plot and Box Plot with Outliers ... 70
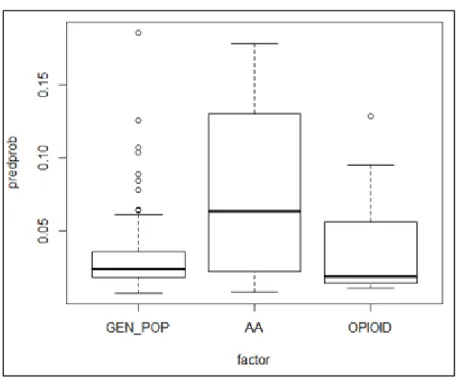
Figure 52 Box Plot of Fitted value for Anxiety versus Group in R ... 72
Figure 53 Estimates of the Residuals 0 for each ... 77
Figure 54 Predicted Probabilities of happyTRUTH versus Group3 ... 80
Figure 55 Survival Estimate for Patients with Cancer of the Tongue ... 82
Figure 56 Step 7: Emotional Health Monitoring ... 83
Figure 58 Patient Registration ... 85
Figure 59 Daily Call Completion Rates ... 86
Figure 60 Emotional Recording Playback Tool ... 86
Figure 61 Monitoring Patient Emotions over Time ... 87
Figure 62 Crowd-Sourced Corpus Labeling ... 89
Figure 63 Example Utterance with Multiple Emotions ... 90
Figure 64 Human Labeling of Emotional Audio Content ... 91
Figure 65 ReCAPTCHA ... 93
Figure 66 Transcription Tool ... 98
Figure 67 MV Concordance Differences of 40-40-20 versus 27-56-17 ... 107
Figure 68 Emotion Classification Algorithm Development Process Flow... 111
Figure 69 Emotion Model Training ... 112
Figure 70 Run-Time Emotion Detection ... 113
Figure 71 Speech Activity Detection ... 115
Figure 72 MAP Adaptation (Summarized from Reynolds et al) ... 118
Figure 73 Emotion Detector Training Sequence Diagram ... 121
Figure 74 MAP-UBM: 27-56-17 Classifier Concordance Heat Map ... 124
Figure 75 MLLR-UBM: 27-56-17 Classifier Concordance Heat Map ... 125
Figure 76 MAP-UBM: 40-40-20 Classifier Concordance Heat Map ... 126
Figure 77 MLLR-UBM: 40-40-20 Classifier Concordance Heat Map ... 127
Figure 78 Real-Time Emotional Truth Measurement... 131
Figure 79 Pseudo-Real-Time Emotional Truth Measurement ... 132
Figure 80 Real-Time Acoustic Emotion Classifier determines Happy ... 135
Figure 81 Statistical Analysis on the Trial Data Collection ... 139
Figure 82 Participant ESM Frequencies ... 145
Figure 83 Histograms of Regression Factors ... 145
Figure 84 Speech Duration Histogram ... 146
Figure 85 Confidence and Certainty Histogram ... 146
Figure 86 Emotional Truth Concordance ... 147
Figure 88 Self-Awareness Means ... 149 Figure 89 Empathy Means ... 150 Figure 90 SUBX less Happy than GP ... 152 Figure 91 SUBX less Happy than AA ... 152 Figure 92 Trend that SUBX less Self-Aware of Happiness than GP ... 153 Figure 93 AA less Sad than GP ... 154 Figure 94 Males less Sad than Females ... 155 Figure 95 Trend that SUBX less Self-Aware of Sadness than GP ... 155 Figure 96 SUBX less Self-Aware of Sadness than AA ... 156 Figure 97 Trend that Males are more Self-Aware of Sadness than Females ... 156 Figure 98 SUBX less Anxious than AA ... 158 Figure 99 SUBX less Self-Aware of Anxiety than GP ... 158 Figure 100 SUBX less Self-Aware of Anxiety than AA ... 159 Figure 101 AA less Empathetic to Anxiety than GP ... 159 Figure 102 AA less Empathetic to Anxiety than SUBX ... 160 Figure 103 Trend that Males less Empathetic to Anxiety than Females ... 160 Figure 104 Trend that Males less Empathetic to Anger than Females ... 161 Figure 105 Trend that French more Empathetic to Anger than English ... 162 Figure 106 Trend that French People are more Neutral than English People ... 163 Figure 107 GP more Self-Aware of Neutral State than SUBX Patients ... 164 Figure 108 SUBX more Empathic to Neutral State than AA members ... 164 Figure 109 GP more Self-Aware of Neutral State than SUBX Patients ... 166 Figure 110 GP more Self-Aware of Neutral State than SUBX Patients ... 166 Figure 111 Length-of-speech across emotions ... 167 Figure 112 SUBX more Confusable than GP ... 168 Figure 113 SUBX more Confusable than AA ... 169 Figure 114 Females more Confusable than Males ... 169 Figure 115 English more Confusable than French ... 170 Figure 116 Neutral more Confusable than Happy and Anxious ... 170 Figure 117 Typical Opioid Detection Times in Urine ... 172
Figure 118 Lapse in Daily Call Completion for SUBX patient ... 172 Figure 119 Predicted Probabilities of Call Completion versus Group ... 172 Figure 120 Kaplan-Meier Survival Analysis of Trial Participation ... 176 Figure 121 Kaplan-Meier Survival Analysis of Trial Participation by Group ... 176 Figure 122 Kaplan-Meier Survival Analysis of Trial Participation by Gender ... 177 Figure 123 Pen and Pencil Journaling ... 197 Figure 124 Example of trackyourhappiness.org ... 200 Figure 125 Participant Profile in Drupal... 209 Figure 126 IVR Network Architecture ... 210 Figure 127 Record Emotional Momentary Experience using IVR... 215 Figure 128 Anonymous Labeling of Emotional Recordings using IVR ... 216 Figure 129 Patient Monitor and Trend Analysis ... 217 Figure 130 Speech Scientist Training the Emotion Detector ... 218 Figure 131 IVR Sequence Diagram ... 219 Figure 132 Emotion Detector Training Sequence Diagram ... 220 Figure 133 www.emotiondetect.com ... 221 Figure 134 www.emotiondetect.com Deployment Architecture ... 223 Figure 135 Emotion Detection Deployment Architecture ... 224 Figure 136 Simplified Data Schema ... 226 Figure 137 Emotional Health Toolkit Login Web Page ... 227 Figure 138 Audio Prompt Customization ... 228 Figure 139 Supervisor Home Page ... 228 Figure 140 List of Users ... 229 Figure 141 Filter by Group, Patient, Start Date and End Date ... 231 Figure 142 Emotional Truth Pie Charts ... 232 Figure 143 Self-Assessment versus Emotional Truth... 232 Figure 144 Analyze Call Rates ... 233 Figure 145 Listen to Audio Data Collected ... 233 Figure 146 Graph of Emotions over Time ... 235 Figure 147 Participant Home Page ... 236
Figure 148 Transcriber Home Page ... 237 Figure 149 Transcriber Interface ... 237 Figure 150 Frequency of Happiness (happyCROWD) across Groups ... 239 Figure 151 Predicted Probabilities of Happy versus Gender and Language ... 240 Figure 152 Frequency of Happiness Self-Report across Groups ... 242 Figure 153 Predicted Probabilities of happySELF versus Group ... 243 Figure 154 Happiness Self-Awareness Frequency across Groups ... 244 Figure 155 Predicted Probabilities of happySELFAWARE versus Group ... 245 Figure 156 Frequency of Happiness Empathy (happyEMPATHY) across Groups 247 Figure 157 Cullen and Frey Graph of happyEMPATHY Residuals ... 248 Figure 158 Predicted Probabilities of happyEMPATHY versus Group ... 249 Figure 159 Predicted Prob of happyEMPATHY versus Gender and Language ... 249 Figure 160 Frequency of Sadness (sadCROWD) across Groups ... 251 Figure 161 Predicted Probabilities of sadCROWD versus Group ... 253 Figure 162 Predicted Probabilities of sadCROWD versus Gender ... 254 Figure 163 Frequency of Sadness Self-Awareness across Groups ... 255 Figure 164 Predicted Probabilities of sadSELFAWARE versus Group... 257 Figure 165 Predicted Probabilities of sadSELFWARE versus Gender ... 258 Figure 166 Frequency of Sadness Empathy (sadEMPATHY) across Groups ... 259 Figure 167 Predicted Probabilities of sadEMPATHY versus Group ... 260 Figure 168 Frequency of Anxiety (anxCROWD) across Groups ... 261 Figure 169 Predicted Probabilities of anxCROWD versus Group ... 263 Figure 170 Predicted Probabilities of anxCROWD versus Gender ... 264 Figure 171 Predicted Probabilities of anxCROWD versus Language ... 265 Figure 172 Frequency of Anxiety Self-Awareness across Groups ... 266 Figure 173 Predicted Probabilities of anxSELFAWARE versus Group ... 267 Figure 174 Predicted Prob of anxSELFAWARE versus Gender and Language ... 268 Figure 175 Frequency of Empathy to Anxiety (anxEMPATHY) across Groups .... 269 Figure 176 Predicted Probabilities of anxEMPATHY versus Group ... 271 Figure 177 Predicted Probabilities of anxEMPATHY versus Gender ... 272
Figure 178 Predicted Probabilities of anxEMPATHY versus Language ... 272 Figure 179 Frequency of Anger (angryCROWD) across groups ... 273 Figure 180 Predicted Probabilities of angryCROWD versus Group ... 274 Figure 181 Predicted Prob of angryCROWD versus Gender and Language ... 275 Figure 182 Frequency of Anger Self-Awareness across Groups ... 276 Figure 183 Predicted Prob of angrySELFAWARE versus Group ... 277 Figure 184 Predicted Prob of angrySELFAWARE versus Gender and Language . 278 Figure 185 Predicted Probabilities of angryEMPATHY versus Group ... 279 Figure 186 Predicted Probabilities of angryEMPATHY versus Gender ... 280 Figure 187 Frequency of Neutral (okCROWD) across Groups ... 283 Figure 188 Cullen and Frey Distribution Graph of okCROWD ... 284 Figure 189 Predicted Probabilities of okCROWD versus Group ... 285 Figure 190 Predicted Probabilities of okCROWD versus Gender ... 286 Figure 191 Predicted Probabilities of okCROWD versus Language ... 287 Figure 192 Frequency of Neutral Self-Awareness across Groups ... 288 Figure 193 Predicted Probabilities of okSELFAWARE versus Group ... 290 Figure 194 Predicted Prob of okSELFAWARE versus Gender and Language ... 291 Figure 195 Frequency of Empathy to Neutral (okEMPATHY) across Groups ... 292 Figure 196 Predicted Probabilities of okEMPATHY versus Group... 294 Figure 197 Predicted Prob of okEMPATHY versus Gender and Language ... 295 Figure 198 Predicted Probabilities of okEMPATHY versus Gender ... 296 Figure 199 Length of Speech versus Emotion ... 297 Figure 200 Length of Speech versus Emotion with Regression Lines ... 298 Figure 201 Predicted Probabilities of Length-of-Speech versus Emotion ... 298 Figure 202 Predicted Probabilities of Length-of-Speech versus Group ... 299 Figure 203 Predicted Prob of Length-of-Speech versus Gender and Language ... 299 Figure 204 Cullen and Frey graph of log normalized Length of Speech ... 300 Figure 205 Gamma Distribution of Length of Speech ... 301 Figure 206 Log-Normalized Length of Speech Distribution ... 302 Figure 207 Estimates of Log-Norm Residuals 0 for each . ... 302
Figure 208 Confusability versus Emotion with Regression Lines ... 307 Figure 209 Estimates of Confusability residuals 0 for each ... 308 Figure 210 Q-Q Plot depicting Lack of Normality in R ... 309 Figure 211 Cullen and Frey Graph of Confusability ... 310 Figure 212 Confusability Distribution ... 311 Figure 213 Cullen and Frey Graph of Power Transformed Confusability ... 312 Figure 214 QQ Plot of Residuals of Log-Normalized Confusability ... 313 Figure 215 Predicted Probabilities of Confusability versus Group ... 313 Figure 216 Predicted Probabilities of Confusability versus emotion ... 314 Figure 217 Predicted Probabilities of Confusability versus Gender... 315 Figure 218 Predicted Probabilities of Confusability versus Language ... 316
LIST OF SOFTWARE CODE SNIPPETS
Page Code Snippet 1 Aggregated Means Calculation in R ... 53 Code Snippet 2 OLS Model Calculation in R ... 54 Code Snippet 3 HLM Calculation using lme() in R... 56 Code Snippet 4 Shapiro Wilk Normality Test in R ... 61 Code Snippet 5 Poisson distribution in R ... 62 Code Snippet 6 Description of a Poisson distribution in R ... 63 Code Snippet 7 help(glmer) in R ... 66 Code Snippet 8 A glmer() Example with Numbered Output in R ... 68 Code Snippet 9 Confidence Intervals Calculated with the wald() Function in R ... 69 Code Snippet 10 Wald Confidence Intervals of a glmer Model in R ... 69 Code Snippet 11 Function for a Box Plot of a Regression Model’s Fitted Values in R ... 71 Code Snippet 12 Box Plot of Anxiety Levels across Groups in R ... 71 Code Snippet 13 Pseudo R-Squared Binomial example in R ... 74 Code Snippet 14 Happiness Emotion Truth 2-level Null Model in R ... 76 Code Snippet 15 Happiness Two-Level and One-Level Model Comparison in R ... 76 Code Snippet 16 Shapiro-Wilk Normality Test in R ... 77 Code Snippet 17 Happiness versus Group Two-Level Regression Model in R ... 78 Code Snippet 18 Happiness versus Group Two-Level Confidence Intervals in R ... 78 Code Snippet 19 Re-Leveling of Group Factor to Reveal AA versus SUBX Effect in R .. 79 Code Snippet 20 Analysis of Variance in R ... 80 Code Snippet 21 Survival Estimate for Patients with Cancer of the Tongue in R ... 82 Code Snippet 22 Calculation of Certainty Weights using OLS regression in R ... 96 Code Snippet 23 Calculation of Multilevel Vote Count Means in R... 103 Code Snippet 24 Concordance of 40-40-20 versus 27-56-17 weighting in R ... 106 Code Snippet 25 Concordance of Anonymous MV Classifier (C>3) versus Truth in R .. 108 Code Snippet 26 Kaplan-Meier Survival Analysis of Trial Participation in R ... 175 Code Snippet 27 Kaplan-Meier Survival Analysis of Trial versus Group in R ... 177
Code Snippet 28 Kaplan-Meier Survival Analysis of Trial versus Gender in R ... 178 Code Snippet 29 MCMCglmm Priors Calculation in R ... 182 Code Snippet 30 MCMCglmm Emotional Truth versus Group in R ... 183 Code Snippet 31 MCMCglmm Emotional Truth versus Group Results in R ... 183 Code Snippet 32 CCXML Script to Call Participants in CCXML ... 212 Code Snippet 33 Play an Audio Recording over the Phone in VoiceXML ... 213 Code Snippet 34 Record an Audio Recording over the Phone in VoiceXML ... 213 Code Snippet 35 Capture the Participant’s Emotional Self-Report in VoiceXML ... 214 Code Snippet 36 Emotional Self-Report Grammar in GrXML ... 214 Code Snippet 37 Dynamic VoiceXML in PHP ... 215 Code Snippet 38 Dynamic VoiceXML Output from PHP ... 215 Code Snippet 39 Happiness Emotional Truth versus Gender Two-Level Model in R ... 240 Code Snippet 40 Happiness Self-Report Null Model in R ... 242 Code Snippet 41 Happiness Self-Awareness Two-Level Null Model Calculation in R .. 244 Code Snippet 42 Happiness Self-Awareness versus Group Model Calculation in R ... 245 Code Snippet 43 Empathy to Happiness Two-Level Null Model in R ... 247 Code Snippet 44 Happiness Empathy versus Group Model in R ... 248 Code Snippet 45 Sadness Two-Level Null Model in R ... 252 Code Snippet 46 Sadness versus Group Model in R ... 252 Code Snippet 47 Sadness versus Gender Model in R ... 254 Code Snippet 48 Sadness Self-Awareness Two-Level Null Model Calculation in R ... 256 Code Snippet 49 Sadness Self-Awareness versus Group Model Calculation in R ... 256 Code Snippet 50 Sadness Self-Awareness versus Gender Model Calculation in R ... 258 Code Snippet 51 Empathy to Sadness Two-Level Null Model in R ... 260 Code Snippet 52 Anxiety Two-Level Null Model in R ... 262 Code Snippet 53 Anxiety versus Group Model in R ... 262 Code Snippet 54 Anxiety versus Gender Model in R ... 263 Code Snippet 55 Anxiety versus Language Model in R ... 264 Code Snippet 56 Anxiety Self-Awareness Two-Level Null Model in R ... 266 Code Snippet 57 Anxiety Self-Awareness versus Group Model in R ... 267
Code Snippet 58 Empathy to Anxiety Two-Level Null Model in R ... 269 Code Snippet 59 Anxiety Empathy versus Group Model in R ... 270 Code Snippet 60 Anxiety Empathy versus Gender Model in R ... 271 Code Snippet 61 Anger Two-Level Null Model in R ... 274 Code Snippet 62 Anger versus Group Model in R ... 274 Code Snippet 63 Anger versus Gender Model in R ... 275 Code Snippet 64 Anger Self-Awareness Two-Level Null Model in R... 277 Code Snippet 65 Anger Self-Awareness Two-Level Null Model in R... 278 Code Snippet 66 Anger Empathy versus Group Model in R ... 279 Code Snippet 67 Anger Empathy versus Gender Model in R ... 280 Code Snippet 68 Anger Empathy versus Language Model in R ... 281 Code Snippet 69 Neutral Two-Level Null Model in R ... 284 Code Snippet 70 Neutral Shapiro-Wilk Normality Test in R ... 284 Code Snippet 71 Neutral versus Group Model in R ... 285 Code Snippet 72 Neutral versus Gender Model in R ... 286 Code Snippet 73 Neutral versus Language Model in R ... 287 Code Snippet 74 Neutral Self-Awareness Two-Level Null Model in R... 289 Code Snippet 75 Neutral Self-Awareness versus Group Model in R ... 289 Code Snippet 76 Empathy to Neutral Two-Level Null Model in R ... 292 Code Snippet 77 Neutral Empathy versus Group Model in R ... 293 Code Snippet 78 Neutral Empathy versus Gender Model in R ... 295 Code Snippet 79 Neutral Empathy versus Language Model in R ... 296 Code Snippet 80 Length-of-Speech Distribution Statistics in R ... 300 Code Snippet 81 Shapiro-Wilk Normality Test of Length-of-Speech in R ... 300 Code Snippet 82 Histogram to Investigate Length-of-Speech Distribution in R ... 301 Code Snippet 83 Log-Normalization of Length-of-Speech in R ... 301 Code Snippet 84 Shapiro-Wilk Normality Test of Log-Norm Length-of-Speech in R .... 302 Code Snippet 85 Two-and One-Level Log-Norm Model Comparison ... 303 Code Snippet 86 Log-Normalized Length-of-Speech versus Group (GP ref) in R ... 303 Code Snippet 87 Log-Normalized Length-of-Speech versus Group (AA ref) in R ... 304
Code Snippet 88 Log-Normalized Length versus Emotional Truth Model in R ... 304 Code Snippet 89 Log-Norm Length across effects of group and emotion (ref GP) in R . 305 Code Snippet 90 Log-Norm Length across effects of group and emotion (ref AA) in R . 305 Code Snippet 91 Log-Normalized Length-of-Speech versus Gender Model in R ... 306 Code Snippet 92 Log-Normalized Length-of-Speech versus Language Model in R ... 306 Code Snippet 93 Normality Test of Confusability Residuals in R ... 308 Code Snippet 94 Confidence Score (Confusability) Distribution Statistics in R ... 310 Code Snippet 95 Attempt to Normalize the Confidence Score in R ... 311 Code Snippet 96 Attempt to Normalize with Power Transform Fails in R ... 312 Code Snippet 97 Attempt to Log-Normalize Fails in R ... 312 Code Snippet 98 Confusability versus Group Model in R ... 314 Code Snippet 99 Confusability versus Group Model in R (ref AA) ... 314 Code Snippet 100 Confusability versus Emotion Model in R ... 315 Code Snippet 101 Confusability versus Gender Model in R ... 315 Code Snippet 102 Confusability versus Language Model in R ... 316
LIST OF ABREVIATIONS
AA Alcoholics Anonymous
A-ESM IVR Acoustic ESM
AIC Akaike Information Criterion AJAX Asynchronous JavaScript and XML
AMI Any mental illness
BECARS Open-source software for speaker recognition BIC Bayesian information criterion
CAPTCHA Completely Automated Public Turing test to tell Computers and
Humans Apart
CARD Comprehensive Analysis of Reported Drugs CBT Cognitive Behavioural Therapy
CCXML Call Control eXtended Markup Language
CI Confidence Interval
CMF Content Management Framework CMS Content Management System CPU Central Processing Unit
CRIM Centre de recherche informatique de Montréal CRON Command Run On (UNIX scheduler)
CSC Canadian Correctional Service
df Degrees of freedom
DNA Deoxyribonucleic acid
DSM-IV Diagnostic and Statistical Manual of Mental Disorders 4th edition DTMF Dual Tone Multi-Frequency
EBA Evidence-Based Assessment
EC Effortful Control
EM Expectation-Maximization
EMA Ecological Momentary Assessment
F1, F2… FN Frequency Formants
GLLAMM Stata’s Generalized Linear Latent And Mixed Models
GMM Gaussian Model Mixtures
GNU GNU's Not Unix
GP General Population
GPS Global Positioning System
GRXML Grammar eXtended Markup Language HLM Hierarchical Linear Model
HMM Hidden Markov Models
HTK Hidden Markov Models Toolkit
HTML HyperText Markup Language
ICC Intraclass Correlation Coefficient
IGT Iowa Gambling Task
IIA Independence from Irrelevant Alternatives
IMPACT International Mission on Prognosis and Clinical Trial design in TBI INTERSPEECH International Speech Communication Association
iOS iPhone Operating System
IQR Interquartile Range
IRB Institutional Review Board
IVR Interactive Voice Response System
JFA Joint Factor Analysis
LAMP Linux-Apache-MySQL-PHP LogLik Log Likelihood
LPGL GNU Lesser General Public License LPGL Lesser General Public License MAP Maximum-a-Posteriori
MCMCglmm Markov Chain Monte Carlo Generalized Linear Mixed Models MCS Multiple Classifier Systems
MD Medical Doctor
MIT Massachusetts Institute of Technology
ML Maximum Likelihood
MLE Maximum Likelihood Estimate MLLR maximum likelihood linear regression
MP3 Moving Picture Experts Group (MPEG) Audio Layer 3 MPH Master of Public Health
MV Majority Vote
MySQL My Structured Query Language; database management system
NA Negative Affect
NIMH National Institute of Mental Health
NIST National Institute of Standards and Technology OCR Optical Character Recognition
OLS Ordinary Least Squares
PA Positive Affect
Perl Practical Extraction and Reporting Language PHP PHP: Hypertext Preprocessor
PIN Personal Identification Number
PRO Patient-Reported-Outcome PSTN Public Switched Telephone Network
R The R programming language
ReCAPTCHA CAPTCHA to improve digitization process
REML Restricted Maximum Likelihood
SAMHSA Substance Abuse and Mental Health Services Administration
SD Standard Deviation
SE Standard Error
SFTP Secure File Transfer Protocol SFTP Secure File Transfer Protocol
SMS Short Message Service
SPIDA York University's Summer Program in Data Analysis
SUBX Opioid Addicts undergoing Suboxone® treatment SVM Support Vector Machines
TSD Time sampling diary
UA Unweighted Average
UBM Universal Background Models
VAD Voice Activity Detector
VoiceXML Voice eXtended Markup Language
LIST OF SYMBOLS
The patient in an experience sample collection trial
The telephone call for
The call type of (inbound or outbound) The timestamp (date + time) of
The call duration in seconds of The call state of
∈ { , , }
The speech recording for captured during call
The trial group
The emotional self-assessment for of
∈ { , ℎ , , , }
Short form of
e ( ) The emotional assessment for of a randomly
selected recording ( speech recording from another
). ∈ { , ℎ , , , }
Short form of e ( )
E Multiple e assessments can be captured on the same call . E is the set of all emotional assessments.
Short form of E
The experience sample for
( ) The ground truth emotion for of
Short form of ( )
( ) The approximation of for calculated
by automatic emotion detection Short form of ( )
( ) The approximation of for calculated from majority vote crowd-sourcing
Short form of ( )
( ) The approximation of for calculated
from majority vote crowd-sourcing and and Short form of ( )
( ) The approximation of for calculated from majority vote crowd-sourcing, and
Short form of ( )
ℎ The length in seconds of for
The confidence score in the approximation of for
Short form of ( )
The certainty score of for
(Scaled by reCAPTCHA response factor) Short form of ( )
Variance of a sample mean
INTRODUCTION
Mental health and substance abuse professionals need new evidence-based methods to cost-effectively and time-cost-effectively diagnose, monitor, assist in decision making, and treat the tens of millions of people affected by mental health disorders and substance abuse every year.
This thesis is a cross-disciplinary study combining software engineering, speech science, and elements of psychological research towards the development and validation of an evidence-based toolkit that captures a patient’s emotional state, expressiveness/affect, self-awareness, and empathy during a fifteen second telephone call, and then accurately measures and analyzes these four indicators of Emotional Health based on emotion detection in speech and multilevel regression analysis. This research presents the only known statistically validated1 system that measures a patient’s emotional state, expressiveness/affect, self-awareness, and empathy in a patient’s natural environment2.
Emotional Speech
Emotional speech can be elicited by asking the quintessential question “how do you feel?” It is human nature to colour our response to this question with emotion [2]. Most people can infer something of the person’s psychological state from vocal changes [3]. In the post-trial survey summarized in section 1.5.3, 85% of trial participants indicated they listened to how the speaker spoke, rather than what was said, to determine emotion.
Emotion produces changes in respiration, phonation, articulation, and energy [4]. As emotional intensity increases, frequency and duration of pauses decrease [5]. Acoustic variables strongly involved in vocal emotions include level, range, contour of the
1 Statistical methods are described in Chapter 1. Hypothesis and analysis of trial data are presented in Chapter 5
and the General Conclusion.
2There are systems that have been emerging that measure distress and depression over the telephone since the
fundamental frequency F0; vocal energy; distribution of energy in the frequency spectrum; location of the frequency formants (F1, F2,...,FN); tempo (speaking rate), rate and length of pauses [4, 6].
Unemotional speech (Neutral) has a much narrower pitch range than that of emotional speech [5]. Fear and Anxiety are characterized by an increase in mean F0, F0 range, and high-frequency energy; an accelerated rate of articulation, and pauses typically comprising 31% of total speaking time. (An increase in mean F0 is evident for milder forms of fear such as worry or anxiety) [7]. Sadness corresponds in a decrease in mean F0, F0 range, and mean energy as well as downward-directed F0 contours; slower tempo; irregular pauses [7]. Happiness produces an increase in mean F0, F0 range, F0 variability, and mean energy; and there may be an increase in high-frequency energy and rate of articulation [7].
Emotional states with high and low level of arousal are hardly ever confused, but it is difficult to determine the emotion of a person with flat affect [5]. Emotions that are close in the activation-evaluation emotional space (flat affect) often tend to be confused [7].
Thesis Goals
1. Build an Interactive Voice Response (IVR) cloud platform to monitor and analyze the emotional health of a patient in their natural environment.
Figure 2 Monitoring patients in their natural environment
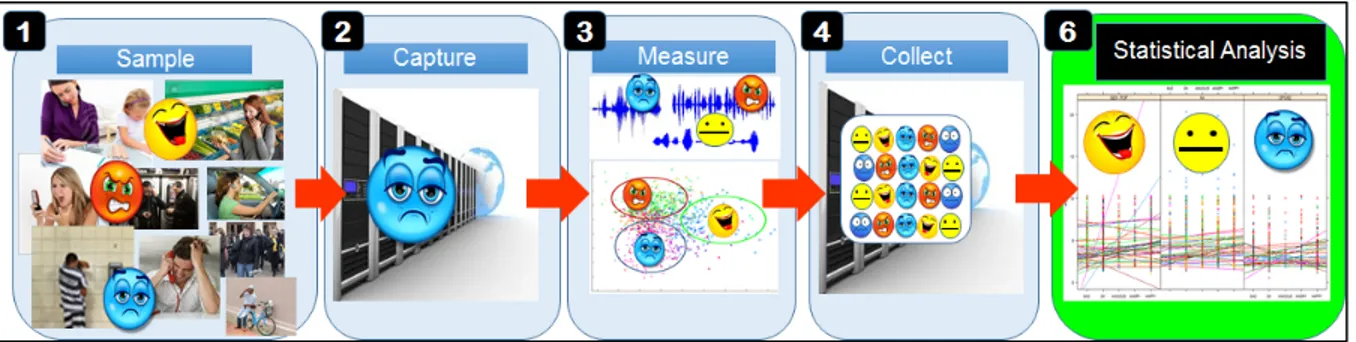
2. Sample, capture, and collect an emotional speech corpus of sufficient size to enable measurement and statistical analysis.
Figure 3 Sample, Capture, and Collect
3. Devise an unsupervised crowd-sourced emotional speech corpus labeling technique.
4. Accurately measure the emotional health of a patient over time.
Figure 5 Measure emotional health over time
5. Devise a real-time auditable approach to emotional health measurement for monitoring patients. This method will improve the accuracy of measurements as reinforcement data becomes available; and provide an indication of the confidence and certainty of the measurement.
Figure 6 Iteratively improve emotional health measurements
6. Evidence-based practices are interventions for which there is consistent scientific evidence showing that they improve client outcomes [8]. In general the highest standard is several randomized clinical trials comparing the practice to alternative practices or to no intervention [8]. A key outcome of this thesis is to provide statistical evidence that capturing and measuring Emotional Health in speech can provide a mechanism:
a. To assist Cognitive Behavioural Therapy (CBT) for psychiatrists and therapists and patients to become aware of symptoms and make it easier to change thoughts and behaviors;
b. For evidence of psychotherapy effectiveness in mental health and substance abuse treatment programs;
Figure 7 Psychotherapy
c. For Medical Doctors and Psychiatrists to measure the effectiveness of psychotropic medication.
Figure 8 Medication
7. Devise patient monitoring and trend analysis tools to provide empirical insight into a patient’s emotional health and accelerate the interview process during monthly assessments by overburdened physicians and psychotherapists. Crisis intervention can be triggered on conditions including the detection of isolation from unanswered calls, or consecutive days of negative emotions.
Crisis in Mental Health
In Canada, only one-third of those who need mental health3 services actually receive them [8]. An experiment conducted in 2011 in Boston to obtain a psychiatric appointment within 2 weeks after discharge from emergency services resulted in only 10 out of 64 facilities (15.6%) able to schedule an appointment [9].
The estimated American outpatient medical care expenditure for mental health is $592 Billion per year with the proportion of psychotherapy expenditure at 44.7% or $264 Billion [10]. The Canadian public health system cost for addiction treatment is $5 Billion annually [11]. In 2004, 56 % of inmates in State prisons and 45% of inmates in Federal prisons had a mental health problem in the past year [12]. 48% of the 1.6 million inmates in federal prison were serving time for a drug offence [13].
The Substance Abuse and Mental Health Services Administration (SAMSHA) reported that among the American adult population aged 18 or older (hereafter “adults”) in 2011, there were an estimated 19.6% (45.6 million) with any mental illness (AMI) [12].
Figure 10 Mood Disorders
The National Institute of Mental Health (NIMH) estimate for diagnosed mental health disorders in the adult population is 26.2% (57.7 million)4 per year. 9.5% (20.9 million) have
3 The American Substance Abuse and Mental Health Services Administration definition for “any mental illness”
is as follows: having (currently or at any time in the past year) a diagnosable mental, behavioral, or emotional disorder (excluding developmental and substance use disorders) of sufficient duration to meet diagnostic criteria specified within the DSM-IV.
a mood disorder, 6.7% (14.8 million) have a major depressive disorder, and 18.1% (40 million) have an anxiety disorder5 [14]. In 2008, 21% of military personnel in all services reported symptoms that suggested the need for further depression evaluation. 17% of military personnel had received mental health counselling in the past year [12].
Crisis in Substance Abuse
Mood disorder and anxiety are directly associated with substance abuse [15]. The National Epidemiologic Survey on Alcohol and Related Conditions [16] performed a survey of 43,093 respondents. Among respondents with any drug use disorder who sought treatment, 60.31% had at least one independent mood disorder, 42.63% had at least one independent anxiety disorder, and 55.16% had a comorbid alcohol use disorder. 40.7% of respondents with an alcohol use disorder had at least one current independent mood disorder, while more than 33% had one current anxiety disorder.
Conservatively, it is estimated that 80% of the 18.9 million Americans suffering from substance annually [12] do not get help for their addiction. In 2011 there were 13,720 substance abuse treatment facilities with 1.24 million patients in the United States [17]. 48% of the 1.6 million inmates in federal prison were serving time for a drug offence [13]. The American membership of Alcoholics Anonymous as of 2012 is estimated at 1.29 million [18]. There are no membership statistics on the considerably smaller drug-related fellowships including Narcotics Anonymous, Cocaine Anonymous, and Marijuana Anonymous.
Substance seeking behaviour has negative and devastating consequences for society [19]. The total costs for substance abuse (includes lost productivity, health and crime-related costs) in the United States is $416 billion annually; ($181 billion for illicit drugs [20] and $235 billion for alcohol [21]). Among the 19.6% of adults with AMI, 17.5% (8.0 million) met the criteria for substance dependence or abuse (illicit drugs or alcohol). 5.8% (10.9 million) of
higher estimate of 36.2% versus the NIMH estimate of 19.6%.
5 Disorders may co-occur, thus the subsets of mood, anxiety, and depression do not add up to the total mental
the adult population who did not have mental illness in the past year also met criteria for a substance use disorder [22]. Opiate addiction is a global epidemic and is associated with many health consequences such as fatal overdose, infectious disease, and undesirable social consequences like, public disorder, crime and elevated health care costs [4].
Positive Emotions
Happy individuals are less likely to engage in harmful and unhealthy behaviours, including smoking, unhealthy eating, and abuse of drugs and alcohol [8]. Happy people are healthier, more optimistic, have higher self-esteem and self-control, and are more likely to increase their income in the future [8].
Genetics accounts for about 50% of variation in happiness, life circumstances account for 10%, and intentional activities are responsible for the remaining 40% [23, 24]. Improving Happiness through genetics is now possible. For example, Blum et al. [25] provided preliminary evidence that utilization of a customized dopamine agonist LG839 deoxyribonucleic acid (DNA) significantly increases happiness. Positive activity reinforcement is the domain of psychotherapy and treatment. Negative activity discouragement is the domain of psychotropic medication, psychotherapy and treatment.
Lyubomirsky et al. [23] examined 293 samples comprising over 275,000 participants from 225 papers studying happiness. Frequent positive affect as a hallmark of happiness has strong empirical support. The relative proportion of time that people felt positive relative to negative emotions was a good indicator of self-reports of happiness, whereas intensity of emotions was a weak indicator. People who reported high levels of happiness had predominantly positive affect (stronger positive emotions than negative) 80% or more of the time. Positive emotions might help people exert willpower and self-control over unhealthy urges and addictions.
Tugade et al. [26] determined that substantial empirical evidence supports the anecdotal wisdom that positive emotions are good for health. Those who used greater proportion of positive emotion words (versus negative emotion) showed greater positive morale and less depressed mood.
Fredrickson’s broaden-and-build theory [27] suggests that multiple, discrete positive emotions are essential elements of optimal functioning. “Objective happiness" can best be measured by tracking (and later aggregating) people's momentary experiences of good and bad feelings. The overall balance of people's positive and negative emotions has been shown to predict their judgments of subjective well-being.
Dodge [28] concluded that higher depressive symptom scores significantly predicted and decreased likelihood of abstinence, after treatment center discharge, regardless of type of substance abuse, frequency of substance use, or length of stay in treatment. Dodge further stated that treatment approaches addressing the depressive symptoms are likely to enhance substance-abuse treatment outcomes.
Processing and Expressing Emotions
Figure 11 Affect, Self-Awareness, and Empathy
Scott [2] refers to “emotional muscle” as a necessary skill to cope with life's problems. Scott further elaborates: “For personal growth to occur, one must learn to process unpleasant feelings rather than running away from them by using drugs and alcohol. Addicts are very
inexperienced in processing feelings. As they come to understand their emotions, they develop the ability to tolerate them more and change their responses. Each time a client experiences a negative emotion without mood altering through drugs or alcohol he/she learned to take control a little more. The more clients do this, the stronger they become and the more emotional muscle they develop to cope with life's problems. Most chemically-dependent individuals cannot identify their feelings and do not know how to express6 some effectively. Entire sessions are spent on each of the following emotions: anger, happiness, fear, depression, anxiety, and shame. Clients are asked to monitor their feelings by using a handout of a clock. At each hour on the clock they ask themselves “how am I feeling?” The goal is to become consciously aware of their internal state and how they are feeling change throughout the day and how feelings are related to other aspects of their lives.”
Wurmser [29] coined the term “concretization” as the inability to identify and express emotions — a condition that often goes hand-in-hand with compulsive drug use. Wurmser further states: “it is as if these individuals have no language for their emotions of inner life; they are unable to find pleasure in every-day life because they lack the inner resources to create pleasure.”
Opioid addicts on methadone maintenance (a synthetic drug used as a substitute, administered over a prolonged period of time as treatment for someone who is addicted to opioids such as heroin) appear to be less reactive to mood induction at times of peak plasma methadone concentration than non-addict controls; this suggests that methadone blunts both elative and depressive emotional reactivity [12]. There is evidence for a relationship between Substance Use Disorder and three biologically-based dimensions of affective temperament and behavior: negative affect (NA), positive affect (PA), and effortful control (EC). High NA, low EC, and both high and low PA were each found to play a role in conferring risk and maintaining substance use behaviours [10].
6 “Affect” as defined by DSM-IV is a pattern of observable behaviors that is the expression of a subjectively
experienced feeling state (emotion). Flat affect refers to a lack of outward expression of emotion that can be manifested by diminished facial, gestural, and vocal expression [15].
Introduction to Emotional Health
There has been a shift in mental health services from an emphasis on treatment focused on reducing symptoms based on health and disease, to a more holistic approach which takes into consideration quality of life [24]. Historically, the primary outcome goals for substance abuse treatment are harm reduction and cost effectiveness; with secondary outcomes including quality of life, and reduction of psychological symptoms [30]. It may be time to reconsider treatment priorities. There is evidence that happy individuals are less likely to engage in harmful and unhealthy behaviours, including abuse of drugs and alcohol [25]. In addition, treatment approaches addressing the depressive symptoms are likely to enhance substance-abuse treatment outcomes [28].
Quality of life is characterized by feelings of wellbeing, control and autonomy, a positive self-perception, a sense of belonging, participation in enjoyable and meaningful activity, and a positive view of the future. Emotional Health encompasses key aspects of quality of life including feelings, self-perception, and emotional connection with other people [2, 15, 16, 23, 26, 31, 32]. Measuring the capacity to live life with predominantly positive emotions (an average person is positive 80% of the time [23]); self-awareness of one’s own emotions, emotional expressiveness (affect), and empathy for other people’s emotions can provide insight into emotional health.
Emotion Set to Measure Quality of Life and Mood Disorders
Figure 13 Emotion Set
Three sets of factors were considered in determining the set of five emotions (Neutral, Happy, Sad, Angry, and Anxious). (1) Depression, anger, and anxiety are associated with mental health disorders and substance abuse. (2) Happiness is an indicator of Quality of life [24]; (3) Human short term memory limits choices that a person can remembered to five (Miller proved that human short-term memory has a forward memory span of 7 ± 2 [33]); (4) The state of the art in automatic emotion classification is five emotions [34].
Most researchers agree [35] that emotions are short-term reactions to events or stimuli. Moods are not necessarily linked to an obvious cause or event [35]. They may influence actions and behaviour, but they do not interrupt ongoing behaviour and do not prepare immediate actions like emotions can [35]. The usual intensity of a mood is low to medium, and may last hours or even days or weeks, e.g. depression [35].
Many researchers have attempted to define the primary human emotions. In 1995, Goleman [36] grouped emotions into 8 primary emotions: (anger, sadness, fear, enjoyment, love, surprise, disgust, shame); but faith, encouragement, forgiveness, complacency, and boredom do not map neatly into these primary categories. In 1999, Ekman [37] proposed 15 primary emotions.
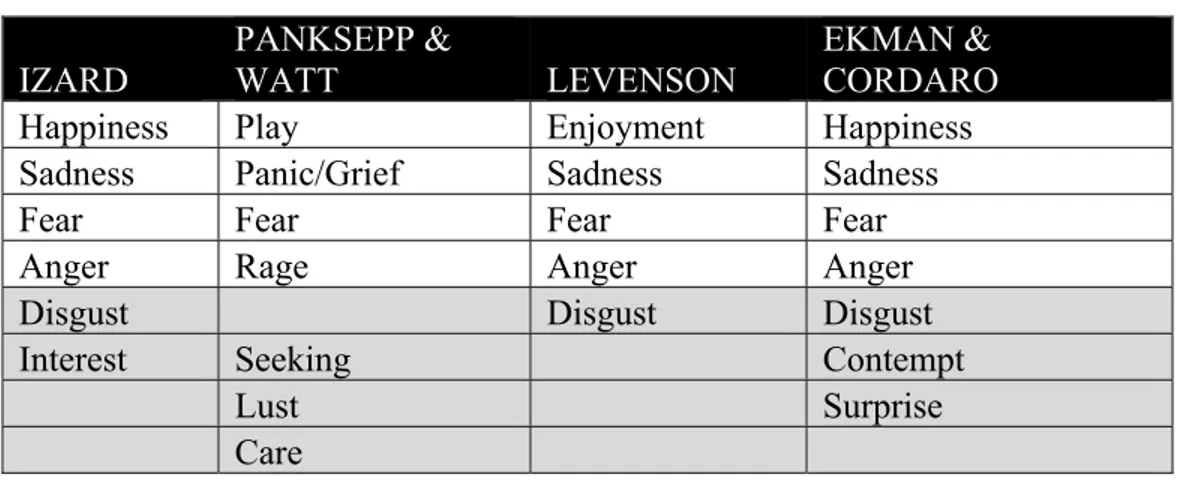
In 2011, four lead emotion researchers’ theoretical models of basic emotions were compared by Tracy et al. [38] and were found to share Happiness, Sadness, Fear and Anger in common.
Table 1 Comparison of four lead authors’ theoretical emotion models IZARD PANKSEPP & WATT LEVENSON EKMAN & CORDARO
Happiness Play Enjoyment Happiness
Sadness Panic/Grief Sadness Sadness
Fear Fear Fear Fear
Anger Rage Anger Anger
Disgust Disgust Disgust
Interest Seeking Contempt
Lust Surprise
Care
Happiness is an indicator of positive emotional health. Anger, depression and anxiety are key emotions in mood disorder and substance abuse. Fear and anxiety are overlapping, aversive, activated states centered on threat; clinical anxiety has been described as an ineffable and unpleasant feeling of foreboding [39].
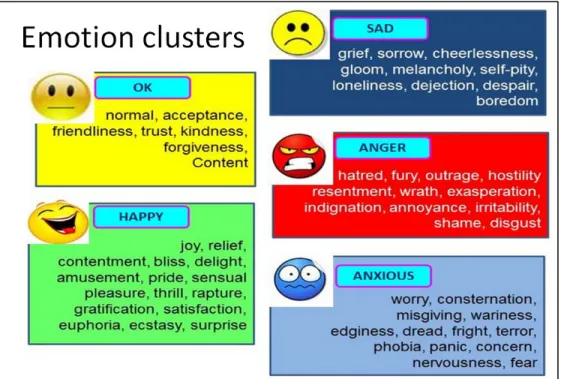
The five emotions categories map well to Cognitive Behaviour Therapy (CBT) [40]as shown in Figure 14.
Figure 14 Five Emotions Mapped to CBT
Figure 15 Emotion Cluster Mapping
State-of-the-art in Emotion Detection
What level of emotional truth accuracy is required for a viable commercial emotion classification system? In deterministic automatic classification problems like image recognition and speech recognition, the 80% accuracy benchmark [41] is a good threshold for viable commercialization of automatic classification systems. However, we discover in this thesis that emotional truth accuracy is not a black and white measurement. Determining the emotional truth for people with flat affect can be confusable. This confusability could provide insight on a person’s expressiveness/affect.
Nwe et al. [42] conducted experiments to measure the performance of human classification of utterances into six classes: (Anger, Dislike, Fear, Joy, Sadness, Surprise). The average performance was 65.7%. The language of the utterances presented to the human subject was neither his mother tongue nor any other language that he has any knowledge to perceive linguistically; thus assuring only acoustic features were considered.
Steidl et al. [43] measured the performance of transcribers who listened to speech utterances and labeled the emotional content. In most cases, three out of five people could agree on the emotional content.
Five emotion classes is the current state-of-art in automatic emotion detection. The INTERSPEECH 2009 Emotion Challenge [34], was held in conjunction with INTERSPEECH 2009 in Brighton, UK, September 6-10. This challenge was the first open public evaluation of speech-based emotion recognition systems with strict comparability where all participants were using the same corpus. The German FAU Aibo Emotion Corpus of spontaneous, emotionally coloured speech of 51 children served as a basis. The results was 41.65% unweighted (UA) recall for the five-class problem (Angry, Emphatic, Neutral, Positive and Rest) by Kockmann et al. [34]. Dumouchel et al. [34] achieved 39.40% recall. The Dumouchel et al. algorithm [44], described in detail in chapter 5, is the basis for emotion detection in this thesis.
It is hypothesized that providing confidence and certainty scores of the classified emotion in speech will enable statistical analysis and allow professionals to monitor patients even when emotion classification is confusable and nondeterministic.
Sampling a Person’s Experience over the Telephone
The Experience Sampling Method (ESM) is the best method to collect momentary emotional states in a person’s natural environment [45]. The benefits of the Ecological Momentary Assessment method (EMA which includes ESM) are avoidance of recall and bias by collecting data on momentary states, realization of ecological validity by collecting data in the real-world, and achievement of temporal resolution enabling an analysis of dynamic processes over time [45].
Stone et al. [46] examined Patient-Reported-Outcome (PRO) ESM data collection and concluded PRO ESM places considerable demands on participants. Stone states that the
success of an ESM data collection depends upon participant compliance with the sampling protocol. Participants must record an ESM at least 20% of the time when requested to do so; otherwise the validity of the protocol is questionable. The problem of “hoarding” – where reports are collected and completed at a later date – must be avoided. Stone found that only 11% of pen-and-pencil diary studies are compliant; 89% of participants missed entries, or hoarded entries and bulk entered them later.
Hufford [47] also concluded that subject burden is a factor effecting compliance rates. Hufford states that at least six different aspects affect participant burden: Density of sampling (times per day); length of PRO assessments; the user interface of the reporting platform; the complexity of PRO assessments (i.e. the cognitive load, or effort, required to complete the assessments); duration of monitoring; and stability of the reporting platform. Researchers [46] have been known to improve compliance through extensive training of participants.
Figure 16 Emotional Health Sampling over the Telephone
Interactive Voice Response (IVR), as depicted in Figure 16, overcomes hoarding by time-sampling and improve compliance by allowing researchers to actively place outgoing telephone calls to participants in order to more dynamically sample their experience [47]. Rates of compliance in IVR sampling literature vary from 40% to 96% [47].
IVR ESM, avoids deployment costs associated with self-report systems on smartphones. There are 5 Billion mobile and phone users worldwide; only 1.5 Billion have access to a smartphone [48]. To deploy on all smartphones, you must build Apple iPhone Operating System (iOS), Android, Blackberry, and Symbian applications. Providing patients with a
smartphone is expensive; typical cost is $500 with reoccurring monthly telephony carrier charges of $30 or more. A severely afflicted addict may sell their smartphone for drugs.
Subject burden is addressed by limiting call duration to as little as 15 seconds, and providing an intuitive user interface design with no need for training. Calling subjects at times of their convenience further maximizes compliance rates. A patient is called and prompted with “How are you feeling?” The audio response (e.g. “I am angry!”) is recorded in the cloud.
Emotional Health Statistical Analysis and Monitoring
Longitudinal regression analysis can provide evidence of the effectiveness of psychotropic medication, psychotherapy, and substance abuse rehabilitation. Monitoring and trend analysis can provide empirical insight and accelerate the interview process during monthly assessments by overburdened physicians and psychotherapists. Crisis intervention can be triggered on conditions including the detection of isolation from unanswered calls, or consecutive days of negative emotions.
Patient Monitoring Benefits for Physicians and Psychotherapists
The average community mental health services’ psychiatric follow-up is once a month for unstable patients and once every three months for stable patients [49]. A stable psychiatric outpatient session is estimated at 20 minutes (15 minute interview + 5 minutes for documentation). A session for an unstable outpatient is estimated at 40 minutes (30-minute interview + 10 minutes for documentation) [49]. Patient recall of events, feelings, and behaviours during the month(s) between sessions may not be reliable or objective, as detailed in APPENDIX A.
Figure 18 Monitor Patients’ Emotional Health over Time
Empirical emotional health data and trend analysis using a toolkit that records emotion data should improve understanding of a patient between sessions. Emotional recordings can be played back to trigger recall of events and behaviours associated with peaks and valleys of longitudinal emotional state charts. Historical data can be reviewed for evidence of progress.